DOI:
10.1039/C8RA07009A
(Paper)
RSC Adv., 2018,
8, 33681-33687
Degradation of dichloroacetonitrile by a UV/peroxymonosulfate process: modeling and optimization based on response surface methodology (RSM)
Received
21st August 2018
, Accepted 25th September 2018
First published on 1st October 2018
Abstract
Response surface methodology (RSM) was utilized to model and optimize the dichloroacetonitrile (DCAN) degradation process by UV/PMS. A quadratic function between DCAN degradation efficiency and three factors including dosage of PMS, UV power and retention time was obtained. The model fitted very well according to high the value of R2 (0.9919) and Adj-R2 (0.9814). Additionally, the analysis of variance showed the influence of factors on degradation efficiency followed: retention time > UV power > dosage of PMS. Finally, the optimum conditions were suggested under this model. The degradation efficiency reached the maximum value of 96.2% with the optimum conditions: dosage of PMS = 0.2 mM, UV power = 7.95 W, retention time = 80 min.
1 Introduction
With the first discovery of trihalomethanes in drinking water in 1974,1 the risk of disinfection by-products (DBPs) in drinking water has attracted much attention. Compared to conventional carbonaceous disinfection by-products (C-DBPs) such as trihalomethanes and haloacetic acids, nitrogen-containing disinfection by-products (N-DBPs), especially HANs, have received more attention in recent years due to their greater toxicity to mammals. The genotoxicity of HAN is the strongest of all DBPs, and its cytotoxicity is 200 times higher than that of haloacetic acid.2
Some scholars have measured the N-DBP concentration of drinking water of twelve water treatment plants in the United States, and found that the concentration of HANs was the highest, reaching 14 μg L−1.3 In Izmir, Turkey, the total HAN concentration of tap water was measured and reached 88.4 μg L−1.4 Due to the extremely high toxicity of HANs, the World Health Organization makes a guideline for the limits of HANs in drinking water: the concentration of DBAN and DCAN should not be more than 70 μg L−1 and 20 μg L−1, respectively.5 In the measurement results of HANs in some drinking waters, the concentration level of DCAN is the highest, exceeding 90% of the total HAN concentration.3,4 As a result, it is meaningful and important to control HANs (especially DCAN) in drinking water.
According to previous studies, the control of HANs could be mainly divided into three strategies: (1) removing the HANs precursors in the water before disinfection; (2) studying the formation mechanism of HANs in the chlor(am)ination disinfection process, and optimizing the formation process to reduce the amount of HANs generated;6 (3) directly removing HANs after chlor(am)ination.7 Although the first two methods have certain effects on the control of HANs in drinking water, HANs inevitably formed in the water distribution system due to the presence of residual chlorine. Therefore, the direct removal of HANs (not for their precursor) has the potential advantage for HANs control. Some studies have proved the high efficiency for removing HANs.7,8 However, these studies often focused on the mechanism and theoretical research of reaction process. There has been no report on the modeling or optimization the degradation process for application in reality.
In this paper, RSM was utilized to model and optimize the dichloroacetonitrile (DCAN) degradation process by UV/PMS. Moreover, the effects and interactions of factors including dosage of PMS, UV power and retention time were investigated using the experiment design methodology. Finally, the optimized condition of the process was proposed and verified.
2 Material and methods
2.1 Chemical
Peroxymonosulfate (KHSO5·0.5KHSO4·0.5K2SO4) and methyl t-butyl ether (MTBE) were purchased from Aladdin. DCAN was obtained from Macklin Biochemical Co., Ltd. Sodium dihydrogen phosphate and dibasic sodium phosphate was purchased from the National Chemical Reagent Co. (Chongqing, China). All the other reagents were obtained from J&K Chemical Reagent Co., Ltd. Solutions were prepared with double deionized water (18.2 MΩ cm).
2.2 Analysis
Samples of 3 mL were withdrawn at predetermined time intervals form the reactor. Then 3 mL of MTBE was added as an extraction solvent. After that, the mix was vigorously shaken for 2 min, and left idle for 4 min. The MTBE layer was transferred into a 2 mL amber vial. One microliter of the solvent was injected into a GC-ECD equipped with HP-5 capillary column (Agilent 7890A, USA) according to EPA.551.1.9 The temperature of injector was programed at 150 °C. The initial column temperature was at 40 °C and rose to 240 °C at 40 °C min−1 afterwards, then remained at 240 °C for 1 min. The temperature of detector was at 250 °C. The retention time of DCAN was 3.02 min and extraction efficiency was about 55.7%. The pH of solution was determined by a pH meter (Hach HQ11D, USA).
2.3 Experimental procedures
The phosphate buffer was used to maintain the pH of the reaction at around 7.0. The UV lamp (GPH212T5L/4, 254 nm, 10 W, Heraeus, Germany) with a quartz sleeve was inserted vertically into the reactor to ensure the reaction system was radiated uniformly. The initial concentration of DCAN was set at 2 μM. A water bath was applied to keep the temperature of reaction at about 25 °C. there was a magnetic stirrer (400 rpm) at the bottom of the reactor to mix the reaction. Diffident length of tin foil paper was used to cover the UV lamp to adjust the UV power inputted to the reaction.
2.4 Deign of experiment with response surface methodology
The RSM based on Box-Behnken Design (BBD) was employed to investigate the interactions of three factors though seventeen sets of experiments. The ranges and levels of three variables was shown in Table 1. A second-order polynomial equation was applied in date analysis to response the three variables according to eqn (1).10| |
 | (1) |
Table 1 Ranges and levels of the variables for experimental design
| Variables |
Code |
Unit |
Ranges and levels |
| −1 |
0 |
1 |
| Dosage of PMS |
A |
mM |
0.2 |
0.35 |
0.5 |
| UV power |
B |
W |
2 |
6 |
10 |
| Retention time |
C |
min |
20 |
50 |
80 |
Y is the predicated response (degradation efficiency of DCAN). βi, βii and βij are regression coefficients and β0 is the interception coefficient. The data analysis including variance (ANOVA) and proper regression equation was obtained though Design Expert 8.05b. Moreover, response surfaces and optimal condition of the process were obtained afterwards.
3 Results and discussion
3.1 Effect of factors
The effect of dosage of PMS, UV power and pH were shown in Fig. 1–3. As present in Fig. 1, with the dosage of PMS increased from 0.2 mM to 0.35 mM, the degradation efficiency of DCAN increased significantly. It was due to that more free radicals including SO4−˙ and ·OH were produced by the increase of PMS dosage (eqn (2)), leading to the acceleration of the degradation. However, the degradation efficiency remained almost the same value which the dosage of PMS increased from 0.35 mM to 0.5 mM. It could be explained that self-quenching (eqn (3) and (4)) and self-combination (eqn (5) and (6)) of free radicals was occurred, because of excess PMS in the system.11 Therefore, further increasing the dosage of PMS has negligible significance for improving the degradation efficiency.| |
 | (2) |
| | |
HSO5− + SO4−˙ → SO5−˙ + SO42− + H+
| (3) |
| | |
HSO5− + HO˙ → SO5−˙ + H2O
| (4) |
| | |
SO4−˙ + SO4−˙ → S2O82−
| (5) |
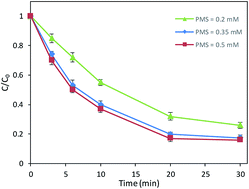 |
| | Fig. 1 Effects of PMS dosage on DCAN degradation. Conditions: initial concentration of DCAN = 2 μM, temperature = 25 °C, pH = 7.0, UV power = 10 W. | |
Fig. 2 showed the effect of UV power on DCAN degradation efficiency. With UV power increased from 2 W to 6 W, the degradation efficiency of DCAN increased about 24% after 30 min. However, the degradation rate even had a slight decline with UV power increased from 6 W to 10 W in the first period of reaction. It might be because excessive UV power accelerated the photolysis of PMS, which made the radicals excessive, resulting the self-quenching of radicals.
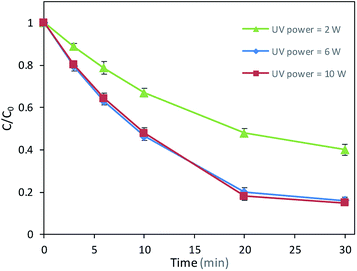 |
| | Fig. 2 Effects of UV power on DCAN degradation. Conditions: initial concentration of DCAN = 2 μM, temperature = 25 °C, pH = 7.0, PMS = 0.5 mM. | |
Due to the hydrolysis, DCAN was unstable while in alkaline conditions.12 Thus, the effect of pH on the degradation was examined with pH ranging from 3.0 to 7.0. As shown in Fig. 3, the degradation efficiency was 77% at pH 7.0 after 30 min reaction, which increased slightly to 83% and 90% with the pH of solution at 5.0 and 3.0, respectively. It indicated the degradation rate was slightly faster in acidic condition than that in neutral condition. It was consistent with previous research on the degradation of sucralose.13 The reason might be that the oxidation capacity of ·OH deceased with increasing pH value. ·OH has a standard redox potential of 2.7 V in acidic pH condition and 1.8 V in neutral pH condition.14
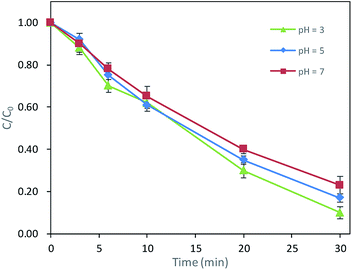 |
| | Fig. 3 Effects of pH on DCAN degradation. Conditions: initial concentration of DCAN = 2 μM, temperature = 25 °C, PMS = 0.4 mM, UV power = 6 W. | |
The target of the oxidization process was DCAN. It was high cytotoxic and genotoxic and frequently found in drinking water. Consequently, UV/PMS process studied in this paper was aimed at drinking water which kept neutral in most cases. Moreover, it is hard to adjust pH in the practical drinking water treatment. Based on this, the effect of pH was not discussed in the RSM design and the pH of solution was kept around 7.0 though phosphate buffer in the experiments afterwards.
3.2 Model fitting and statistical analysis
According to Box–Behnken design, the batch runs was executed and the values of experiment and predicated values were present in Table 2. The regression equation was obtain as following:| | |
Y = −87.44 + 207.78A + 19.52B + 1.83C − 11.08AB − 1.489AC − 0.08BC − 28.33A2 − 0.67B2 − 3.40 × 10⁻³C2
| (7) |
where A, B and C represent dosage of PMS, UV power and retention time, respectively. Y is the degradation efficiency of DCAN.
Table 2 Experimental design matrix and the value of responses
| Run |
Variables |
Degradation efficiency of DCAN (Y, %) |
| PMS (mM) |
UV (W) |
Time (min) |
Actual |
Predicted |
| 1 |
0.35 |
6 |
50 |
82.0 |
83.6 |
| 2 |
0.35 |
2 |
80 |
78.4 |
80.2 |
| 3 |
0.35 |
6 |
50 |
81.5 |
83.6 |
| 4 |
0.5 |
6 |
80 |
95.0 |
94.4 |
| 5 |
0.35 |
6 |
50 |
84.5 |
83.6 |
| 6 |
0.35 |
10 |
20 |
81.2 |
79.5 |
| 7 |
0.35 |
6 |
50 |
84.4 |
83.6 |
| 8 |
0.35 |
2 |
20 |
30.2 |
31.9 |
| 9 |
0.35 |
6 |
50 |
85.6 |
83.6 |
| 10 |
0.2 |
6 |
20 |
51.4 |
52.0 |
| 11 |
0.2 |
10 |
50 |
84.5 |
85.6 |
| 12 |
0.2 |
6 |
80 |
93.1 |
93.7 |
| 13 |
0.5 |
10 |
50 |
84.1 |
86.4 |
| 14 |
0.5 |
2 |
50 |
73.3 |
72.2 |
| 15 |
0.35 |
10 |
80 |
89.5 |
87.8 |
| 16 |
0.5 |
6 |
20 |
80.1 |
79.5 |
| 17 |
0.2 |
2 |
50 |
47.1 |
44.8 |
The experimental values of 17 experiments (shown in Table 2) were inputted to Design Expert 8.05b software. With the model fitting and error calculation, Table 3 was outputted by the software. The results of ANOVA in DCAN degradation were shown in Table 3. The F-value and value of prob. > F were pivotal index for model evaluation.15 A high F-value (F-value = 95) and a low value of prob. > F (prob. > F < 0.05) of the model indicated the model was significant. The F-value of lack of fit was 2.9, which suggested the lack of fit was not significant relative to the pure error. Adeq. precision meant the signal to noise ratio. A value of the ratio greater than 4 was desirable. Adeq. precision of this model was reached to 34.31, which was an adequate signal for the model.
Table 3 Analysis of variance for the quadratic model of DCAN degradation by UV/PMS process
| Source |
Sum of squares |
df |
Mean square |
F-value |
Prob. > F |
|
| Model |
4818.83 |
9 |
535.43 |
95.00 |
<0.0001 |
Significant |
| A-dosage of PMS |
190.37 |
1 |
190.37 |
33.78 |
0.0007 |
|
| B-UV power |
876.33 |
1 |
876.33 |
155.49 |
<0.0001 |
|
| C-retention time |
927.55 |
1 |
927.55 |
164.57 |
<0.0001 |
|
| AB |
176.89 |
1 |
176.89 |
31.39 |
0.0008 |
|
| AC |
179.56 |
1 |
179.56 |
31.86 |
0.0008 |
|
| BC |
398.00 |
1 |
398.00 |
70.62 |
<0.0001 |
|
| A2 |
1.71 |
1 |
1.71 |
0.30 |
0.5988 |
|
| B2 |
483.19 |
1 |
483.19 |
85.73 |
<0.0001 |
|
| C2 |
39.49 |
1 |
39.49 |
7.01 |
0.0331 |
|
| Residual |
39.45 |
7 |
5.64 |
|
|
|
| Lack of fit |
27.03 |
3 |
9.01 |
2.90 |
0.1650 |
Not significant |
| Pure error |
12.42 |
4 |
3.11 |
|
|
|
Moreover, the R2 of 0.9919 and Adj-R2 of 0.9814 indicated the model fitted well with the experiment values. Values of prob. > F less than 0.05 indicate model terms are significant and the influence of model term was positively correlated with the value of F-value. In this model, A, B, C, AB, AC, BC, B2, and C2 were significant model terms, which indicated they had a great influence on the degradation efficiency of DCAN in UV/PMS process. Additionally, the order of the influence among variables followed: C > B > B2 > BC > A > AC > AB > C2. Values greater than 0.10 indicate the model terms are not significant, indicated A2 had negligible influence in DCAN degradation.
The predicated value matched well with experimental value, shown in Fig. 4. It indicated the model fitted well with the actual process. The internally studentized residuals were investigated, as shown in Fig. 5. The plots of residuals were nearly at a straight line, which further proved predicated values and experimental values were almost consistent.16 The plots of residuals versus model predictions and was shown in Fig. 6. As shown in Fig. 6, the plots were distributed randomly, indicating the variance of environmental was a constant value. It suggested that the model was adequate.17 Based on result above, it could stated that the model simulated the actual condition well and the degradation process of DCAN by UV/PMS could be analyzed and explained by this model.
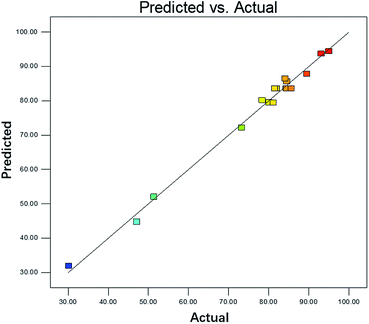 |
| | Fig. 4 Plot of predicted value versus experimental value. | |
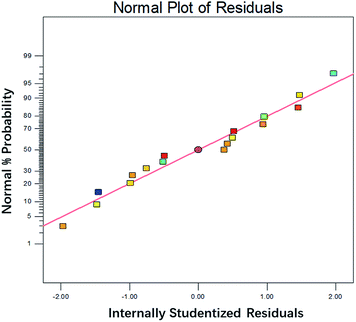 |
| | Fig. 5 The normal plot of residual for 17 experimental values designed by RSM. | |
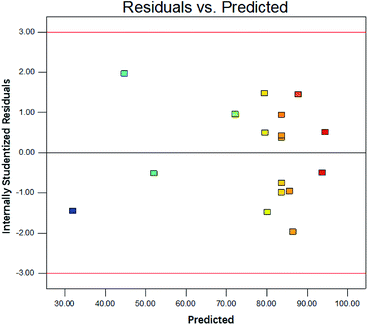 |
| | Fig. 6 Plot of the residual versus model predictions for the DCAN degradation. | |
3.3 Analysis of response surface
Fig. 7 showed the effects of UV power and PMS dosage on the degradation efficiency while the reaction time was kept at 50 min as a constant. As shown in Fig. 7, at the low dosage of PMS, the degradation efficiency increased visibly with the increase of UV power. However, while the dosage of PMS was at a high level (about greater than 0.44 mM), the degradation efficiency increased first and decreased afterwards with the increase of UV power. This phenomenon might be caused by self-quenching and self-combination of free radicals. With the UV power increasing, the decomposition efficiency of PMS increased, which made the free radicals generated by UV/PMS system increased. At the low dosage of PMS, the sulfate radicals and hydroxyl radicals which could be generated by the system were limited. Even if the PMS added in system was completely decomposed, the amount of radicals generated was still relatively small due to the low dosage of PMS. However, with the PMS dosage being at a high level, the decomposition efficiency of PMS was too fast when the UV power continued to increase (about more than 8 W). Self-quenching (eqn (3) and (4)) and self-combination (eqn (5) and (6)) of free radicals was occurred, which reduced the amount of free radicals, resulting the decrease of the degradation efficiency.
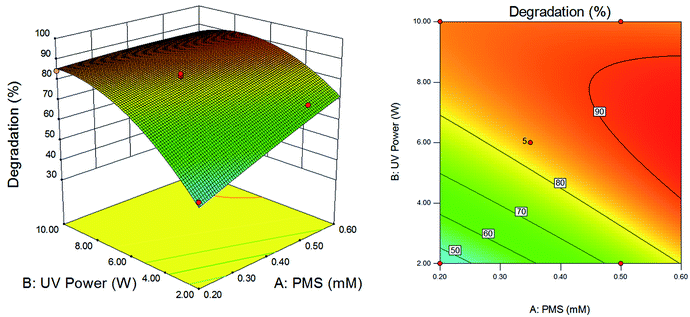 |
| | Fig. 7 Effects of dosage of PMS and power of UV on degradation efficiency of DCAN. Retention time: 50 min. | |
The effects of reaction time and PMS dosage on the degradation efficiency were shown in Fig. 8, with UV power kept at 6 W. As shown, the degradation efficiency increased with increase of reaction time and PMS dosage. While the reaction time was short, the degradation efficiency increased rapidly with the increase of PMS dosage; when the reaction time was longer, the degradation efficiency increased little with the increase of PMS dosage. It could be explained that PMS added in the reaction was not decomposed completely, and the amount of free radicals in the reaction system was relatively small when the reaction time was short. In this condition, the dosage of PMS determined the amount of free radicals and played a crucial role in the degradation efficiency. However, when the reaction time was long enough, PMS added was fully decomposed. The number of free radicals was much larger than the number of DCAN molecules. In this condition, the number of free radicals was not the main influencing factor. As a result, the degradation efficiency was not sensitive to the dosage of PMS.
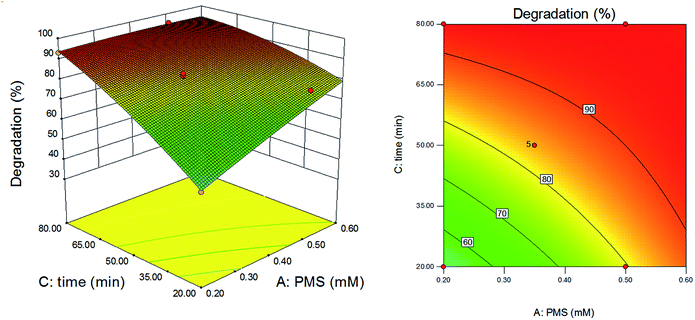 |
| | Fig. 8 Effects of dosage of PMS and retention time on degradation efficiency of DCAN. Power of UV: 6 W. | |
Fig. 9 presented the effects of UV power and reaction time on the degradation efficiency with PMS dosage kept at 0.4 mM. As shown in Fig. 9, when the reaction time was short, the degradation efficiency increased with the increase of UV power. When the reaction time was longer, the degradation efficiency increased initially and decreased afterwards with the increase of UV power, which was similar to that in Fig. 7. For a long reaction time and high UV power, PMS decomposed quickly, generating a large amount of free radicals. The quenching reaction (eqn (3) and (4)) and self-combination (eqn (5) and (6)) of occurred due to excess free radicals, which leaded to an inhibition on the degradation efficiency.
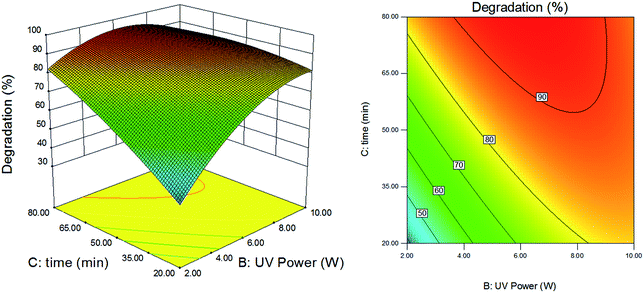 |
| | Fig. 9 Effects of power of UV and retention time on degradation efficiency of DCAN. Dosage of PMS: 0.4 mM. | |
Based on Table 3 and Fig. 7–9, the influence of factors was followed: retention time > UV power > dosage of PMS. The conclusion could be a guide for an actual project. In the design of water treatment equipment of UV/PMS process, compared with dosage of PMS, the hydraulic retention time and UV power should be given more priority. Moreover, in actual engineering, experiments should be conducted on UV lamps to obtain the proper UV power, preventing setting excessive UV power and self-quenching and self-combination of free radicals.
3.4 Optimization of the operating parameters and verification of the model
According to the optimization function of Design Expert 8.05b, the optimum condition of this model was suggested though the derivation of the quadratic polynomial model equation and scope of the three independent variables (PMS dosage, UV power and retention time). The degradation efficiency would reach the maximum value of 96.2% with the optimum condition: dosage of PMS = 0.2 mM, UV power = 7.95 W, retention time = 80 min. To verify the model prediction, three sets of parallel experiments were carried out under the optimal conditions of model optimization. The average of degradation efficiency was 95.7%, which was almost consistent with the predicted value of the model. The reliability of the model was successfully verified. It could be concluded that RSM could be used to optimize the process of DCAN degradation by UV/PMS.
4 Conclusion
In this study, RSM was utilized to model and optimize the dichloroacetonitrile (DCAN) degradation process by UV/PMS. The model fitted well with the experiment data according to high value of R2 (0.9919) and Adj-R2 (0.9814). The effects of PMS dosage, UV, residence time and interaction effects were also studied. Based on ANOVA results, the influence of factors on degradation efficiency was followed: retention time > UV power > dosage of PMS. The quadratic function relationship between the degradation efficiency and the three influencing factors was given. Under optimal conditions (PMS = 0.2 mM, UV power = 7.95 W, retention time = 80 min), the degradation efficiency reached the maximum value of 96.2%, which was consistent with the experimental value of 95.7%. In a conclusion, this work showed that the model based on RSM could be utilized to study and optimize the process of DCAN degradation by UV/PMS.
Conflicts of interest
There are no conflicts to declare.
Acknowledgements
We are thankful for the financial support from the National key research and development plan of China (Grant no. 2017YFC0806305), the National Natural Science Foundation of China (Grant no. 51508564).
References
- J. J. Rook, Water Treat. Exam., 1974, 23, 234–243 Search PubMed
 .
. - M. G. Muellner, E. D. Wagner, K. McCalla, S. D. Richardson, Y. Woo and M. J. Plewa, Environ. Sci. Technol., 2007, 41, 645–651 CrossRef CAS PubMed
 .
. - S. W. Krasner, H. S. Weinberg, S. D. Richardson, S. J. Pastor, R. Chinn, M. J. Sclimenti, G. D. Onstad and A. D. Thruston, Environ. Sci. Technol., 2006, 40, 7175–7185 CrossRef CAS PubMed
 .
. - D. Baytak, A. Sofuoglu, F. Inal and S. C. Sofuoglu, Sci. Total Environ., 2008, 407, 286–296 CrossRef CAS PubMed
 .
. - W. H. Organization, Guidelines for Drinking-water Quality, World Health Organization, 2011, ISBN 978-92-4-155001-7 Search PubMed
 .
. - S. Ding, W. Chu, T. Bond, Q. Wang, N. Gao, B. Xu and E. Du, J. Hazard. Mater., 2018, 341, 112–119 CrossRef PubMed
 .
. - S. Hou, L. Ling, C. Shang, Y. Guan and J. Fang, Chem. Eng. J., 2017 DOI:10.1016/j.cej.2017.03.042
 .
. - P. Kiattisaksiri, E. Khan, P. Punyapalakul and T. Ratpukdi, Water Res., 2016, 98, 160 CrossRef CAS PubMed
 .
. - U. S. EPA, Determination of chlorination disinfection byproducts, chlorinated solvents, and halogenated pesticides/herbicides in drinking water by liquid-liquid extraction and gas chromatography with electron-capture detection (Revision 1.0), 1995 Search PubMed
 .
. - L. C. Almeida and S. Garcia-Segura, Appl. Catal., B, 2011, 103, 21–30 CrossRef CAS
 .
. - J. A. Khan, X. He, H. M. Khan, N. S. Shah and D. D. Dionysiou, Chem. Eng. J., 2013, 218, 376–383 CrossRef CAS
 .
. - N. Gao, J. Huazhong Univ. Sci. Technol., Med. Sci., 2011, 39, 111–114 CAS
 .
. - Y. Xu, Z. Lin, Y. Wang and H. Zhang, Chem. Eng. J., 2017, 317, 561–569 CrossRef CAS
 .
. - G. V. Buxton, C. L. Greenstock, W. P. Helman and A. B. Ross, J. Phys. Chem. Ref. Data, 1988, 17, 513–886 CrossRef CAS
 .
. - S. Bose and C. Das, Ind. Eng. Chem. Res., 2014, 53, 12319–12329 CrossRef CAS
 .
. - R. H. Myers, D. C. Montgomery and C. M. Anderson-Cook, Response Surface Methodology: Process and Product Optimization Using Designed Experiments, Wiley, Hoboken 2009 Search PubMed
 .
. - L. Y. Cherif, I. Yahiaoui, F. Aissanibenissad, K. Madi, N. Benmehdi, F. Fourcade and A. Amrane, Ind. Eng. Chem. Res., 2014, 53, 3813–3819 CrossRef
 .
.
|
| This journal is © The Royal Society of Chemistry 2018 |
Click here to see how this site uses Cookies. View our privacy policy here.  Open Access Article
 *b,
Wei Penga,
Wensi Xua,
Zhongguo Lia,
Chong Zhoua and
Zhendong Fang*a


.
.
.
.
.
.
.
.
.
.
.
.
.
.
.
.
.


