
 Open Access Article
 This Open Access Article is licensed under a Creative Commons Attribution-Non Commercial 3.0 Unported Licence
A novel fluorescent long-chain fatty acid-substituted dye: labeling and biodegrading of Microthrix parvicella
Yingchun Gu†
a,
Dayong Lin†b,
Xuening Fei *a,
Cuihong Wanga,
Qi Yanga,
Yalin Tang*c and
Xueling Rend
*a,
Cuihong Wanga,
Qi Yanga,
Yalin Tang*c and
Xueling Rend
aTianjin Engineering Technology Center of Chemical Wastewater Source Reduction and Recycling, School of Science, Tianjin Chengjian University, Tianjin, 300384, China. E-mail: xueningfei@126.com
bAnda Duosen New Material Technology CO., LTD, Heilongjiang Province 151400, China
cBeijing National Laboratory for Molecular Sciences, Institute of Chemistry, Chinese Academy of Sciences (ICCAS), Beijing, 100190, China. E-mail: tangyl@iccas.ac.cn
dKey Laboratory of Targeting Therapy and Diagnosis for Critical Diseases, School of Pharmaceutical Sciences, Zhengzhou University, Henan Province 450001, China
First published on 22nd October 2018
Abstract
Microthrix parvicella (M. parvicella) is a filamentous bacterium that induces bulking in activated sludge. Here, we used the affinity of long-chain fatty acids (LCFA) for M. parvicella to create a novel fluorescent probe of carbazole modified by LCFA. The structure was characterized by 1H NMR spectroscopy and mass spectrometry. The spectral properties, photostability, and hydrophobic properties of the probe were also characterized. Fluorescent-labeling results showed that it can label M. parvicella in situ and could be biodegraded via metabolism. The stable docking mode of carbazole probes with different fatty acid chains and lipases was also docked by the density functional tight-binding (DFTB) method.
1. Introduction
Activated sludge-bulking occurs in wastewater treatment plants (WWTPs) with a wide range and frequency. This causes great damage and is difficult to treat. The literature shows that excessive proliferation of Microthrix parvicella (M. parvicella) is responsible for 90% of sludge-bulking.1–5 Therefore, if M. parvicella can be targeted, then methods for early identification and treatment could prevent or solve the issue of sludge-bulking.6Traditional sludge volume index (SVI) and morphological recognition7,8 have been used with fluorescence in situ hybridization (FISH) to identify M. parvicella,9,10 but this has many disadvantages, including complex pretreatment, low cell permeability, destructiveness, weak fluorescence signal, long turnaround times, complicated processing, narrow application scope, and high expense. We recently reported some fluorescent probes with long-chain alkanes for labeling M. parvicella in sludge samples.11–13
Nielsen14 reported that the lipases on M. parvicella can catalyze the hydrolyzation of oils and lipid compounds into long-chain fatty acids (LCFAs) and transport them into cells as normal lipids. That is, M. parvicella has affinity for LCFAs via lipases. Oleic acid and hexadecanoic acid are of two typical LCFAs.1,15
Carbazole derivatives are highly conjugated and rigid structures which are easily functionalized and have excellent biological activity. They serve as a functional framework for the fabrication of medicines, materials, and probes. Carbazole derivatives in particular are excellent electron-donating chromophores for creating fluorescent probes with large Stokes shifts, excellent stability, and high quantum yields.16–18
Here, we created and characterized a carbazole fluorescent probe (FP1, Fig. 1) modified by LCFAs (hexadecanoic acid). Ultraviolet-visible (UV-vis) absorption and fluorescence spectroscopy studies characterized the photostability and thermostability. M. parvicella from activated sludge was labeled in situ without broken or lysozyme pretreatment. Two other probes FP2 (ref. 13) and FP3 (ref. 19) were also used to study the impact of side-chain length on the labeling efficiency, identification, and metabolism of M. parvicella (Fig. 1).
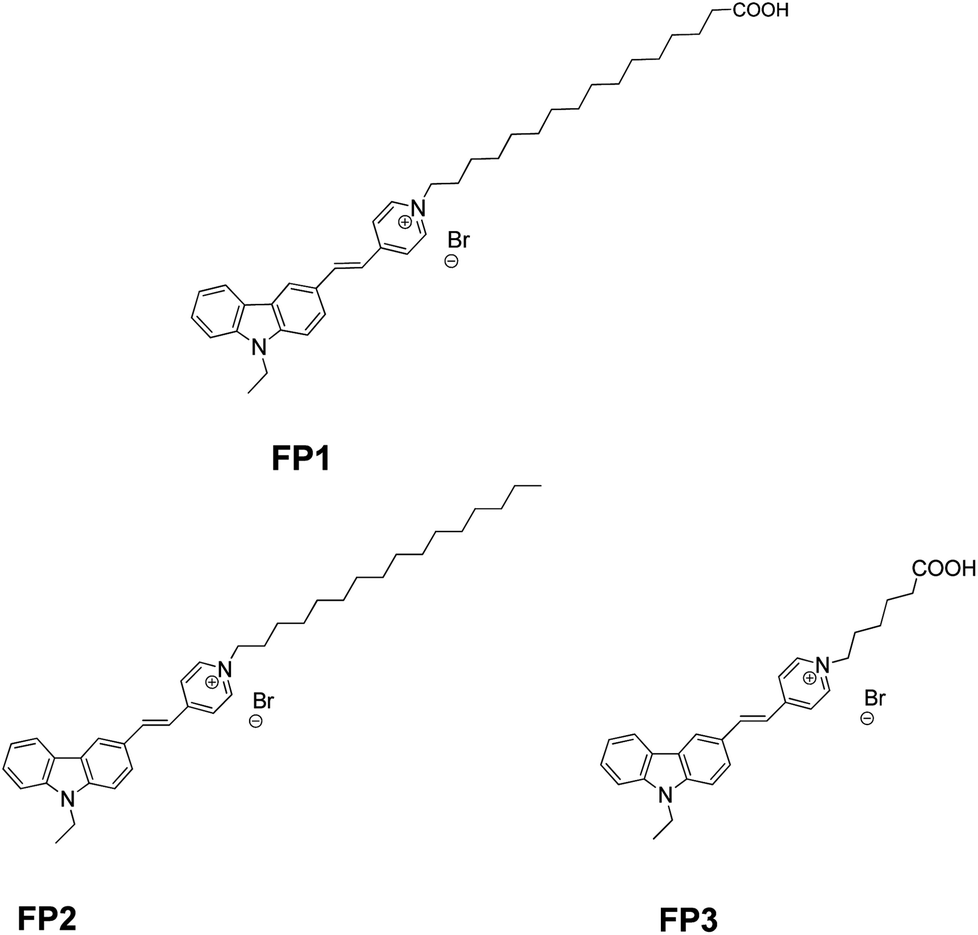 | ||
| Fig. 1 Structure of FP1, FP2 and FP3. | ||
2. Experimental procedure
2.1 Chemicals and equipment
All reagents and solvents were from commercial sources and were used without further purification. 16-Hydroxyhexadecanoic acid (≥98%) and 9-ethyl-9H-carbazole-3-carbaldehyde (≥98%) were from Macklin. The FISH reagents were from Takara. Other commonly used reagents were purchased locally.The 1H-NMR spectra were obtained in CDCl3 using a Bruker AVANCE III 400 MHz spectrometer. The HPLC was used to analyze the chemical purity on a Lab alliance PC4006A (USA). The mobile phase was a solution of 95% CH3OH and 5% H2O using a reversed-phase column C18 ODS (4.6 mm × 250 mm, 5 μm). Mass analysis was obtained on an electrospray ionization (ESI) mass spectrometer. UV-vis and fluorescence spectra were carried out on a Perkin Elmer LAMBDA 35 UV-vis spectrometer and HITACHIF-7000 fluorescence spectrophotometer, respectively. (The excitation and emission slits were both at 5 nm; PTM voltage at 400 V.) Activated sludge sample and labeling images were collected with a fluorescence inverted microscope from OLYMPUS-IX71 (10× objective).
2.2 General procedure
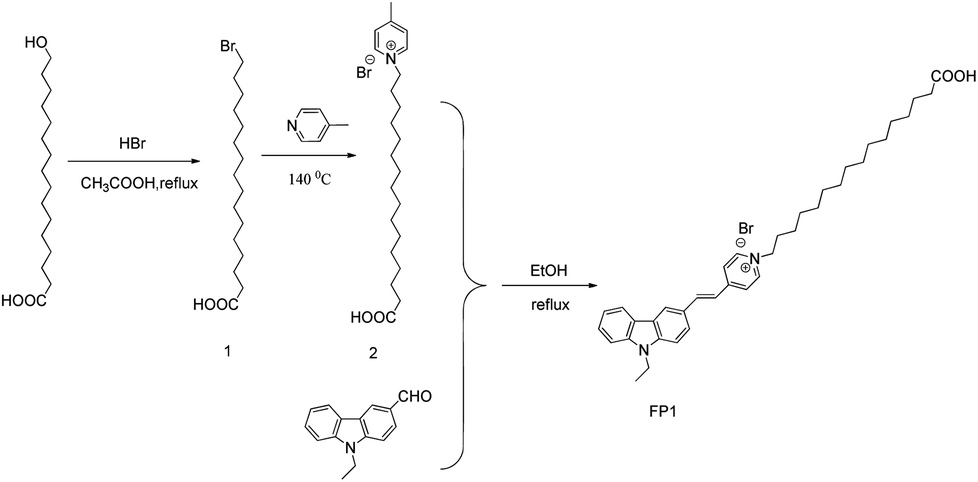 | ||
| Scheme 1 Synthesis of FP1. | ||
1-(15-Carboxypentadecyl)-4-methylpyridin-1-ium bromide (0.477 g, 1.0 mmoL), 9-ethyl-9H-carbazole-3-carbaldehyde (0.245 g, 1.1 mmoL), ethanol (10.0 mL) and piperidine (0.1 mL) were mixed together and refluxed for 8 h. The mixture was concentrated and eluted over silica gel to give the product (FP1). (0.379 g, 60%). Purity: 98.8% (HPLC). Mp 92–93 °C. 1H NMR (400 MHz, DMSO-d6) δ: 1.23–1.28 (m, 18H, CH2), 1.33–1.39 (m, 7H, J = 6.80 Hz, CH2), 1.42–1.47 (m, 2H, CH2), 1.86–1.92 (m, 2H, CH2), 2.16–1.18 (m, 2H, CH2), 4.46–4.51 (m, 4H, CH2), 7.28–7.31 (t, J = 7.4 Hz, 1H, Ar), 7.54–7.57 (m, 2H), 7.69 (d, 1H, J = 8.4 Hz, Ar), 7.75 (d, 1H, J = 8.8 Hz, Ar), 7.91 (d, J = 8.8 Hz, 1H, Ar), 8.20–8.26 (m, 4H, Ar), 8.60 (s, 1H, Ar), 8.91 (d, 2H, J = 6.80 Hz, Ar), 11.97 (br, 1H, COOH). HRMS (ESI-TOF) m/z: calcd for 553.3789 [M − Br]+; found: 553.3799 [M − Br]+.
 | (1) |
3. Results and discussion
3.1 The spectral properties of FP1 in different solvents
Fluorescent compounds often show different spectra in different solvents. Fig. 2 shows the spectral results of FP1, and Table 1 shows the spectral data.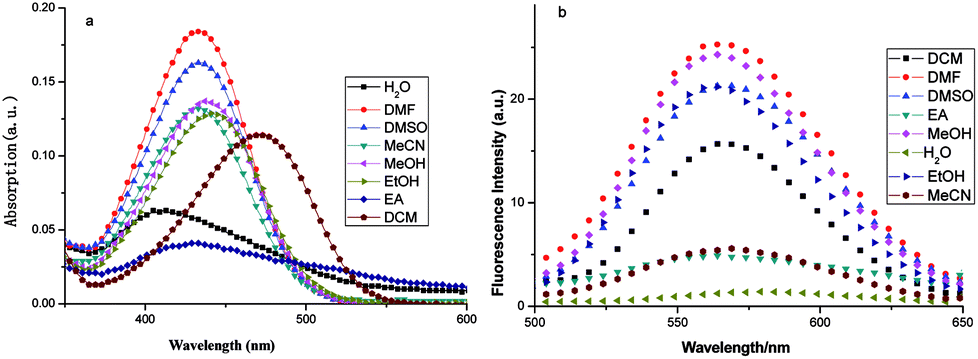 | ||
| Fig. 2 The (a) UV-vis spectra and (b) fluorescent spectra of FP1 in different solvents (6 μmol L−1) (λex = 450 nm). | ||
| Solvent | H2O | DMF | DMSO | CH3CN | MeOH | EtOH | DCM |
|---|---|---|---|---|---|---|---|
| a Refractive index.b Dipole moment.c Dielectric constant.d Fluorescence quantum yield. | |||||||
| nD20a | 1.333 | 1.431 | 1.478 | 1.344 | 1.328 | 1.361 | 1.424 |
| μb | 1.85 | 3.82 | 3.96 | 3.92 | 1.7 | 1.69 | 0.51 |
| εc | 80.0 | 36.7 | 48.9 | 37.5 | 33.0 | 24.3 | 8.9 |
| λmax/nm | 405 | 432 | 433 | 434 | 437 | 442 | 469 |
| λem/nm | 572 | 566 | 566 | 567 | 565 | 564 | 570 |
| Stokes shift | 167 | 134 | 133 | 133 | 128 | 122 | 101 |
| Φd/10−3 | 0.834 | 8.70 | 13.85 | 6.44 | 6.59 | 6.28 | 74.45 |
Fig. 2a shows that the absorption wavelength (λabs) of FP1 in all solvents were located at about 450 nm and shifted blue with increasing dipole moment and solvent polarity. This showed a negative solvent effect. The dipole moment of the ground state is larger than that of the excited state. When intramolecular charge transfer (ITC) occurs, the ground state changed to an excited state with a lower dipole moment. Solvents with a larger polarity can decrease the energy of the ground state and increase that of the excited state. This increases the energy difference between them and results in an absorption blue shift.
The fluorescence spectra were recorded with a λex of 450 nm and a λem of 570 nm in all solvents (Fig. 2b). The Stokes shift and Φ increased with increasing solvent polarity except water. This might be because of FP1 aggregation in water increased the nonradiative decay process and caused quenching.
3.2 The spectral properties of FP1 at different pHs
The pH is an important factor that affects the spectra of fluorescent compounds. Here, FP1(6 μmol L−1) in 10 mmol L−1 of Na2HPO4–citric acid buffer with pH of 2.2 to 8.0 were prepared, and the spectra were measured with a UV-vis and fluorescence spectrophotometer, respectively (Fig. 3).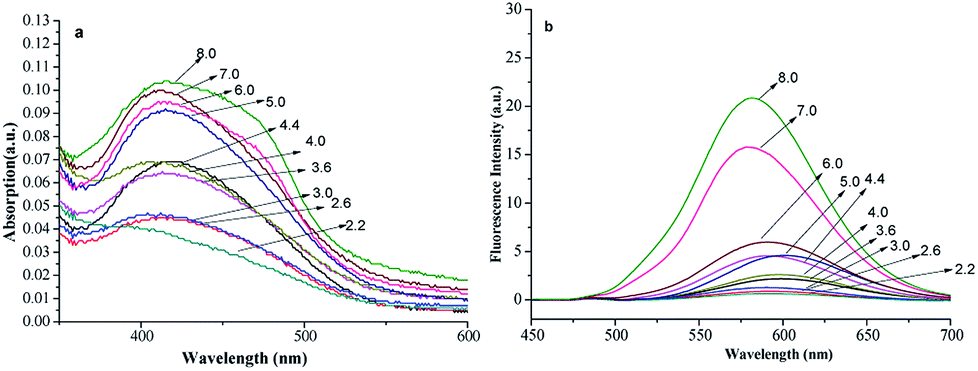 | ||
| Fig. 3 The (a) UV-vis spectra and (b) fluorescence spectra of FP1 at different pH values. | ||
It shows slight changes in λmax, λem and the spectra shapes with pH. The absorption and fluorescent intensities changed little as pH increased from 2.2 to 6.0. The chemical structure dissolved badly and was stable across this regime, which is typical in medical, bioorganic and environment fields. However, when the pH increased to 7–8, the fluorescent intensities increased, which may be because the carboxy group dissociate into the anion form (carboxylate) in alkaline conditions, and then the dissolvability of dye improved at this condition.
3.3 Photostability
The photostability of fluorescent probes plays a big role in their quality and applications as fluorescent labels.26 Excellent photostability is required, but organic probes can be easily decomposed under illumination resulting in instability or error when labeling. The absorption intensities of FP1 were measured after exposure to illumination with different times. The curve between the intensity and time was shown in Fig. 4. There is no apparent change after exposure, even after irradiation for 8 h, there was only 3.3% signal loss indicating excellent stability—this makes it a promising probe for applications in medicine, biology, chemistry, environmental studies and other fields.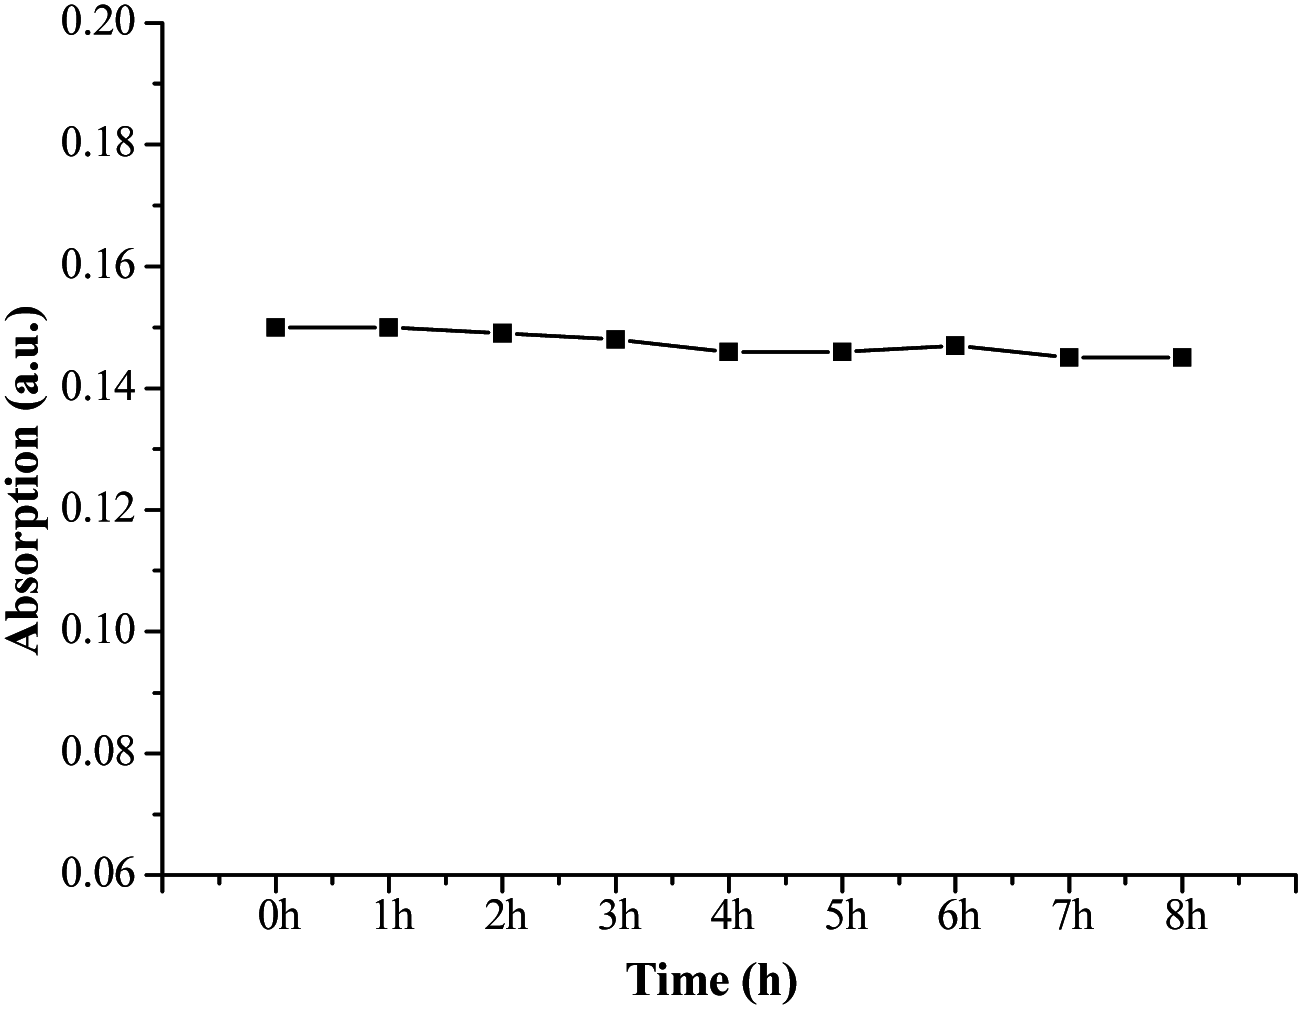 | ||
| Fig. 4 The photostability curve of FP1 (light source intensity: 7000 lm, wavelength: 400–2500 nm). | ||
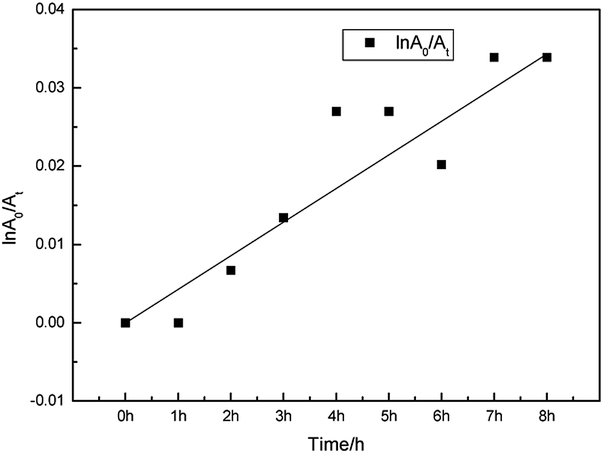
To measure the photostability, the rate of photooxidation was described and referred to as the photooxidation mechanism:27
| d[Dye]/dt = K1[Dye][O2]. | (2) |
Here, [O2] is a constant of 3 × 10⁻⁴ mol L−1, so the above equation can be changed to
| −d[Dye]0/dt = K[Dye] | (3) |
| ln[Dye]0/[Dye]t = Kt. | (4) |
[Dye]0 and [Dye]t are the original concentration of dye and that being illuminated for t hours, respectively. The Lambert–Beer law states that there is a linear relationship between the concentration of the dye and the maximum absorbance at low concentrations. Thus, eqn (4) can be written as
| ln(A0/At) = kt. | (5) |
In the equation, A0 and At are the maximum absorbances of the dye and that after illumination, respectively. While k is the photooxidation rate constant obtained from the slope (Fig. 5). In this paper, the photooxidation rate constant of FP1 is 7.062 × 10⁻⁵ mol min−1, which is the same order of magnitude with some other carbazole dyes26 and much smaller than some cyanines reported.19,28,29 The lower photoreduction rate constant might be attributed to a stable trans structure.30
 | ||
| Fig. 5 The lightfastness of FP1. | ||
3.4 Thermostability
Thermostability is another important property of dyes. The absorbance of FP1 (6 μmol L−1 in DMSO) was measured after storing it at 80 °C in a water bath for different times (Fig. 6).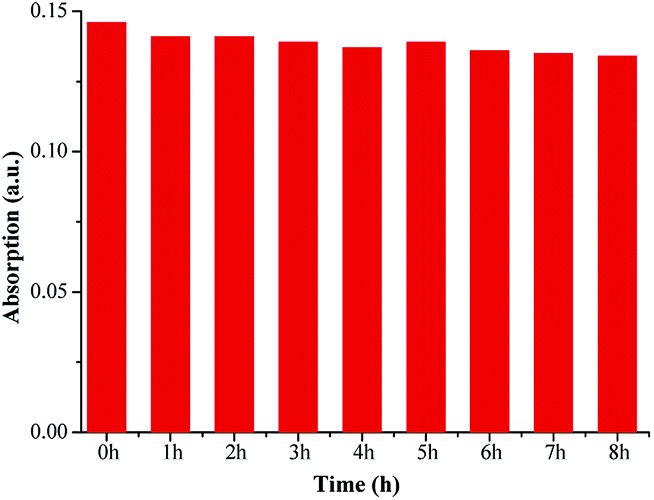 | ||
| Fig. 6 The thermostability of FP1. | ||
The results showed that the absorption intensity reduced only 8.2% even after heating for 8 h at 80 °C. This suggests that the dye has excellent thermostability.
3.5 Analysis of activated sludge samples
The distinct morphotype of filamentous bacteria species and M. parvicella in activated sludge were studied with Gram staining and FISH probes (Fig. 7). Fig. 7a shows filamentous bacteria identified by Gram-positive staining. They have unbranched long and curly filaments with diameters that are approximately of 0.7–0.9 μm and a length of 200–400 μm. This agrees with the distinct morphotype of M. parvicella.31,32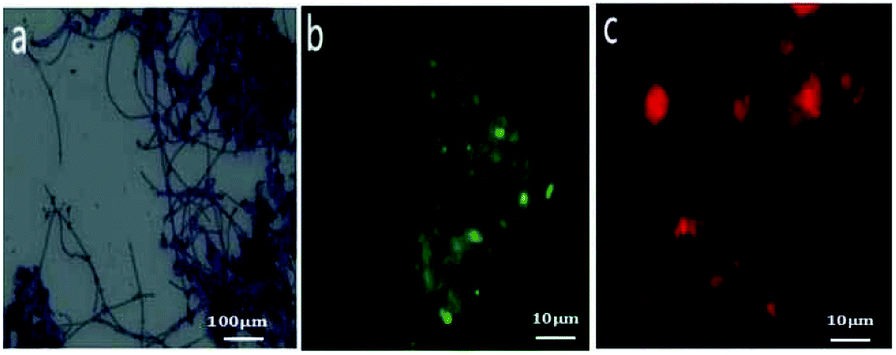 | ||
| Fig. 7 Images of sludge samples with Gram staining ((a) ×400) and FISH staining ((b and c) 10 × 100). | ||
FISH analysis could identify and classify filamentous bacteria and provide more detailed information.33 The total bacteria were detected by recommended fluorescent probe EUBmix probe mixed by 1![[thin space (1/6-em)]](https://www.rsc.org/images/entities/char_2009.gif) :1:1 of EUB338 (Cy3-GCTGCCTCCCGTAGGAGT, targeting for most bacteria), EUB338-II (Cy3-GCAGCCACCCGTAGGTGT, targeting for Planctomycetales), and EUB338-III (cy3-GCTGCCACCCGTAGGTGT, targeting for Verruco microbiales). M. parvicella were targeted by fluorescent probes MPAmix mixed by 1:1:1 of MPA223 (Cy3-GCCGCGAGACCCTCCTAG, targeting or most M. parvicella), MPA60 (Cy3-GGATGGCCGCGTTCGACT, targeting for most M. parvicella), and MPA645 (Cy3-CCGGACTCTAGTCAGAGC, targeting for most M. parvicella).7,34,35
:1:1 of EUB338 (Cy3-GCTGCCTCCCGTAGGAGT, targeting for most bacteria), EUB338-II (Cy3-GCAGCCACCCGTAGGTGT, targeting for Planctomycetales), and EUB338-III (cy3-GCTGCCACCCGTAGGTGT, targeting for Verruco microbiales). M. parvicella were targeted by fluorescent probes MPAmix mixed by 1:1:1 of MPA223 (Cy3-GCCGCGAGACCCTCCTAG, targeting or most M. parvicella), MPA60 (Cy3-GGATGGCCGCGTTCGACT, targeting for most M. parvicella), and MPA645 (Cy3-CCGGACTCTAGTCAGAGC, targeting for most M. parvicella).7,34,35
The FISH results showed that the fragmented images with green fluorescence (EUBmix, Fig. 7b) were the entire bacteria and red fluorescence (MPAmix, Fig. 7c) were M. parvicella. Both results of distinct morphotype and oligonucleotide probes confirmed M. parvicella in the activated sludge samples.
3.6 Labeling of M. parvicella by novel probes
Here, 10 μmol L−1 of FP1, FP2, and FP3 were used to label M. parvicella at different times respectively, and the images were quantitated with Image Pro Plus 6.0 after different treatment times (Fig. 8). The mean fluorescent intensities of M. parvicella as a function of time were shown in Fig. 9.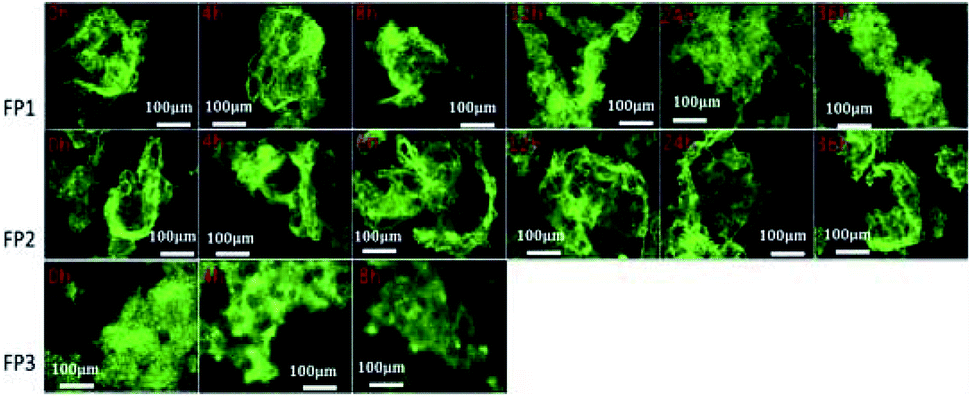 | ||
| Fig. 8 Images of activated sludge samples labeled by FP1, FP2, and FP3 (10 μmol L−1) at different duration times (10 × 40). | ||
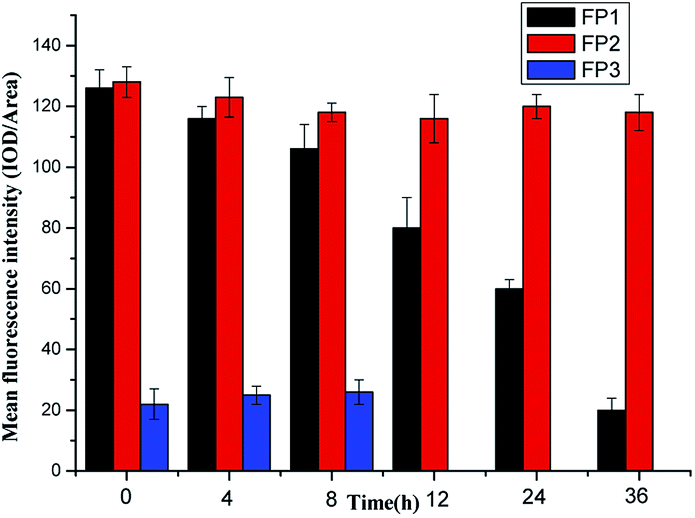 | ||
| Fig. 9 The mean fluorescent intensities of M. parvicella as a function of time. | ||
FP1 and FP2 can both distinguish between M. parvicella and zooglea to label M. parvicella, but FP3 could not. M. parvicella had bright green fluorescence with a distinct morphotype when FP1 and FP2 were added to the activated sludge samples. At longer times the mean fluorescence intensities of both M. parvicella and zooglea labeled by FP1 were gradually diminished. After 8 h, M. parvicella could not be clearly distinguished from the zooglea. The signal became especially dim after 12 h in both M. parvicella and zooglea. Metabolism in FP1-labeled M. parvicella (hydrolases) might underlie this signal change.
When FP2 was used to label, M. parvicella quickly had a bright green fluorescence and a distinct morphotype. The mean fluorescence intensities of both M. parvicella and zooglea labeled by FP2 were still strong even at 36 h, and M. parvicella could still be clearly distinguished from zooglea. The FP2 on M. parvicella remained stable without any digestion of the dye. The FP3 samples show that the zooglea had bright fluorescence, but M. parvicella could not be seen clearly. This suggests that M. parvicella could not be labeled or distinguished from zooglea.
FP1, FP2, and FP3 have the same parent structure (carbazole-stilbazolium salts), while they had different labeling properties on M. parvicella because of their different side chain polarities. When labeled by FP1, the extracellular lipase on the cell surface of M. parvicella might be absorbed by the hydrophobic LCFA. This would then be slowly ingested by endocytosis resulting in a reduced concentration of FP1 and a decrease or even disappearance of fluorescence. When labeled by FP2, the lipase on the cell surface of M. parvicella adsorbed the hydrophobic long-chain alkanes but there was no endocytosis or metabolism—this stabilized the probe, fluorescence, and labeling. FP3 had no hydrophobic long-chain groups and this resulted in weak affinity to M. parvicella and thus poor labeling.
These results agree with the affinity of hydrophobic long-chain fatty acids to M. parvicella. These offer the theoretical basis for further studies on M. parvicella and bulking or foaming in activated sludge.
3.7 The relationship between mean fluorescent intensity and SVI
The sludge volume index (SVI) is a metric of active sludge settling in wastewater treatment. A SVI of 50–120 suggests that the active sludge is suitable for processing. Lower values imply low sludge activity, and higher values imply sludge bulking. When the sludge of filamentous bacteria bulks, loose sludge structures have increased to increase volumes, leading to floating, and the difficult separation of solids and liquids leads to sludge flocs in the effluent water, which affects effluent quality. Early warning and control measures could assure that the wastewater treatment process would operate normally. We established an abundance model targeting M. parvicella in activated sludge system.Sludge samples with different SVI values were labeled with 10 μmol L−1 of FP1 (Fig. 10). The mean fluorescence intensities (IOD/Area) of each image were calculated and more than 10 images were averaged. An early-warning model of targeting M. parvicella in activated sludge system was established based on the relationship between the mean fluorescence intensity and SVI (Fig. 11).
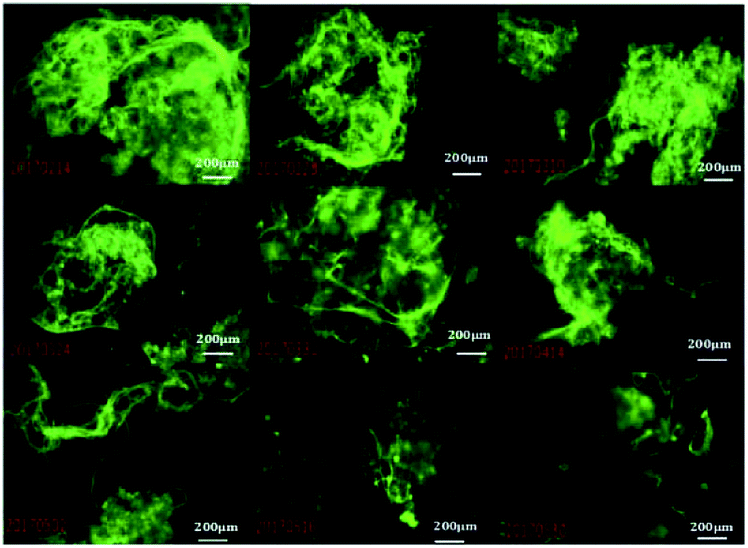 | ||
| Fig. 10 Image of M. parvicella labeled by FP1 under different SVI values (10 × 40). | ||
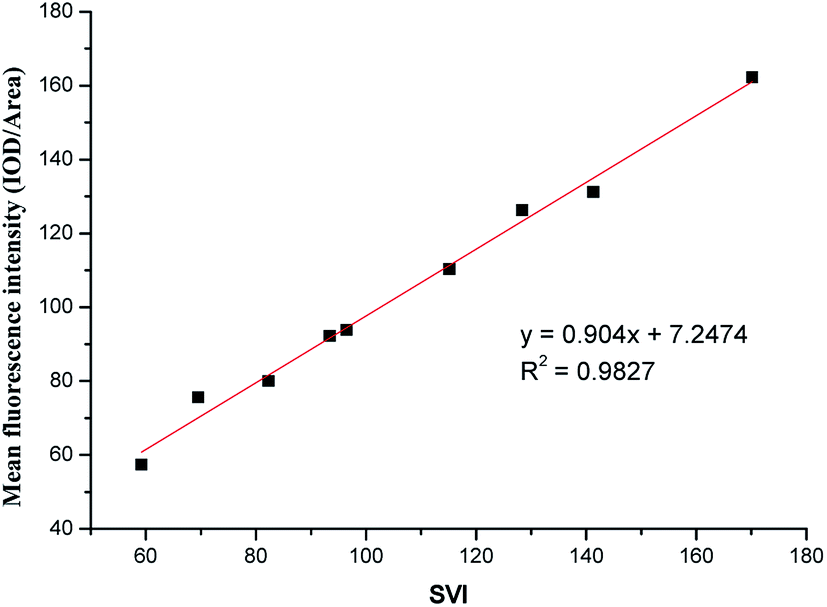 | ||
| Fig. 11 Relationship between the fluorescence intensity of M. parvicella labeled by FP1 and SVI. | ||
As SVI increases, the abundance of M. parvicella labeled by FP1 increased, and the fluorescence intensities and the mean fluorescence intensities also enhanced with linear positive correlation (y = 0.904x+7.2474, R2 = 0.9827). Thus, the mean fluorescence intensities reflect the abundance of M. parvicella when labeled.
The SVI value of normal activated sludge is 50–150, and it is considered to be bulked when over 200. Traditional SVI methods or Gram staining can only judge sludge bulking when the SVI is over 150 with M. parvicella proliferation and sticking out of zooglea. When the SVI is lower than 60, Gram staining could not label M. parvicella but the fluorescent probe could. The correlation between SVI and the mean fluorescence intensity shows that the probe can label M. parvicella even when there is only a trace of M. parvicella. This makes the early diagnosis of M. parvicella easy and offers a shorter warning period.
3.8 Interaction mechanism calculation
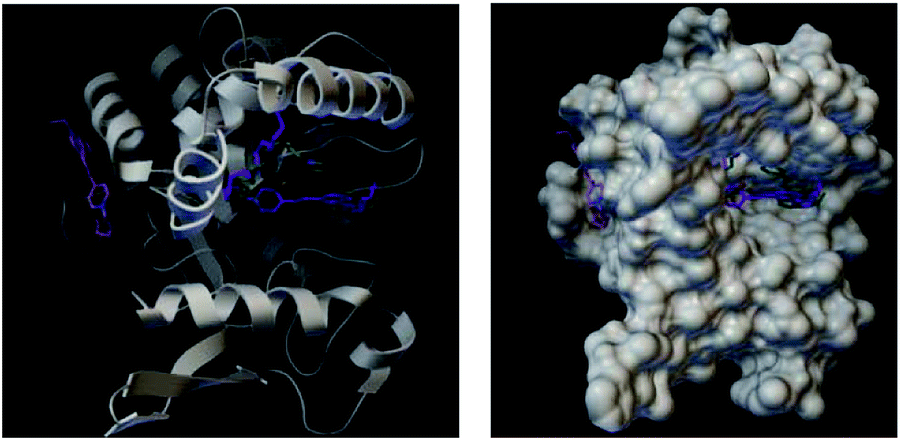
To further understand the different labeling results between the three probes, we calculated the interactions between these three probes and lipase via computational simulation. The structures of the three probes were first optimized by the density functional tight-binding (DFTB) method,36–41 and the frontier orbitals including the highest occupied molecular orbital (HOMO) and the lowest unoccupied molecular orbital (LUMO) were further calculated. A molecular docking study between the probes and lipase used Autodock program.42 The crystal structure of the extracellular lipase is unknown, so the crystal structure of triacylglycerol lipase (PDB ID: 1OIL)43 of Pseudomonas cepacia was docked in this study. In the molecular docking simulation, a rapid grid-based energy evaluation and torsional degree of freedom search method was used. The grid size was 126 × 126 × 126, and the grid spacing was 0.375 Å. The docking was done by the Lamarckian genetic algorithm with 1000 conformations.As shown in Fig. 12a and b, the active group was localized at the ring of carbazole and pyridine. This plays an important role when it interacts with other molecules. When docked with lipase, the carbazole ring was outside the lipase pocket. Meanwhile, the long-chain was folded and the tail carboxyl group was inset into the pocket because of the large size of the pocket. The binding energy between FP1 and the lipase was −8.35 kcal mol−1. Fig. 12e and f show that the largest binding energy distribution was about 25 modes with a binding energy of about −8.3 kcal mol−1 among the 1000 conformations.
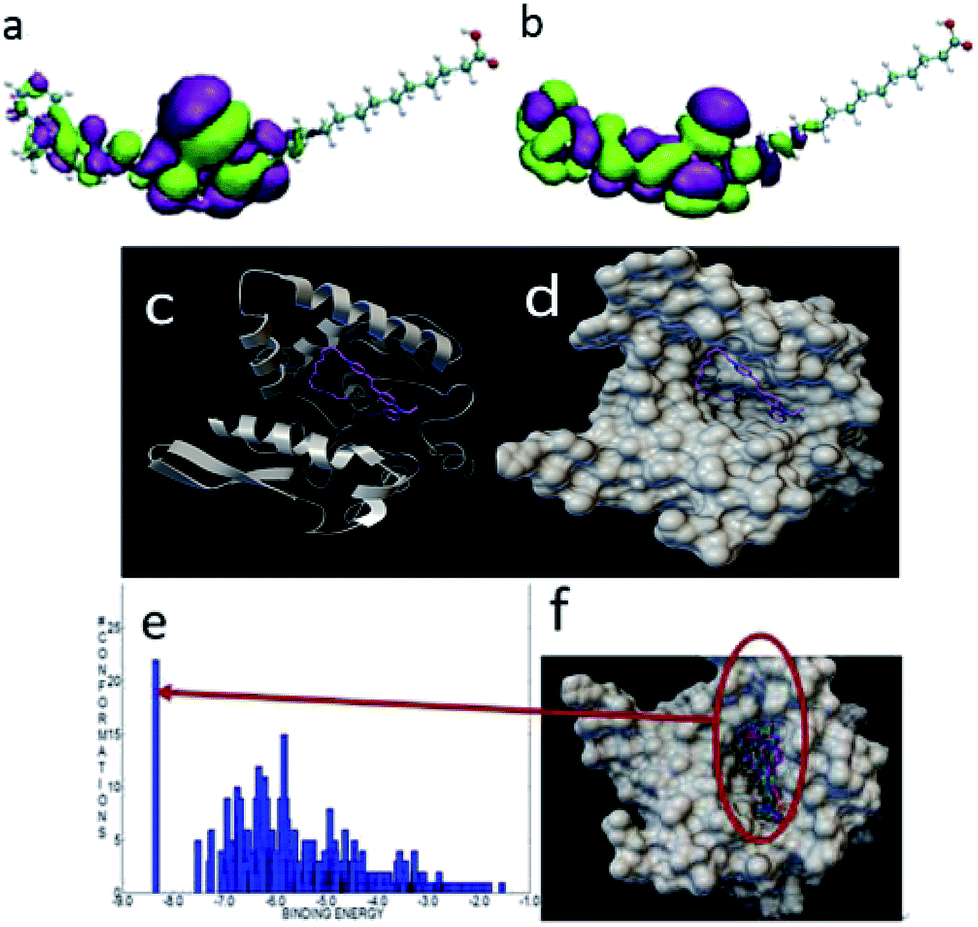 | ||
| Fig. 12 The HOMO (a) and LUMO (b) of FP1. The most stable docking mode of FP1 and lipase (c) and (d) the binding energy distribution (e), and binding modes (f) of FP1 and lipase. | ||
The HOMO and LUMO of FP2 were similar to those of FP1, and the active groups were localized at the ring of carbazole and pyridine. The most stable binding energy was −8.8 kcal mol−1 when docked with the lipase (Fig. 13). The binding mode was different from that of FP1. The structure of FP2 was inset into the pocket, and all functional groups of FP2 interacted with the lipase residues. This might explain the largest bonding strength. Of the 1000 docked conformations, there were about 7 conformations that had the strongest binding energy of about −8.8 kcal mol−1, and there were about 70 conformations with a binding energy of about −8.6 kcal mol−1. This means that the docked structural distribution is very dense.
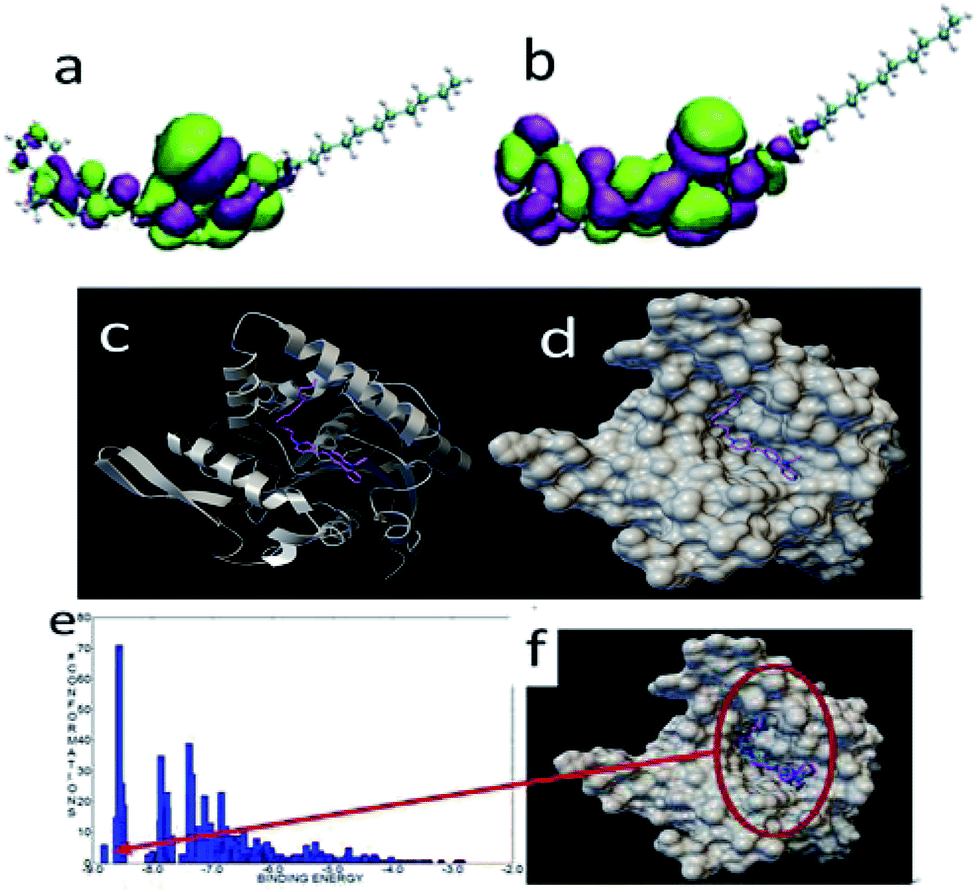 | ||
| Fig. 13 The HOMO (a) and LUMO (b) of FP2. The most stable configuration of FP2 and lipase (c) and (d), and the binding energy distribution (e), and docked binding modes (f) of FP2 and lipase. | ||
The HOMO and LUMO orbitals were localized throughout the molecule including the side chain of FP3 (Fig. 14)—these were different from those of FP1 and FP2.
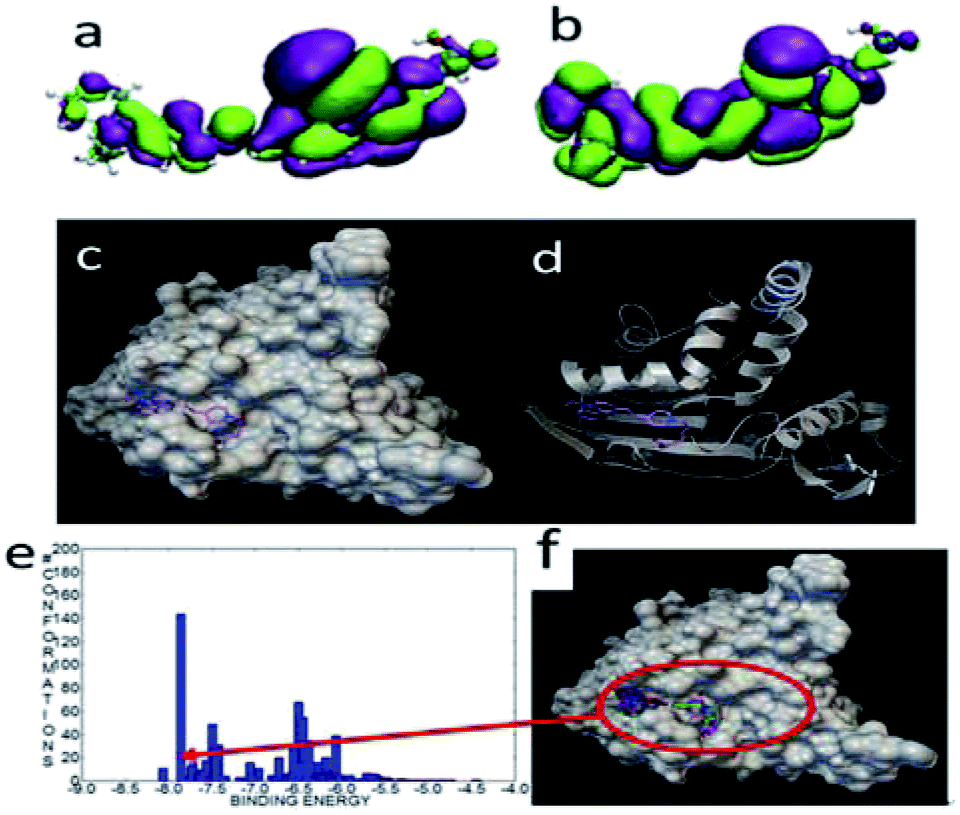 | ||
| Fig. 14 The HOMO (a) and LUMO (b) of FP3. The most stable configuration of FP3 and lipase (c) and (d), the binding energy distribution (e), and binding modes (f) of FP3 and lipase. | ||
When docked with lipase, the binding energy was about −8.07 kcal mol−1. The docked mode was very different from FP1 and FP2, and the carbazole and long chain were localized at two small cavities. Of the 1000 docked conformations, there were about 10 conformations that had the strongest binding energy of about −8.0 kcal mol−1. There were about 140 conformations with a binding energy of about −7.6 kcal mol−1. This indicated that the docking structural distribution is very dense as well.
The docked binding mode of FP3 was quite different from those of FP1 and FP2. FP1 and PF2 were located at the large concave cavity of lipase while FP3 was located at the side cavity of lipase (Fig. 15).
 | ||
| Fig. 15 Docked binding modes of FP1, FP2 and FP3 with fatty hydrolase (the green model represents FP1, purple is FP2, and pink is FP3). | ||
The binding strength order for the three probes and lipase was FP2 > FP1 > FP3, while the dipole moment order (Table 2) of the probes were FP2 < FP1 < FP3. This indicated that the binding strength increased as the dipole moment decreased. The theoretical results were consistent with the experimental results: FP2 has the strongest interaction strength with lipase, which was adsorbed on the surface of M. parvicella. The fluorescence intensity remained constant over time. FP1 has a weaker interaction with lipase than with FP2, but the long chain fatty acid can metabolize the lipase of M. parvicella.
| X | Y | Z | Total | |
|---|---|---|---|---|
| FP1 | −13.46 | −4.15 | 5.76 | 15.22 |
| FP2 | −10.33 | −6.18 | 2.80 | 12.36 |
| FP3 | −11.72 | −11.75 | 1.06 | 16.63 |
4. Conclusions
The novel fluorescent probe FP1 was designed and synthesized. The spectra in different solvents and pH values were studied. The stability results showed that it has excellent thermostability and photostability. Labeling of M. parvicella was best with FP2. The theoretical calculation results showed that the binding energy of FP2 with lipases was the strongest, and this results in stable fluorescence, even for 36 h. The FP1 signal decreased via lipase metabolism on the surface of M. parvicella. This corresponds to the affinity of LCFAs for M. parvicella.Conflicts of interest
The authors declare that there are no conflicts to declare.Acknowledgements
The present study was financially supported by the National Natural Science Foundation of China (grant no. 21502137, 51578360, 51778398, 11604238), Key Laboratory of Targeting Therapy and Diagnosis for Critical Diseases, Henan Province (grant no. NMZL2018101) and Beijing National Laboratory for Molecular Sciences (BNLMS201831)Notes and references
- T. Dunkel, E. L. D. L. Gallegos, C. D. Schönsee, T. Hesse, J. Jochmann, J. Wingender and M. Denecke, Water Res., 2016, 88, 510–523 CrossRef CAS PubMed.
- L. Vanysacker, C. Denis, J. Roels, K. Verhaeghe and I. F. Vankelecom, J. Microbiol. Methods, 2014, 97, 6–14 CrossRef CAS PubMed.
- D. Mamais, G. Nikitopoulos, E. Andronikou, E. Gavalakis, A. Andreadakis, C. Giotakis and G. Tsimarakis, Global NEST J., 2006, 8, 82–88 Search PubMed.
- J. Wang, R. Qi, M. Liu, Q. Li, H. Bao, Y. Li, S. Wang, V. Tandoi and M. Yang, Water Sci. Technol., 2014, 70, 367–375 CrossRef CAS PubMed.
- D. S. L. Araújo, V. Ferreira, M. M. Neto, M. A. Pereira, M. Mota and A. Nicolau, Appl. Microbiol. Biotechnol., 2015, 99, 1–10 CrossRef PubMed.
- L. Speirs, T. Nittami, S. Mcilroy, S. Schroeder and R. J. Seviour, Appl. Environ. Microbiol., 2009, 75, 2446–2452 CrossRef CAS PubMed.
- D. H. Eikelboom and H. J. J. Van Buijsen, Microscopic sludge investigation manual, TNO Research Institute of Environmental Hygiene, Delft. 1983 Search PubMed.
- D. S. Wágner, E. Ramin, P. Szabo, A. Dechesne and B. G. Plósz, Water Res., 2015, 78, 121–132 CrossRef PubMed.
- F. D. L. Reyes, D. Rothauszky and L. Raskin, Water Environ. Res., 2002, 74, 437–449 CrossRef PubMed.
- J. C. Costa, D. P. Mesquita, A. L. Amaral, M. M. Alves and E. C. Ferreira, Environ. Sci. Pollut. Control Ser., 2013, 20, 5887–5912 CrossRef CAS PubMed.
- X. Fei, W. Sun, L. Cao, X. Jiao, D. Lin and G. Jia, Appl. Microbiol. Biotechnol., 2016, 100, 961–968 CrossRef CAS PubMed.
- S. Li, X. Fei, X. Jiao, D. Lin, B. Zhang and L. Cao, Appl. Microbiol. Biotechnol., 2015, 100, 2883–2894 CrossRef PubMed.
- X. Jiao, X. Fei, S. Li, D. Lin, H. Ma and B. Zhang, Materials, 2017, 10, 804 CrossRef PubMed.
- P. H. Nielsen, P. Roslev, T. E. Dueholm and J. L. Nielsen, Water Sci. Technol., 2002, 46, 73–80 CrossRef CAS PubMed.
- M. Hesselsoe, J. L. Nielsen, P. Roslev and P. H. Nielsen, Appl. Environ. Microbiol., 2005, 71, 646–655 CrossRef CAS PubMed.
- A. Casey, R. S. Ashraf, Z. Fei and M. Heeney, Macromolecules, 2014, 47, 2279–2288 CrossRef CAS.
- Y. Gu, D. Lin, Y. Tang, X. Fei, C. Wang, B. Zhang and J. Zhou, Spectrochim. Acta, Part A, 2018, 191, 180–188 CrossRef CAS PubMed.
- D. Lin, X. Fei, Y. Gu, C. Wang, Y. Tang, R. Li and J. Zhou, Analyst, 2015, 140, 5772–5780 RSC.
- Y. Gu, D. Lin, R. Li, Y. Tang, X. Fei and J. Zhou, Luminescence, 2016, 31, 380–387 CrossRef CAS PubMed.
- T. Griesser, J. Adams, J. Wappel, W. Kern, G. J. Leggett and G. Trimmel, Langmuir, 2008, 24, 12420–12425 CrossRef CAS PubMed.
- S. T. Yue, T. H. Steinberg, W. F. Patton, C. Y. Cheung and R. P. Haugland, Carbazolylvinyl dye protein stains, US Pat. US06579718, 2003.
- Y. Gu, D. Lin, X. Fei, C. Wang, L. Li, Y. Tang and J. Zhou, Luminescence, 2016, 31, 1229–1236 CrossRef CAS PubMed.
- D. Magde, R. Wong and P. G. Seybold, Photochem. Photobiol., 2002, 75, 327–334 CrossRef CAS PubMed.
- R. T. Myers, J. Phys. Chem., 1980, 84, 1871 CrossRef CAS.
- H. Daims, S. Lucker and M. Wagner, Environ. Microbiol., 2006, 8, 200–213 CrossRef CAS PubMed.
- X. Fei, R. Li, D. Lin, Y. Gu and L. Yu, J. Fluoresc., 2015, 25, 1251–1258 CrossRef CAS PubMed.
- X. Chen, X. Peng, A. Cui, B. Wang, L. Wang and R. Zhang, J. Photochem. Photobiol., A, 2006, 181, 79–85 CrossRef CAS.
- Y. Gu, X. Fei, Y. Liu, Y. Wang and X. Yang, J. Lumin., 2013, 134, 184–190 CrossRef CAS.
- V. E. Shershov, M. A. Spitsyn, V. E. Kuznetsova, E. N. Timofeev, O. A. Ivashkina, I. S. Abramov, T. V. Nasedkina, A. S. Zasedatelev and A. V. Chudinov, Dyes Pigm., 2013, 97, 353–360 CrossRef CAS.
- Q. Kang, F. Fan, W. Bi, Y. Huang, Y. Fu and L. Wang, Chin. J. Org. Chem., 2012, 32, 567–573 CrossRef CAS.
- S. Rossetti, C. Christensson, L. L. Blackall and V. Tandoi, J. Appl. Microbiol., 1997, 82, 405–410 CrossRef CAS PubMed.
- F. Yan, R. Zhang, Y. Huang, D. Kong, Q. Ye, J. Xu and L. Chen, RSC Adv., 2016, 6, 50732–50760 RSC.
- J. Guo, Y. Peng, S. Wang, X. Yang and Z. Yuan, Chem. Eng. J., 2014, 255, 453–461 CrossRef CAS.
- J. Pernthaler, F. O. Glöckner, W. Schönhuber and R. Amann, Methods Microbiol., 2001, 30, 207–210 CAS.
- D. Jenkins, M. G. Richard and G. T. Daigger, Manual On the Causes and Control of Activated Sludge Bulking, Foaming And Other Solids Separation Problems, Crc Press Inc. 2003 Search PubMed.
- G. Seifert, D. Porezag and T. Frauenheim, Int. J. Quantum Chem., 1996, 58, 185–192 CrossRef CAS.
- M. Elstner, D. Porezag, G. Jungnickel, J. Elsner, M. Haugk, T. Frauenheim, S. Suhai and G. Seifert, Phys. Rev. B: Condens. Matter Mater. Phys., 1998, 58, 7260–7268 CrossRef CAS.
- M. Elstner, P. Hobza, T. Frauenheim, S. Suhai and E. Kaxiras, J. Chem. Phys., 2001, 114, 5149–5155 CrossRef CAS.
- M. Elstner, T. Frauenheim and S. Suhai, J. Mol. Struct.: THEOCHEM, 2003, 632, 29–41 CrossRef CAS.
- M. Gaus, Q. Cui and M. Elstner, J. Chem. Theory Comput., 2011, 7, 931–948 CrossRef CAS PubMed.
- M. Gaus, A. Goez and M. Elstner, J. Chem. Theory Comput., 2013, 9, 338–354 CrossRef CAS PubMed.
- G. M. Morris, H. Ruth, W. Lindstrom, M. F. Sanner, R. K. Belew, D. S. Goodsell and A. J. Olson, J. Comput. Chem., 2009, 30, 2785–2791 CrossRef CAS PubMed.
- K. K. Kim, H. K. Song, H. S. Dong, K. Y. Hwang and S. W. Suh, Structure, 1997, 5, 173–185 CrossRef CAS PubMed.
Footnote |
| † These authors contributed equally to this work and should be considered co-first authors. |
| This journal is © The Royal Society of Chemistry 2018 |