DOI:
10.1039/C8RA06983B
(Paper)
RSC Adv., 2018,
8, 35187-35194
Preparation, characterization, and luminescence properties of double perovskite SrLaMgSbO6:Mn4+ far-red emitting phosphors for indoor plant growth lighting
Received
21st August 2018
, Accepted 8th October 2018
First published on 15th October 2018
Abstract
Mn4+-activated SrLaMgSbO6 far-red emitting phosphors with double perovskite structure were prepared by traditional solid-state reaction. The research on the crystal structure of the SrLaMgSbO6:0.8%Mn4+ (SLMS:0.8%Mn4+) phosphors showed that the as-prepared sample was made up of two polyhedrons, [SbO6] and [MgO6]. Under the excitation of 333 nm, the SLMS:0.8%Mn4+ phosphors exhibited an intense far-red emission in the 625–800 nm wavelength range with CIE chromaticity coordinates of (0.733, 0.268), which could match well with the absorption spectrum of phytochrome PFR. The optimal concentration of Mn4+ ions in the SLMS:Mn4+ phosphors was 0.8 mol%. Importantly, the as-prepared SLMS:0.8%Mn4+ phosphors had an internal quantum efficiency of 35%. The thermal stability of SLMS:0.8%Mn4+ phosphors was also investigated, and the activation energy was found to be 0.3 eV. Thus, the Mn4+-activated SLMS phosphors have great potential to serve as far-red emitting phosphors in indoor plant growth lighting.
Introduction
Nowadays, an intense research effort has recently been devoted to developing red-emitting phosphors for phosphor-converted light-emitting diodes (pc-LEDs), due to the fact that pc-LEDs, which show many merits including high durability, low energy consumption, short response time, and environmental protection, can be used in indoor plant cultivation, decoration, and medical applications.1–9 For the indoor plant growth, the growth status can be controlled by adjusting the ratio of the phytochrome PR and PFR, because the PFR can convert to PR by absorbing far-red light centered at 730 nm.10,11 But in the agricultural industry, especially indoor plant cultivation, there is lack of far-red light to meet the requirement of mutual transformation between the phytochrome PFR and PR due to small percentage of far-red light in the sunlight compared to red light.10,12 Meanwhile, the traditional lamp cannot match well with the absorption spectrum of the phytochrome PFR. So pc-LEDs play an important role in indoor plant growth, and many research on the phosphors used in indoor plant growth lighting have been implemented such as Ca1−xYxAl12−xMgxO19:Mn4+,13 La(MgTi)1/2O3:Mn4+,10 Ca14Al10Zn6O35:Bi3+,Mn4+,14 SrMg2La2W2O12:Mn4+,15 and Ca3Al4ZnO10:Bi3+,Mn4+.16 Since the far-red emitting phosphors are vital to the pc-LEDs and relatively little research has been conducted on that kind of phosphors, thus it is meaningful to study the far-red emitting phosphors for applications in indoor plant cultivation.
It is known that Mn4+ ions with a 3d3 electronic configuration in a strong crystal fields of octahedral coordination (coordination number (CN) = 6) can give rise to red emission in the wavelength region of 620–800 nm owing to the spin-forbidden 2Eg → 4A2g transition.17–24 Mn4+-doped phosphors contain two categories: (1) Mn4+-activated fluorides, such as Li3Na3Ga2F12:Mn4+ (λem = 627 nm),25 Na3TaF8:Mn4+ (λem = 627 nm),26 and K3ScF6:Mn4+ (λem = 631 nm);27 and (2) Mn4+-activated oxides, such as Ca3La2W2O12:Mn4+ (λem = 711 nm),28 Li2MgZrO4:Mn4+ (λem = 670 nm),29 and Ba2GdSbO6:Mn4+ (λem = 687 nm).30 Mn4+-activated fluorides generally exhibit red emissions in the 600–650 nm wavelength range and they are widely used in white LEDs application.13,30–33 In sharp contrast, Mn4+-activated oxides showed far-red emissions at around 700 nm, which are vital to plant growth in photomorphogenesis process. So Mn4+-activated oxides have potential applications as spectral converters for pc-LEDs towards indoor plant growth lighting.14,34,35
In recent years, double-perovskite oxides with octahedral crystal sites are considered as good host materials for Mn4+ activator.35–37 In a previous paper by Liu and co-workers, the Sr1−xCaxLaMgSbO6:Eu3+ phosphors have been researched, and the structural analysis shows that the host compound has two kind of octahedral structures, [MgO6] and [SbO6].38 Thus, in this present paper, Mn4+-doped SrLaMgSbO6 (SLMS) phosphors have been synthesized and their crystal structure and optical properties were studied. The SLMS host contains two octahedral structures of [MgO6] and [SbO6], and the Mn4+ ions prefer to occupy the Sb5+ sites to form the phase of SLMS:Mn4+. Under the excitation of 333 nm, the SLMS:Mn4+ phosphors emitted far-red light peaking at 705 nm in the spectral range from 625 to 800 nm, which was attributed to the 2Eg → 4A2g transition of Mn4+ ions. More importantly, the emission spectrum of the SLMS:Mn4+ phosphors could match well with the absorption curve of phytochrome PFR, indicating the far-red light from the SLMS:Mn4+ phosphors could be efficiently absorbed by phytochrome PFR. The CIE chromaticity coordinates, internal quantum efficiency (IQE), and thermal stability of SLMS:Mn4+ phosphors were also investigated in detail. The results demonstrated that the Mn4+-activated SLMS phosphors have much potential to serve as far-red emitting phosphors for indoor plant growth lighting.
Experimental section
SrLaMgSb1−xO6:xMn4+ (abbreviated as: SLMS:xMn4+; x = 0.05–1.2%) phosphors were synthesized by a traditional solid-state reaction method. The starting materials of SrCO3 (analytical reagent, AR), La2O3 (99.99%), MgO (AR), Sb2O5 (99%), and MnCO3 (AR), were weighed according to the stoichiometric ratio. Using an agate mortar, the mixed starting materials were ground and then transferred to Al2O3 crucible to preheat at 500 °C for 3 h in air. After cooling to room temperature, the preheated mixtures were reground again into powders for further calcination at 1500 °C for 6 h in air to get the target SLMS:xMn4+ phosphors.
The X-ray diffraction (XRD) patterns and morphology properties of SLMS:xMn4+ phosphors were measured on a X-ray diffractometer (Cu-Kα radiation; Bruker D8 Advance) and a field-emission scanning electron microscope (FE-SEM; MAIA3 TES-CAN), respectively. Structure refinements were made using Fullprof program. The room-temperature photoluminescence (PL) spectra and the PL excitation (PLE) spectra were measured by an Edinburgh FS5 spectrofluorometer with a 150 W continued-wavelength xenon lamp. The luminescence decay lifetimes, the temperature-dependent spectra, and IQE were recorded by using the same spectrofluorometer, equipping with a pulsed xenon lamp, a temperature controller, and an integrating sphere, respectively. The prototype far-red light-emitting device was fabricated by coating the SLMS:0.8%Mn4+ phosphors onto a 365 nm near-UV InGaN LED chip, and the corresponding electroluminescent (EL) properties were measured by using a spectroradiometer system (HAAS-2000, Everfine).
Results and discussion
Fig. 1 shows the XRD patterns of the SLMS:xMn4+ (x = 0.05%, 0.8%, and 1.2%) phosphors together with the standard card of the CaLaMgMoO6 (JCPDS #43-0043). Compared to the standard card of the CaLaMgMoO6 compound, no other crystalline phase was formed in the SLMS:xMn4+ phosphors. Fig. 2(a) and Fig. 2(b) represent the refinement result and the corresponding crystal structure of the SLMS:0.8%Mn4+ phosphors, respectively. Table 1 gives the main parameters of the crystal cell for SLMS:0.8%Mn4+ phosphors, in which a = 5.63586(16) Å, b = 5.62543(13) Å, c = 7.95407(19) Å, and V = 252.177(6) Å3. The SLMS:0.8%Mn4+ phosphors with double perovskite structure was belong to monoclinic crystal system and a P21/n space group. The host was composed by two octahedral structures of [MgO6] and [SbO6]. Considering the ion radii and CN of the Sb5+ ions (r = 0.6 Å, CN = 6), Mg2+ ions (r = 0.72 Å, CN = 6), and Mn4+ ions (r = 0.53 Å, CN = 6), the Mn4+ ions were more inclined to occupy the Sb5+ sites in SLMS host to form the SLMS:Mn4+ compound.39–41 Another parameter to determine which ions were substituted by Mn4+ ions was the radii percentage difference (Dr) between the doping ions (here was Mn4+ ions) and the possible substituted ions (here were Sb5+ and Mg2+ ions). The ratio can be estimated by the following expression:42,43| |
 | (1) |
where Rm(CN) and Rd(CN) are the ionic radii of the host cations (Mg2+ and Sb5+ ions) and the doped Mn4+ ions, respectively. Herein, Rd(CN) = 0.53 Å; the value of Rm(CN) is 0.72 Å and 0.6 Å for Mg2+ and Sb5+ ions, respectively. In this host, CN = 6 for Mn4+, Mg2+, and Sb5+ ions. Thus, the values of Dr were 26% and 12% for Mg2+ host cation and Sb5+ host cation, respectively. Because when Mn4+ ions substituted for Mg2+ ions, the Dr ratio was higher than Mn4+ ions substituted for Sb5+ ions, so the Mn4+ ions were prefer to substitute for Sb5+ than Mg2+ ions. On the other hand, the valence of the Sb5+ ions was closer to Mn4+ ions than Mg2+ ions. Therefore, considering the radii and the valence, the Mn4+ ions would substitute for Sb5+ sites to form the SLMS:Mn4+ phosphors. Fig. 3 shows the typical FE-SEM image of the SLMS:0.8%Mn4+ phosphors. The sizes of the as-prepared sample was found to be about 1–6 μm, and the crystal-surfaces was smooth which was beneficial to get uniform luminescence intensity.
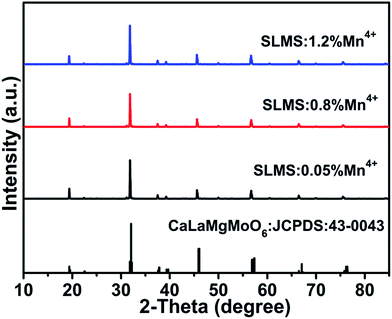 |
| | Fig. 1 XRD patterns of the SLMS:xMn4+ (x = 0.05%, 0.8%, and 1.2%) phosphors together with the stand card of CaLaMgMoO6 (JCPDS #43-0043). | |
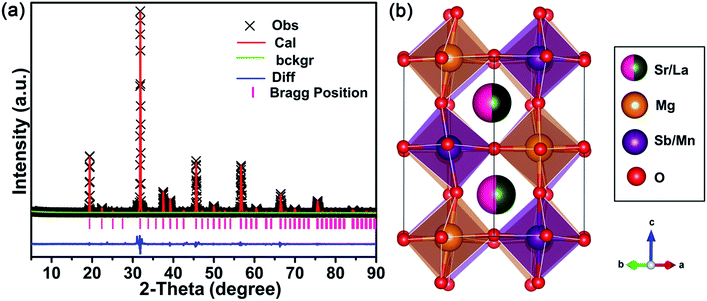 |
| | Fig. 2 (a) Rietveld refinement of the XRD pattern for the SLMS:0.8%Mn4+ phosphors. (b) The crystal structure of the SLMS:0.8%Mn4+ phosphors. | |
Table 1 Refined crystallographic parameters of SLMS:0.8%Mn4+ phosphors
| Formula |
SLMS:0.8%Mn4+ |
| Crystal system |
Monoclinic |
| Space group |
P21/n |
| a |
5.63586(16) Å |
| b |
5.62543(13) Å |
| c |
7.95407(19) Å |
| α |
90° |
| β |
90.054(4)° |
| γ |
90° |
| V |
252.177(6) Å3 |
| RP |
10.53% |
| RWP |
13.86% |
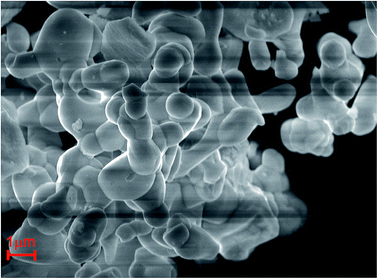 |
| | Fig. 3 The typical FE-SEM of SLMS:0.8%Mn4+ phosphors. | |
The PLE spectrum (λem = 705 nm) of the SLMS:0.8%Mn4+ phosphors with four Gaussian fitting peaks was shown in Fig. 4(a). Four PLE peaks at 298 nm (33![[thin space (1/6-em)]](https://www.rsc.org/images/entities/char_2009.gif) 557 cm−1; Mn4+–O2− charge-transfer transition), 338 nm (29
557 cm−1; Mn4+–O2− charge-transfer transition), 338 nm (29![[thin space (1/6-em)]](https://www.rsc.org/images/entities/char_2009.gif) 586 cm−1; 4A2g → 4T1g transition), 423 nm (23
586 cm−1; 4A2g → 4T1g transition), 423 nm (23![[thin space (1/6-em)]](https://www.rsc.org/images/entities/char_2009.gif) 641 cm−1; 4A2g → 2T2g transition), and 495 nm (20
641 cm−1; 4A2g → 2T2g transition), and 495 nm (20![[thin space (1/6-em)]](https://www.rsc.org/images/entities/char_2009.gif) 202 cm−1; 4A2g → 4T2g transition) were observed, and the PLE peaks at 333 nm and 499 nm dominated the PLE spectrum.44–46 Under excitations at 333 nm and 499 nm, the SLMS:0.8%Mn4+ phosphors exhibited a far-red emission band peaking at 705 nm (2Eg → 4A2g transition) in the range of 625–800 nm,47–49 as shown in Fig. 4(b). Fig. 4(c) displays the PL spectra of the SLMS:xMn4+ (x = 0.05%, 0.6%, 0.8%, 1.0%, and 1.2%) phosphors with different Mn4+ doping concentrations under 333 nm excitation. As the Mn4+ concentration increased, the PL intensity firstly showed an increasing trend, and then decreased when the concentration was higher than 0.8 mol%, indicating the occurrence of the concentration quenching effect. Fig. 4(d) shows the luminescence decay curves of the SLMS:xMn4+ (x = 0.05%, 0.6%, 0.8%, 1.0%, and 1.2%) phosphors. The decay lifetimes of the as-prepared samples were obtained by using the following double exponential expression:50–53
202 cm−1; 4A2g → 4T2g transition) were observed, and the PLE peaks at 333 nm and 499 nm dominated the PLE spectrum.44–46 Under excitations at 333 nm and 499 nm, the SLMS:0.8%Mn4+ phosphors exhibited a far-red emission band peaking at 705 nm (2Eg → 4A2g transition) in the range of 625–800 nm,47–49 as shown in Fig. 4(b). Fig. 4(c) displays the PL spectra of the SLMS:xMn4+ (x = 0.05%, 0.6%, 0.8%, 1.0%, and 1.2%) phosphors with different Mn4+ doping concentrations under 333 nm excitation. As the Mn4+ concentration increased, the PL intensity firstly showed an increasing trend, and then decreased when the concentration was higher than 0.8 mol%, indicating the occurrence of the concentration quenching effect. Fig. 4(d) shows the luminescence decay curves of the SLMS:xMn4+ (x = 0.05%, 0.6%, 0.8%, 1.0%, and 1.2%) phosphors. The decay lifetimes of the as-prepared samples were obtained by using the following double exponential expression:50–53
| |
I = A1![[thin space (1/6-em)]](https://www.rsc.org/images/entities/char_2009.gif) exp(−t/τ1) + A2 exp(−t/τ1) + A2![[thin space (1/6-em)]](https://www.rsc.org/images/entities/char_2009.gif) exp(−t/τ2) exp(−t/τ2)
| (2) |
herein,
I refers to the luminescent emission intensity of SLMS:
xMn
4+ phosphors at time
t.
τ1 and
τ2 are the lifetimes for the exponential component;
A1 and
A2 are constants. Accordingly, the decay lifetimes of the SLMS:
xMn
4+ phosphors were found to be 1.257, 1.130, 1.068, 1.034, and 0.950 ms when
x = 0.05%, 0.6%, 0.8%, 1.0%, and 1.2%, respectively. Obviously, the decay lifetimes decreased with the increasing Mn
4+ concentration, due to the non-radiative energy transfer in the SLMS:Mn
4+ phosphors.
54
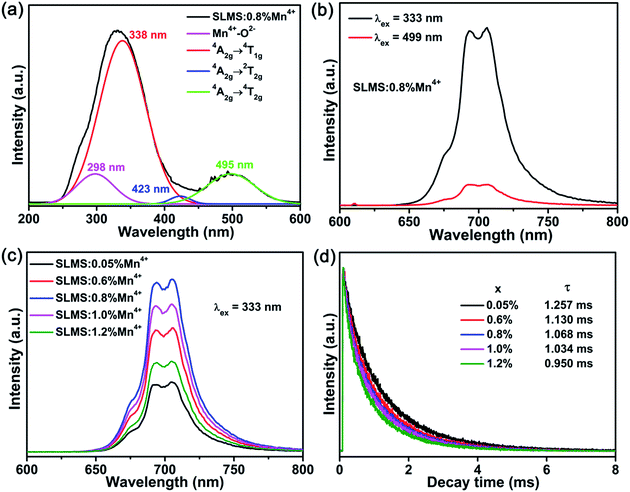 |
| | Fig. 4 (a) The PLE spectrum of SLMS:0.8%Mn4+ phosphors monitored at 705 nm. The four Gaussian fitting curves also displayed in the figure. (b) The PL spectra of SLMS:0.8%Mn4+ phosphors excited at 333 nm and 499 nm. (c) The PL spectra of SLMS:xMn4+ (x = 0.05–1.2%) phosphors excited at 333 nm. (d) The luminescence decay curves of SLMS:xMn4+ (x = 0.05–1.2%) phosphors (λex = 333 nm; λem = 705 nm). | |
The critical distance (Rc) is usually used to determine which kind of interaction contribute to the concentration quenching in phosphors. And the Rc for SLMS:xMn4+ phosphors can be estimated by the following expression:55–58
| |
 | (3) |
where
V is the volume of the unit cell and
xc is the optimal doping concentration of Mn
4+ ions in SLMS host;
N is the number of host cations which is available for Mn
4+ ions to be substituted. In SLMS host,
N = 2,
V = 252.177(6) Å
3, and
xc = 0.8%. Thus, the value of
xc was calculated to be 31.1 Å. The
Rc for SLMS:Mn
4+ phosphors was much larger than 5 Å, and thus the electric multipole interaction was the mechanism responsible for the concentration quenching effect in SLMS:Mn
4+ phosphors.
59
Fig. 5(a) shows the CIE chromaticity diagram of SLMS:0.8%Mn4+ phosphors. The corresponding CIE coordinates were determined to be (0.733, 0.268), which were located in the far-red region. Fig. 5(b) compares the PL spectrum of the SLMS:0.8%Mn4+ phosphors with the absorption spectrum of phytochrome PFR in the range of 500–800 nm, in which the phytochrome PFR was taken from ref. 10. Apparently, the far-red light emission of the SLMS:0.8%Mn4+ phosphors was matched well with the absorption spectrum of the phytochrome PFR, indicating that the phytochrome PFR was sensitive to the far-red light from the SLMS:0.8%Mn4+ phosphors. Thus, the luminescent properties of the SLMS:0.8%Mn4+ phosphors demonstrated that they had bright prospects to be used in far-red LEDs for indoor plant growth.
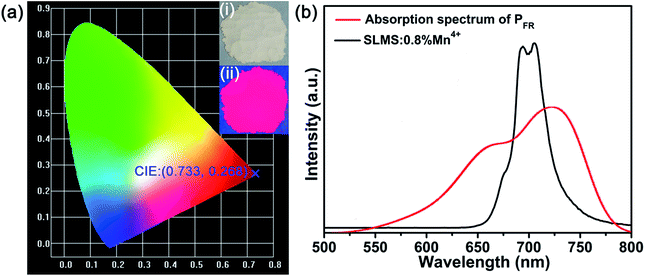 |
| | Fig. 5 (a) The CIE chromaticity diagram of the SLMS:0.8%Mn4+ phosphors. Insets represent the digital photographs under daylight (i) and a 365 nm UV lamp (ii). (b) The PL spectrum of the SLMS:0.8%Mn4+ phosphors excited at 333 nm and the absorption spectrum of the phytochrome PFR. | |
The IQE of SLMS:0.8%Mn4+ phosphors was measured to be 35%, as shown in Fig. 6(a). Moreover, the thermal stability of the SLMS:0.8%Mn4+ phosphors was also investigated. Fig. 6(b) shows the temperature-dependent PL spectra of the SLMS:0.8%Mn4+ phosphors under 333 nm excitation. The PL intensity was gradually decreased when the temperature increased, and the emission intensity at 363 K remained about 55% of that at 303 K, which could be seen clearly in Fig. 6(b) and (c). Although the thermal stability was not good as the Ca2YSbO6:Mn4+ (remained 63% at 373 K),60 Ca2LaNbO6:Mn4+ (remained about 50% at 400 K),40 and CaLaMgNbO6 (remained about 45% at 423 K),41 in the next work, we may improve the thermal behavior and luminescence intensity by co-doping another ions such as Li+, Na+, Mg2+, and Ba2+.49,60–62 Based on the temperature-dependent PL spectra of the SLMS:0.8%Mn4+ phosphors, the corresponding relationship between 1/kT and ln(I0/I − 1) was shown in Fig. 6(d), and the activation energy can be estimated by using the following expression:38,63,64
| |
 | (4) |
where
I(
T) and
I0 are the PL intensity at temperature
T and the initial intensity at 303 K, respectively;
c is a constant;
k is the Boltzmann constant. The slope was found to be −0.3, indicating the activation energy was 0.3 eV. The possible luminescence thermal quenching process could be expressed by the inset in
Fig. 6(d). Generally, under the excitation of 333 nm or 499 nm, the electrons in the
4A
2g state were firstly excited to the higher
4T
1g or
4T
2g level, then relax to the lowest
2E
g excited state by non-radiative process.
65 After that, the electrons in the
2E
g level may return to the ground state in two ways. The one way was taken place through
2E
g →
4A
2g radiation transition (path: 1 → 2) with 705 nm far-red emission, and such process was occurred at room temperature. The other way was that the electrons in the
2E
g level may absorb enough energy to reach the intersection point at higher temperature, then return to the ground state (path: 1 → 3 → 4) by non-radiative relaxation and resulted in the decrease of the emission intensity of the SLMS:0.8%Mn
4+ phosphors.
66
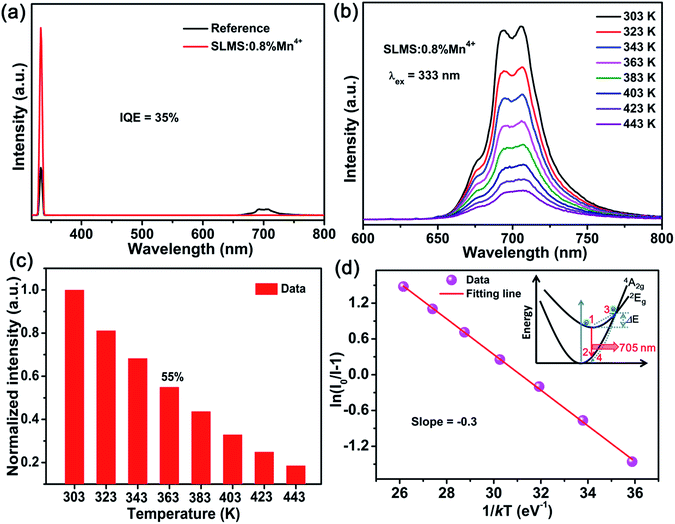 |
| | Fig. 6 (a) Excitation profile (λex = 333 nm) of the reference BaSO4 and the emission spectrum of the SLMS:0.8%Mn4+ phosphors obtained by using an integrating sphere. (b) The temperature-dependent spectra of the SLMS:0.8%Mn4+ phosphors in the temperature range of 303–443 K. (c) The normalized intensity of the PL intensity as a function of the sample temperature. (d) The plot of 1/kT vs. ln(I0/I − 1) for the SLMS:0.8%Mn4+ phosphors. Inset shows the simple configuration coordinate diagram of the 2Eg and 4A2g levels of Mn4+. | |
The crystal-filed strength (Dq) and two Racah parameters (B and C) of the SLMS host can be calculated by the following expressions (5)–(8):
| |
 | (6) |
| |
 | (7) |
| |
 | (8) |
where
E(
4A
2g →
4T
1g),
E(
4A
2g →
4T
2g), and
E(
2E
g →
4A
2g) was obtained from the emission peaks of 338 nm, 495 nm, and 705 nm, respectively. Thus, according to the exp.
(5)–(8), the crystal-filed strength
Dq and Racah parameters
B and
C were obtained to be 2020, 999, 2356 cm
−1, respectively. Correspondingly, the
Dq/
B was calculated to be 2.02, which was higher than that of the Lu
3−xY
xAl
5O
12:Mn
4+ (
Dq/
B = 1.45;
x = 0),
49 Ba
2YSbO
6:Mn
4+ (
Dq/
B = 1.88),
61 and SrGe
4O
9:Mn
4+ (
Dq/
B = 1.20).
67 Fig. 7 shows the Tanabe–Sugano energy level diagram of d
3 electron configuration for Mn
4+ in the octahedral crystal filed. Apparently, in an octahedral environment, the ground state
4A
2g and excited state
4T
1g and
4T
2g were split by the
4F term, and the excited state
2T
2g and
2E
g were derived from the
2G term.
39,68 The levels of
4T
1g,
4T
2g,
2T
2g, and
2E
g made up the important energy levels for Mn
4+ ions to emit far-red light in an octahedral environment.
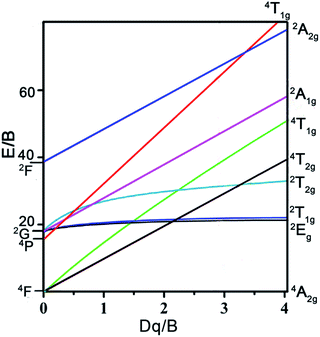 |
| | Fig. 7 Tanabe–Sugano energy level diagram of d3 electron configuration for Mn4+ in the octahedral crystal filed. | |
Fig. 8 shows the EL spectrum of the as-prepared far-red LED device. A far-red emission band in the 600–780 nm wavelength range was observed, attributing to the 2Eg → 4A2g transition. The external quantum efficiency of the as-prepared far-red LED device was found to be 0.34%. The far-red light from the as-prepared prototype LED device could be easily seen in the inset in Fig. 8. All the results indicated the as-prepared SLMS:Mn4+ phosphors have a promising prospect to be used in plant growth LEDs.
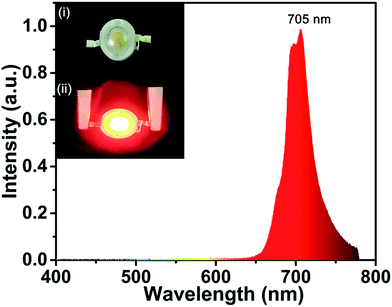 |
| | Fig. 8 EL spectrum of the fabricated far-red-emitting LED device by using SLMS:0.8%Mn4+ phosphors and a 365 nm near-UV LED chip under a bias current of 240 mA. Insets show the fabricated LED device without (i) and with (ii) a 240 mA bias current. | |
Conclusions
In summary, double perovskite SLMS:Mn4+ phosphors were synthesized by using the high-temperature solid-state reaction. The excitation band of the SLMS:Mn4+ phosphors could be fitted into four Gaussian peaks at 298, 338, 423, and 495 nm. The PL spectrum of the SLMS:Mn4+ phosphors showed a far-red emission band peaking at 705 nm, which could match well with the absorption spectrum of the phytochrome PFR. The optimal doping concentration of Mn4+ ions in SLMS:xMn4+ phosphors was x = 0.8%. It was worth noting that the emission intensity of the SLMS:0.8%Mn4+ phosphors was remained about 55% at 363 K compared with that at 303 K, indicating that the as-prepared phosphors showed good thermal-stability behavior. Furthermore, the IQE of the SLMS:0.8%Mn4+ phosphors reached as high as 35%. All the above results suggest that the SLMS:xMn4+ phosphors with far-red emission possess an outstanding potential to be used as far-red emitting phosphors in the application of far-red LEDs for indoor plant growth.
Conflicts of interest
There are no conflicts to declare.
Acknowledgements
This work was supported by the National Natural Science Foundation of China (No. 51502190), the Program for the Outstanding Innovative Teams of Higher Learning Institutions of Shanxi, and the Open Fund of the State Key Laboratory of Luminescent Materials and Devices (South China University of Technology, No. 2017-skllmd-01).
References
- J. Zhong, W. Zhao, L. Yang, P. Shi, Z. Liao, M. Xia, W. Pu, W. Xiao and L. Wang, RSC Adv., 2018, 8, 13054–13060 RSC.
- F. Du, W. Zhuang, R. Liu, Y. Liu, J. Zhong, P. Gao, X. Zhang, W. Gao and L. Shao, RSC Adv., 2017, 7, 1075–1081 RSC.
- X. Huang, J. Alloys Compd., 2017, 690, 356–359 CrossRef CAS.
- G.-G. Wang, X.-F. Wang, L.-W. Dong and Q. Yang, RSC Adv., 2016, 6, 42770–42777 RSC.
- D. Qin and W. Tang, RSC Adv., 2017, 7, 2494–2502 RSC.
- X. Huang, Nat. Photonics, 2014, 8, 748–749 CrossRef CAS.
- P. Du, X. Huang and J. S. Yu, Inorg. Chem. Front., 2017, 4, 1987–1995 RSC.
- P. Du, L. Luo, X. Huang and J. S. Yu, J. Colloid Interface Sci., 2018, 514, 172–181 CrossRef CAS PubMed.
- H. Guo, B. Devakumar, B. Li and X. Huang, Dyes Pigm., 2018, 151, 81–88 CrossRef CAS.
- Z. Zhou, J. Zheng, R. Shi, N. Zhang, J. Chen, R. Zhang, H. Suo, E. M. Goldys and C. Guo, ACS Appl. Mater. Interfaces, 2017, 9, 6177–6185 CrossRef CAS PubMed.
- H. Smith, Nature, 2000, 407, 585–591 CrossRef CAS PubMed.
- J. Chen, N. Zhang, C. Guo, F. Pan, X. Zhou, H. Suo, X. Zhao and E. M. Goldys, ACS Appl. Mater. Interfaces, 2016, 8, 20856–20864 CrossRef CAS PubMed.
- Y. Zheng, H. Zhang, H. Zhang, Z. Xia, Y. Liu, M. S. Molokeev and B. Lei, J. Mater. Chem. C, 2018, 6, 4217–4224 RSC.
- L. Li, Y. Pan, Z. Chen, S. Huang and M. Wu, RSC Adv., 2017, 7, 14868–14875 RSC.
- S. Wang, Q. Sun, B. Devakumar, L. Sun, J. Liang and X. Huang, RSC Adv., 2018, 8, 30191–30200 RSC.
- Z. Zhou, Y. Zhong, M. Xia, N. Zhou, B. Lei, J. Wang and F. Wu, J. Mater. Chem. C, 2018, 6, 8914–8922 RSC.
- Y. Li, S. Qi, P. Li and Z. Wang, RSC Adv., 2017, 7, 38318–38334 RSC.
- T. Senden, E. J. van Harten and A. Meijerink, J. Lumin., 2018, 194, 131–138 CrossRef CAS.
- L. Qin, S. Bi, P. Cai, C. Chen, J. Wang, S. I. Kim, Y. Huang and H. J. Seo, J. Alloys Compd., 2018, 755, 61–66 CrossRef CAS.
- T. T. Deng, E. H. Song, J. Su, Y. Y. Zhou, L. Y. Wang, S. Ye and Q. Y. Zhang, J. Mater. Chem. C, 2018, 6, 4418–4426 RSC.
- P. Cai, L. Qin, C. Chen, J. Wang, S. Bi, S. I. Kim, Y. Huang and H. J. Seo, Inorg. Chem., 2018, 57, 3073–3081 CrossRef CAS PubMed.
- L. Y. Wang, E. H. Song, T. T. Deng, Y. Y. Zhou, Z. F. Liao, W. R. Zhao, B. Zhou and Q. Y. Zhang, Dalton Trans., 2017, 46, 9925–9933 RSC.
- T. Sasaki, J. Fukushima, Y. Hayashi and H. Takizawa, J. Lumin., 2017, 188, 101–106 CrossRef CAS.
- P. Cai, L. Qin, C. Chen, J. Wang and H. J. Seo, Dalton Trans., 2017, 46, 14331–14340 RSC.
- M. Zhu, Y. Pan, Y. Huang, H. Lian and J. Lin, J. Mater. Chem. C, 2018, 6, 491–499 RSC.
- Z. Wang, N. Wang, Z. Yang, Z. Yang, Q. Wei, Q. Zhou and H. Liang, J. Lumin., 2017, 192, 690–694 CrossRef CAS.
- H. Ming, S. Liu, L. Liu, J. Peng, J. Fu, F. Du and X. Ye, ACS Appl. Mater. Interfaces, 2018, 10, 19783–19795 CrossRef CAS PubMed.
- X. Huang and H. Guo, Dyes Pigm., 2018, 152, 36–42 CrossRef CAS.
- R. Cao, Z. Shi, G. Quan, T. Chen, S. Guo, Z. Hu and P. Liu, J. Lumin., 2017, 188, 577–581 CrossRef CAS.
- J. Zhong, S. Zhou, D. Chen, J. Li, Y. Zhu, X. Li, L. Chen and Z. Ji, Dalton Trans., 2018, 47, 8248 RSC.
- J. Chen, C. Guo, Z. Yang, T. Li, J. Zhao and J. McKittrick, J. Am. Ceram. Soc., 2016, 99, 218–225 CrossRef CAS.
- K. Seki, K. Uematsu, K. Toda and M. Sato, Chem. Lett., 2014, 43, 1213–1215 CrossRef CAS.
- L. Ma, D.-j. Wang, Z.-y. Mao, Q.-f. Lu and Z.-h. Yuan, Appl. Phys. Lett., 2008, 93, 144101 CrossRef.
- R. Cao, Z. Shi, G. Quan, Z. Luo, P. Tang, H. Ao and X. Yu, Opt. Mater., 2016, 57, 212–216 CrossRef CAS.
- X. Huang, J. Liang, B. Li, L. Sun and J. Lin, Opt. Lett., 2018, 43, 3305–3308 CrossRef PubMed.
- Q. Sun, S. Wang, B. Devakumar, B. Li, L. Sun, J. Liang and X. Huang, RSC Adv., 2018, 8, 28538–28545 RSC.
- J. Liang, L. Sun, B. Devakumar, S. Wang, Q. Sun, H. Guo, B. Li and X. Huang, RSC Adv., 2018, 8, 27144–27151 RSC.
- Q. Liu, L. Wang, W. Huang, X. Li, M. Yu and Q. Zhang, Ceram. Int., 2017, 43, 16292–16299 CrossRef CAS.
- X. Zhang, J. Nie, S. Liu, Y. Li and J. Qiu, J. Am. Ceram. Soc., 2018, 101, 1576–1584 CrossRef CAS.
- Z. Lu, H. Wang, D. Yu, T. Huang, L. Wen, M. Huang, L. Zhou and Q. Wang, Opt. Laser Technol., 2018, 108, 116–123 CrossRef CAS.
- G. Jiang, B. Yang, G. Zhao, Y. Liu, J. Zou, H. Sun, H. Ou, Y. Fang and J. Hou, Opt. Mater., 2018, 83, 93–98 CrossRef CAS.
- X. Huang, H. Guo and B. Li, J. Alloys Compd., 2017, 720, 29–38 CrossRef CAS.
- X. Huang, B. Li and H. Guo, J. Alloys Compd., 2017, 695, 2773–2780 CrossRef CAS.
- K. Li, H. Lian and R. V. Deun, J. Lumin., 2018, 198, 155–162 CrossRef CAS.
- T. Jansen, J. Gorobez, M. Kirm, M. G. Brik, S. Vielhauer, M. Oja, N. M. Khaidukov, V. N. Makhov and T. Jüstel, ECS J. Solid State Sci. Technol., 2018, 7, R3086–R3092 CrossRef CAS.
- A. Fu, L. Zhou, S. Wang and Y. Li, Dyes Pigm., 2018, 148, 9–15 CrossRef CAS.
- U. B. Humayoun, S. N. Tiruneh and D.-H. Yoon, Dyes Pigm., 2018, 152, 127–130 CrossRef.
- S. Zhang, Y. Hu, H. Duan, Y. Fu and M. He, J. Alloys Compd., 2017, 693, 315–325 CrossRef CAS.
- J. Long, Y. Wang, R. Ma, C. Ma, X. Yuan, Z. Wen, M. Du and Y. Cao, Inorg. Chem., 2017, 56, 3269–3275 CrossRef CAS PubMed.
- K. Li, D. Zhu and R. Van Deun, Dyes Pigm., 2017, 142, 69–76 CrossRef CAS.
- A. Fu, C. Zhou, Q. Chen, Z. Lu, T. Huang, H. Wang and L. Zhou, Ceram. Int., 2017, 43, 6353–6362 CrossRef CAS.
- K. Li, H. Lian and R. Van Deun, Dalton Trans., 2018, 47, 2501–2505 RSC.
- Z. Lu, T. Huang, R. Deng, H. Wang, L. Wen, M. Huang, L. Zhou and C. Yao, Superlattices Microstruct., 2018, 117, 476–487 CrossRef CAS.
- R. Cao, X. Liu, K. Bai, T. Chen, S. Guo, Z. Hu, F. Xiao and Z. Luo, J. Lumin., 2018, 197, 169–174 CrossRef CAS.
- B. Li, X. Huang, H. Guo and Y. Zeng, Dyes Pigm., 2018, 150, 67–72 CrossRef CAS.
- H. Guo, X. Huang and Y. Zeng, J. Alloys Compd., 2018, 741, 300–306 CrossRef CAS.
- X. Huang, B. Li, H. Guo and D. Chen, Dyes Pigm., 2017, 143, 86–94 CrossRef CAS.
- Z. Zhou, M. Xia, Y. Zhong, S. Gai, S. Huang, Y. Tian, X. Lu and N. Zhou, J. Mater. Chem. C, 2017, 5, 8201–8210 RSC.
- J. Y. Park, J. S. Joo, H. K. Yang and M. Kwak, J. Alloys Compd., 2017, 714, 390–396 CrossRef CAS.
- J. Zhong, D. Chen, X. Chen, K. Wang, X. Li, Y. Zhu and Z. Ji, Dalton Trans., 2018, 47, 6528–6537 RSC.
- J. Zhong, D. Chen, S. Yuan, M. Liu, Y. Yuan, Y. Zhu, X. Li and Z. Ji, Inorg. Chem., 2018, 57, 8978–8987 CrossRef CAS PubMed.
- D. Chen, Y. Zhou, W. Xu, J. Zhong, Z. Ji and W. Xiang, J. Mater. Chem. C, 2016, 4, 1704–1712 RSC.
- P. Du, X. Huang and J. S. Yu, Chem. Eng. J., 2018, 337, 91–100 CrossRef CAS.
- X. Huang, S. Wang, B. Li, Q. Sun and H. Guo, Opt. Lett., 2018, 43, 1307–1310 CrossRef PubMed.
- C. Yang, Z. Zhang, G. Hu, R. Cao, X. Liang and W. Xiang, J. Alloys Compd., 2017, 694, 1201–1208 CrossRef CAS.
- Q. Peng, R. Cao, Y. Ye, S. Guo, Z. Hu, T. Chen and G. Zheng, J. Alloys Compd., 2017, 725, 139–144 CrossRef CAS.
- S. J. Kim, H. S. Jang, S. Unithrattil, Y. H. Kim and W. B. Im, J. Lumin., 2016, 172, 99–104 CrossRef CAS.
- R. Cao, Y. Ye, Q. Peng, G. Zheng, H. Ao, J. Fu, Y. Guo and B. Guo, Dyes Pigm., 2017, 146, 14–19 CrossRef CAS.
|
| This journal is © The Royal Society of Chemistry 2018 |
Click here to see how this site uses Cookies. View our privacy policy here.  Open Access Article
 *
*


![[thin space (1/6-em)]](https://www.rsc.org/images/entities/char_2009.gif) 557 cm−1; Mn4+–O2− charge-transfer transition), 338 nm (29
557 cm−1; Mn4+–O2− charge-transfer transition), 338 nm (29![[thin space (1/6-em)]](https://www.rsc.org/images/entities/char_2009.gif) 586 cm−1; 4A2g → 4T1g transition), 423 nm (23
586 cm−1; 4A2g → 4T1g transition), 423 nm (23![[thin space (1/6-em)]](https://www.rsc.org/images/entities/char_2009.gif) 641 cm−1; 4A2g → 2T2g transition), and 495 nm (20
641 cm−1; 4A2g → 2T2g transition), and 495 nm (20![[thin space (1/6-em)]](https://www.rsc.org/images/entities/char_2009.gif) 202 cm−1; 4A2g → 4T2g transition) were observed, and the PLE peaks at 333 nm and 499 nm dominated the PLE spectrum.44–46 Under excitations at 333 nm and 499 nm, the SLMS:0.8%Mn4+ phosphors exhibited a far-red emission band peaking at 705 nm (2Eg → 4A2g transition) in the range of 625–800 nm,47–49 as shown in Fig. 4(b). Fig. 4(c) displays the PL spectra of the SLMS:xMn4+ (x = 0.05%, 0.6%, 0.8%, 1.0%, and 1.2%) phosphors with different Mn4+ doping concentrations under 333 nm excitation. As the Mn4+ concentration increased, the PL intensity firstly showed an increasing trend, and then decreased when the concentration was higher than 0.8 mol%, indicating the occurrence of the concentration quenching effect. Fig. 4(d) shows the luminescence decay curves of the SLMS:xMn4+ (x = 0.05%, 0.6%, 0.8%, 1.0%, and 1.2%) phosphors. The decay lifetimes of the as-prepared samples were obtained by using the following double exponential expression:50–53
202 cm−1; 4A2g → 4T2g transition) were observed, and the PLE peaks at 333 nm and 499 nm dominated the PLE spectrum.44–46 Under excitations at 333 nm and 499 nm, the SLMS:0.8%Mn4+ phosphors exhibited a far-red emission band peaking at 705 nm (2Eg → 4A2g transition) in the range of 625–800 nm,47–49 as shown in Fig. 4(b). Fig. 4(c) displays the PL spectra of the SLMS:xMn4+ (x = 0.05%, 0.6%, 0.8%, 1.0%, and 1.2%) phosphors with different Mn4+ doping concentrations under 333 nm excitation. As the Mn4+ concentration increased, the PL intensity firstly showed an increasing trend, and then decreased when the concentration was higher than 0.8 mol%, indicating the occurrence of the concentration quenching effect. Fig. 4(d) shows the luminescence decay curves of the SLMS:xMn4+ (x = 0.05%, 0.6%, 0.8%, 1.0%, and 1.2%) phosphors. The decay lifetimes of the as-prepared samples were obtained by using the following double exponential expression:50–53![[thin space (1/6-em)]](https://www.rsc.org/images/entities/char_2009.gif) exp(−t/τ1) + A2
exp(−t/τ1) + A2![[thin space (1/6-em)]](https://www.rsc.org/images/entities/char_2009.gif) exp(−t/τ2)
exp(−t/τ2)


