 Open Access Article
AgBr/g-C3N4 nanocomposites for enhanced visible-light-driven photocatalytic inactivation of Escherichia coli†
Sihui Zhana,
Qianlei Houa,
Yi Li b,
Shuanglong Maa,
Pengfei Wanga,
Yanan Lia and
Haitao Wang
 *a
*a
aKey Laboratory of Pollution Processes and Environmental Criteria (Ministry of Education), College of Environmental Science and Engineering, Nankai University, Tianjin 300071, P. R. China. E-mail: envwang@nankai.edu.cn; envwang@gmail.com
bDepartment of Chemistry, Tianjin University, Tianjin 300072, P. R. China
First published on 8th October 2018
Abstract
Visible-light-driven photocatalytic disinfection is highly desired for water treatment due to its advantages such as wide applicability and being free of disinfection byproducts. In this study, AgBr/g-C3N4 hybrid nanocomposites were evaluated as photocatalysts under visible light irradiation for water disinfection using Escherichia coli as a model pathogen. The physicochemical and photo-electrochemical properties of the photocatalyst were systematically characterized using advanced techniques including scanning electron microscopy (SEM), transmission electron microscopy (HRTEM), powder X-ray diffraction (XRD), UV-visible diffuse reflectance spectra (DRS), X-ray photoelectron spectroscopy (XPS), photoluminescence (PL) spectra and electron spin resonance (ESR) spectroscopy. The inactivation mechanism of E. coli was systematically investigated by monitoring the morphology change of the bacteria and analyzing the role of reactive species. The optimized AgBr/g-C3N4 hybrid photocatalyst exhibited remarkably enhanced visible-light-driven photocatalytic disinfection performance towards E. coli over that of pure g-C3N4 and AgBr under visible light, which could completely inactivate 107 cfu mL−1 E. coli in 90 min. Quenching studies indicated that h+ is the main reactive species responsible for inactivating E. coli. The mechanism study revealed a Z-scheme charge transfer mechanism between AgBr and g-C3N4. The g-C3N4 could effectively trap the photogenerated conduction band electrons of AgBr via a Z-scheme type of route, thus significantly promoting the electron–hole separation. The trapping of electrons by g-C3N4 could facilitate h+ accumulation, which accounts for the better disinfection performance of AgBr/g-C3N4 compared to AgBr and g-C3N4.
1. Introduction
According to a recent report by WHO and UNICEF,1 over 30% of the world population lack access to safe drinking water. Most of these people are from developing countries where water and wastewater infrastructures are often non-existent. In developing countries, people are often forced to rely on contaminated water for potable use. Every year, millions of people die because of severe waterborne diseases.The traditional water disinfection treatment techniques including UV irradiation, chlorination, and ozonation are very effective against most waterborne pathogens. However, it may be too costly to implement these traditional disinfection treatment techniques in developing regions. Developing point-of-use drinking water treatment methods is applicable to address this challenge where centralized drinking water treatment facilities are not available.2,3 Among various techniques proposed, photocatalytic disinfection is one of the most promising methods for point-of-use water treatment. With the irradiation of an appropriate light source, photocatalysts are capable of inactivating waterborne pathogens through the in situ formation of highly reactive oxygen species. Since the first photocatalytic bacterial inactivation was reported by Matsunaga et al.,4 numerous efficient photocatalysts have been developed and tested for the photocatalytic inactivation of pathogenic microorganisms.5,6
Since around 43% of energy emitted from the sun is in the form of visible light, it is desirable to develop photocatalysts that could efficiently utilize visible light (λ > 420 nm) to achieve efficient solar energy-driven disinfection.7,8 Unfortunately, most of the semiconductor photocatalysts, such as TiO2 and ZnO, can only utilize the UV portion of solar energy, which accounts for less than 4% of the total solar energy.9 While tremendous progress has been made, it is still a great challenge to develop highly efficient visible-light-active photocatalysts for practical application.10–13
Recently, graphitic carbon nitride (g-C3N4), a polymeric metal-free semiconductor made of earth-abundant elements, has attracted great attention because of its appropriate band gap (2.7 eV) and good photochemical and chemical stability.14–16 Nevertheless, due to small surface area, poor water dispersibility, rapid recombination of photogenerated charge carriers and insufficient visible-light absorption (<470 nm), the photocatalytic activity of g-C3N4 needs further improvement.15 Several strategies, such as element doping,17,18 and forming heterojunctions by coupling with metal and/or other semiconductors,19–23 have been proposed to prepare g-C3N4 based photocatalysts with improved performance. Coupling g-C3N4 with silver-containing compounds, such as Ag3PO4,24 AgVO4,25 AgW2O4,26 and Ag nanoparticles,27,28 has been reported to be an effective strategy for enhancing the visible light photocatalytic activity of g-C3N4. Silver bromide (AgBr), as an important photosensitive semiconductor with band gap ∼2.6 eV, has been widely used as a photosensitive material in photographic films.29 The application of pure AgBr is plagued by its poor photostability: it will undergo decomposition to release Ag+ and Br− under light irradiation.30 Therefore, rather than as a photocatalyst, AgBr has been more widely used as a modifier to prepare hybrid photocatalysts since it can facilitate electron–hole separation.31–36 Previous studies have shown that combining AgBr and g-C3N4 into heterojunctions could suppress not only the recombination of charge carriers but also the photocorrosion of AgBr, leading to enhanced photocatalytic performance.37,38 However, the photocatalytic disinfection properties of the AgBr/g-C3N4 heterojunction have not been well studied.
In this study, highly efficient AgBr/g-C3N4 nanocomposites were prepared by growth of AgBr nanoparticles on protonated g-C3N4. Photocatalytic disinfection activity of the nanocomposites under visible light irradiation is investigated using E. coli as a model pathogenic bacterium. The nanocomposites exhibit significantly enhanced photocatalytic bacterial inactivation compared to g-C3N4 and AgBr. The effects of AgBr content, solution pH and organic matter on the photocatalytic bacterial inactivation efficiency have been systematically studied. Detailed investigations of reactive species using chemical scavengers and the electron spin resonance (ESR) technique are carried out to determine the bacterial inactivation mechanisms.
2. Experimental
2.1 Materials
All reagents were of analytical grade and used without further purification. Anhydrous ethanol (C2H5OH), melamine (C3H6N6) and silver nitrate (AgNO3) were obtained from Jiangtian Chemical Technology Co. Ltd (Tianjin, China). Hexadecyltrimethylammonium bromide (CTAB) was purchased from Aladdin Industrial Corporation (Shanghai, China).2.2 Preparation and protonation of g-C3N4
g-C3N4 was prepared by a thermal condensation method using melamine as precursor.26 In a typical process, 10 g melamine powder was placed in a crucible and then covered with a lid. The crucible was placed in a muffle furnace and heated to 550 °C with a heating rate of 5 °C min−1 and maintained at this temperature for 4 hours. After cooling down to room temperature naturally, the product was collected and ground into fine powder.The protonation of g-C3N4 was achieved by hydrothermal treatment.37 Briefly, 500 mg g-C3N4 powder was dispersed in 40 mL of 0.2 M H2SO4 solution with vigorous stirring. The mixture was transferred to a Teflon-lined stainless steel autoclave with 50 mL capacity and heated at 150 °C for 24 h. After cooling down naturally to room temperature, the product was collected and washed thoroughly with deionized water and ethanol. Finally, the product was dried in air at 80 °C overnight for further use.
2.3 Preparation of the AgBr/g-C3N4 nanocomposite
In a typical procedure, 150 mg of protonated g-C3N4 was dispersed in 20 mL ethanol with the help of sonication. Then, 50 mL aqueous solution of CTAB was added into the suspension under vigorous stirring and the solution was kept stirring for 12 h. Subsequently, AgNO3 solution was added dropwise and the mixed solution was kept stirring for another 6 h. Finally, the sample was collected by centrifugation, washed thoroughly with deionized water and dried at 80 °C. The hybrid photocatalyst was labelled as AgBr/g-C3N4. The weight percentage of AgBr in the hybrid photocatalyst was 30% unless otherwise stated. Pure AgBr was prepared using an identical method without the presence of g-C3N4.2.4 Characterization
The phase and morphology of the samples were characterized using X-ray diffraction (XRD, Rigaku D/Max 2500PC), transmission electron microscopy (TEM, JEOL model JEM-1200EX) and scanning electron microscopy (SEM, Hitachi SU8010, Japan). The functional groups on the surface of the samples were characterized using a Nicolet 5DX-FTIR spectrometer with KBr as a reference. X-ray photoelectron spectroscopy (XPS) data were collected with a Thermo ESCALAB250 spectrometer to get bonding information of Ag, Br and C elements. Nitrogen adsorption–desorption isotherms were obtained with a Quantachrome Autosorb automated gas sorption system (Quantachrome Instruments, USA), and the isotherms were analyzed using the Barrett–Joyner–Halenda (BJH) model. Photoluminescence (PL) and photoresponse techniques were employed to evaluate the photoelectrochemical properties of the photocatalysts. ESR spectra were obtained with a Magnet TechMS400 spectrometer.2.5 Photocatalytic inactivation of E. coli
All materials used in the experiments were carefully sterilized. The photocatalytic inactivation of E. coli was carried out in a cylindrical glass reactor with double-walled cooling-water jacket. The E. coli cells were cultured at 37 °C in a shaking incubator. After a satisfactory cell density was obtained, the E. coli cells were harvested by centrifugation and washed thoroughly with sterilized 0.85% (w/v) saline solution. The final density of E. coli was diluted to ca. 107 cfu mL−1 using 0.85% (w/v) saline solution for disinfection experiments.For all disinfection experiments, photocatalysts were dispersed in saline solution to get a 4 mg mL−1 suspension. Typically, 250 μL of photocatalyst suspension was added to 10 mL of E. coli solution under constant stirring. The disinfection experiments were initiated by irradiating the solution using a 300 W xenon lamp with a UV cutoff (λ < 420 nm). The solution was sampled at planned times and the density of E. coli was determined using the standard plate count method. All bacterial disinfection experiments were repeated three times.
The morphology change of E. coli during the inactivation process was investigated with SEM. The death tendency of E. coli was studied using the fluorescence-based cell live/dead test.
3. Results and discussion
3.1 Characterization of AgBr/g-C3N4 nanocomposites
The crystal structure of g-C3N4 and AgBr/g-C3N4 hybrid photocatalysts were analyzed by XRD. As shown in Fig. 1a, all of the peaks in the XRD patterns of the samples could be easily indexed to the hexagonal g-C3N4 (JCPDS 87-1526) and cubic AgBr (JCPDS 6-438). No impurity peaks are observed in the XRD patterns except that of g-C3N4 and AgBr, suggesting that the as-synthesized samples are of pure phases. The XRD pattern of g-C3N4 exhibits two characteristic diffraction peaks at 27.7 and 13.1° that can be well ascribed to (002) and (100) diffraction planes, respectively. These two characteristic peaks are consistent with the previous results of g-C3N4. The prominent peak at 27.7° is ascribed to the interplanar stacking of aromatic units. The peak at 13.3°, with a much weaker intensity, corresponding to a distance d = 0.681 nm, is associated with interlayer stacking motif of tri-s-triazine units.39 The XRD pattern of pristine g-C3N4 is also shown as a comparison, which exhibits the same diffraction peaks as protonated g-C3N4. The results indicate that the typical layered structure of g-C3N4 is well kept and the protonation treatment does not change the phase of g-C3N4. For the XRD pattern of AgBr, the peaks at 26.8°, 30.9°, 44.4°, 55.1°, 64.5° and 73.3° are the corresponding plane reflections of (111), (200), (220), (222), (400) and (420) of the cubic AgBr, indicating that the sample is pure well-crystallized AgBr crystals. For AgBr/g-C3N4 nanocomposites, the diffraction pattern shows the coexistence of the diffraction peaks of both g-C3N4 and AgBr. With an increase of AgBr content, the relative intensity of the characteristic peaks of AgBr in the XRD pattern keeps increasing while that of the g-C3N4 keeps decreasing (Fig. S1a†). The narrow sharp peaks suggest that the AgBr in the hybrid photocatalysts is of high crystallinity.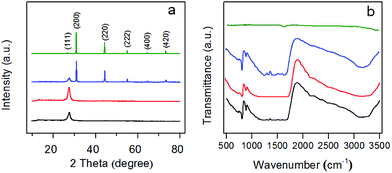 | ||
| Fig. 1 (a) XRD patterns and (b) FT-IR spectra of pristine g-C3N4 (black), protonated g-C3N4 (red), AgBr/g-C3N4 (blue) and AgBr (olive). | ||
FT-IR was used to identify the functional groups of as-prepared photocatalysts. Protonated g-C3N4 exhibits a similar FT-IR spectrum to that of pristine g-C3N4 (Fig. 1b), which is in accordance with a previous report by Ong et al.40 The wide peak at about 3200 cm−1 could be assigned to the stretching vibrations of N–H and O–H. The strong absorption peaks in the region of 1200–1650 cm−1, centered at 1635, 1572, 1416, 1325 and 1249 cm−1, are due to the characteristic stretching vibrations of C–N and C![[double bond, length as m-dash]](https://www.rsc.org/images/entities/char_e001.gif) N heterocycles.41 Additionally, the sharp peak at around 812 cm−1 is attributed to the characteristic breathing mode of tri-s-triazine units.42 Compared with g-C3N4, AgBr shows weak IR absorption. All of the AgBr/g-C3N4 hybrid photocatalysts therefore show analogous spectra due to the strong IR response of g-C3N4 (Fig. S1b†).
N heterocycles.41 Additionally, the sharp peak at around 812 cm−1 is attributed to the characteristic breathing mode of tri-s-triazine units.42 Compared with g-C3N4, AgBr shows weak IR absorption. All of the AgBr/g-C3N4 hybrid photocatalysts therefore show analogous spectra due to the strong IR response of g-C3N4 (Fig. S1b†).
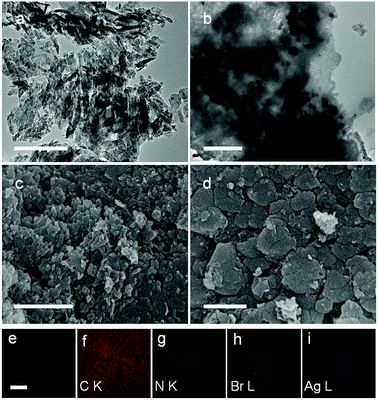
The morphology and microstructure of g-C3N4 and AgBr/g-C3N4 samples were characterized using TEM and SEM. As shown in Fig. 2a and c, g-C3N4 exhibits a porous network structure caused by the protonation treatment. During the hydrothermal process, g-C3N4 may decompose to form pores and defects on g-C3N4. As a comparison, pristine g-C3N4 exhibits a 2D lamellar structure composed of multiple nanosheets without apparent pores (Fig. S2a and S2b†), which was in accordance with reported results.43,44 The lateral size of protonated g-C3N4 is apparently smaller than that of pristine g-C3N4, indicating the decomposition of condensed triazine rings to clusters/oligomers. The porous structure leads to a larger specific surface area and provides abundant active sites for the growth of AgBr nanoparticles. Fig. 2b clearly shows the growth of AgBr nanoparticles with size around 100 nm uniformly dispersed on g-C3N4. The protonation treatment played an important role in the synthesis of AgBr/g-C3N4 hybrid photocatalyst; only very few AgBr nanoparticles can sporadically grow on the g-C3N4 nanosheets without treatment (result not shown). The AgBr particles synthesized in the absence of g-C3N4 exhibit apparently larger size up to 3 microns (Fig. S2c†). According to the classical nucleation and growth theory, homogeneous nucleation occurs with much more difficulty than heterogeneous one.45 Without the presence of g-C3N4, the nuclei formed at the initial stage are very limited and will result in the growth of larger particles. This result suggests that the abundant pores and defects on g-C3N4 could serve as the heterogeneous nucleation sites for growth AgBr nanoparticles. Compared with g-C3N4, the surface of the hybrid photocatalyst is much smoother, which can be attributed to the filling of pores of protonated g-C3N4 by AgBr nanoparticles. Fig. 2e is a representative SEM image of AgBr/g-C3N4 hybrid photocatalyst and Fig. 2f–i are the corresponding EDS elemental mappings for C, N, Br and Ag elements. On the elemental maps, the intensity of the brightness is correlated to the concentration of the corresponding element. The distribution of Br and Ag elements suggests that AgBr nanoparticles are well dispersed on g-C3N4.
The nitrogen adsorption–desorption isotherms and BJH pore size distribution plots of as-prepared samples are presented in Fig. 3. Except g-C3N4, the other two samples exhibit a type IV isotherm with H3 hysteresis loop (Fig. 3a), indicating the existence of pores in protonated g-C3N4 and AgBr/g-C3N4 samples. The specific surface areas of g-C3N4, protonated g-C3N4 and AgBr/g-C3N4 are 12.23, 55.94, 37.93 m2 g−1, respectively. The corresponding curves of pore size distributions (Fig. 3b) confirm that all samples have a broad pore size distribution ranging from 5 to 30 nm with maximum at 8 nm. The results clearly show that protonation treatment significantly expands the percentage of pores with smaller size, corroborating the TEM and SEM results. The percentage of small pores decreased after growth of AgBr nanoparticles, indicating the blockage of small pores by AgBr nanoparticles. The results clearly show that protonation treatment could significantly increase the specific surface area as well as the pore volume of g-C3N4. Assuming the shape of AgBr nanoparticles is close to spherical, based on the average size and density of AgBr, the theoretical specific area of AgBr can be estimated as 9 m2 g−1. Combining AgBr with g-C3N4 therefore produces hybrid photocatalysts with specific surface area smaller than that of g-C3N4. Moreover, since defects are the most reactive sites on protonated g-C3N4 matrix, the AgBr nanoparticles would be preferentially formed on the defects to form a homogeneous nanocomposite photocatalyst. The formation of AgBr nanoparticles on the g-C3N4 matrix would cause some blocking of the pores of g-C3N4, which will also contribute to the decrease of the specific surface area.
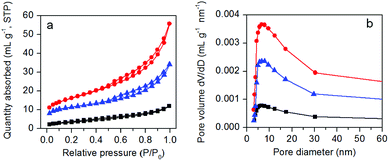 | ||
| Fig. 3 Nitrogen adsorption–desorption isotherms (a) and pore diameter distributions (b) of pristine g-C3N4 (black), protonated g-C3N4 (red), and AgBr/g-C3N4 (blue). | ||
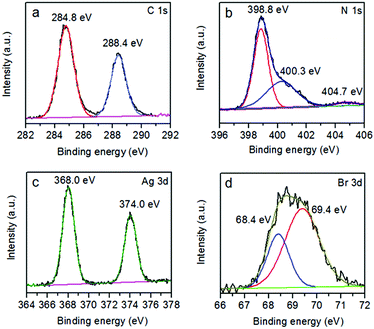
The XPS technique was employed to further investigate the chemical composition and identify the chemical status of the elements in the samples (Fig. 4 and S3†). The XPS survey scan spectrum confirms that g-C3N4 is made up of C, N and O elements (Fig. S3†). The presence of oxygen originates from the adsorption of oxygen from the atmosphere in the sample preparation process.46 For the hybrid photocatalyst, besides C, N and O elements, the existence of Ag and Br is observed. The C 1s spectrum in Fig. 4a shows two peaks centered at 284.8 and 288.4 eV. The peak at 284.8 eV is typically assigned to graphitic carbon atoms from adventitious carbon.47 The peak at 288.4 eV, corresponding to N![[double bond, length as m-dash]](https://www.rsc.org/images/entities/char_e001.gif) C–N2 is attributed to sp2-hybridized carbon with three N neighbors.48,49 Fig. 4b presents the XPS spectrum of N 1s, which could be deconvoluted into three peaks with binding energies of 398.8, 400.3 and 404.7 eV. The main component at 398.8 eV could be attributed to sp2-hybridized N in triazine rings (C
C–N2 is attributed to sp2-hybridized carbon with three N neighbors.48,49 Fig. 4b presents the XPS spectrum of N 1s, which could be deconvoluted into three peaks with binding energies of 398.8, 400.3 and 404.7 eV. The main component at 398.8 eV could be attributed to sp2-hybridized N in triazine rings (C![[double bond, length as m-dash]](https://www.rsc.org/images/entities/char_e001.gif) N–C).50 The peak at 400.3 eV is ascribed to the bridging nitrogen atoms in the aromatic cycles (N–(C)3).51 The third peak at 404.7 eV is associated with positive charge localization in heterocycle owing to the protonation of g-C3N4.22,52 The two peaks in the Ag spectrum could be ascribed to Ag 3d5/2 at 368.0 eV and Ag 3d3/2 at 374.0 eV (Fig. 4c).53 The Br spectrum comprises two individual peaks, Br 3d5/2 and Br 3d3/2, with binding energies of 68.0 eV and 69.0 eV, respectively (Fig. 4d).54 The atomic ratio of Ag to Br is 1.18, suggesting the nanocomposite may contain a few Ag nanoclusters.
N–C).50 The peak at 400.3 eV is ascribed to the bridging nitrogen atoms in the aromatic cycles (N–(C)3).51 The third peak at 404.7 eV is associated with positive charge localization in heterocycle owing to the protonation of g-C3N4.22,52 The two peaks in the Ag spectrum could be ascribed to Ag 3d5/2 at 368.0 eV and Ag 3d3/2 at 374.0 eV (Fig. 4c).53 The Br spectrum comprises two individual peaks, Br 3d5/2 and Br 3d3/2, with binding energies of 68.0 eV and 69.0 eV, respectively (Fig. 4d).54 The atomic ratio of Ag to Br is 1.18, suggesting the nanocomposite may contain a few Ag nanoclusters.
3.2 Photocatalytic inactivation of E. coli
The visible-light-driven photocatalytic disinfection performance of g-C3N4, AgBr and AgBr/g-C3N4 hybrid photocatalysts were evaluated using E. coli as a bacterial model. No apparent decrease of viable cell density is observed for dark control experiment (Fig. 5a), revealing the low cytotoxic nature of our sample towards E. coli without visible light irradiation. It is clearly shown in Fig. 5b that the viable cell density keeps constant in the blank control experiment, suggesting that the visible light has no negative effect on the cell viability. Both g-C3N4 and AgBr exhibit poor disinfection efficiency for inactivating E. coli. Only 0.61 and 0.36 log decrease in cell density is observed after visible light irradiation for 90 min for g-C3N4 and AgBr, respectively. This number is comparable to that for the dark control. Their weak disinfection activity could be therefore attributed to the rapid recombination of photogenerated charge carriers.6 On the contrary, AgBr/g-C3N4 nanocomposites exhibit significantly enhanced disinfection activity (Fig. 5b). The hybrid photocatalyst with 30% AgBr shows the best disinfection performance under visible light irradiation, which completely inactivates E. coli in 90 min. The results indicate that coupling of AgBr with g-C3N4 could effectively suppress the recombination of photogenerated charge pairs, leading to the enhancement of disinfection efficiency.55 Fig. 5c presents a plot of the inactivation efficiency against the AgBr percentage, the curve exhibiting a V-shape. The optimal loading of AgBr is ca. 30%; further increase of the loading amount will cause a decrease in performance due to blockage of the light path to g-C3N4. To investigate the enhancement mechanism, a control experiment was carried out using mechanically mixed g-C3N4 and AgBr as photocatalyst. Comparing with g-C3N4 and AgBr, the photocatalytic disinfection efficiency was greatly improved by simply mixing these two components. This result suggests that charge transfer could easily happen between g-C3N4 and AgBr. However, the enhancement is much weaker when compared with AgBr/g-C3N4. These results confirm the existence of the heterostructures between AgBr and g-C3N4 in the photocatalysts, which contribute to enhancement of the photocatalytic disinfection performance.3.3 Fluorescence-based cell live/dead test
To investigate the photocatalytic disinfection process of AgBr/g-C3N4 towards E. coli, the cell viability was measured with a live/dead fluorescence assay kit after exposure to light irradiation for different times. The DNAs of E. coli cells were stained with a mixed solution of two fluorescent dyes, SYTO9 and PI. SYTO9 is a cell-permeable green fluorescent dye labeling both live and dead cells, whereas PI is a cell-impermeable red fluorescent dye labeling only membrane-compromised cells. Prior to starting the experiment, only very few dead E. coli cells resulting from natural cell death are observed (Fig. 6). After 30 min, a small amount cells displaying red fluorescence are observed, implying the integrity of some bacterial cells is lost. Sixty minutes later, most of the E. coli cells adsorbed on the photocatalyst are dead (exhibiting red fluorescence), while a considerable number of E. coli cells in the free state are still alive. This result clearly shows that adsorption of bacteria onto the photocatalyst is the first step in the inactivation process. With the time extended to 75 min, most of the bacteria are agglomerated together and stained red. At 90 min, nearly all E. coli cells are agglomerated together into big clusters and dead. The results suggest that the bacterial cells are most likely killed by the direct attack of reaction species from the surface of the photocatalyst rather than reactive species diffused into the bulk solution.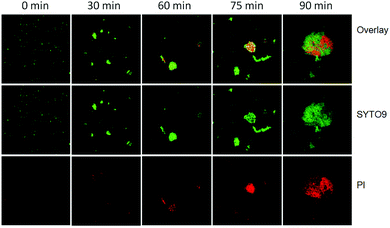 | ||
| Fig. 6 Confocal fluorescence images of live and dead E. coli cells during the photocatalytic disinfection process. Each image size is 185 × 185 μm2. | ||
3.4 Destruction of E. coli cells visualized by SEM
The morphology change of E. coli cells during the photocatalytic disinfection process was characterized using SEM. Prior to experiment, E. coli cells with smooth and intact membrane normally display a rod-shaped structure with average length of ca. 1 μm (Fig. 7a). Interestingly, it appears that one E. coli cell has just completed cell division. After 30 min, obvious pit deformation of the E. coli cell wall happened (Fig. 7b), implying the oxidation and destruction of the outer membrane of E. coli by photogenerated reactive species. The length of the E. coli cell is about 1.96 μm, almost two times that of a normal one. Cell elongation is a typical SOS response when exposed to detrimental biocides and UV irradiation, suggesting the cell is facing attack by photogenerated reactive species.56 With the extending of the disinfection time, cells with large cavities as well as severe elongation are observed, indicating the severe damage of the cell envelope. After 75 min, the cells exhibit plate instead of rod shape, indicating the leakage of cytoplasm through damaged cell membrane. After 90 min, the shape of each E. coli cell is severely deformed and parts of the cell are really flat due to the loss of cell inclusions. These results indicate that the destruction of E. coli cells firstly starts from the cell membrane and proceeds to the intracellular components with time, leading to the death of E. coli cells.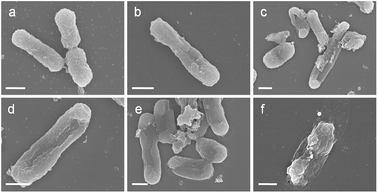 | ||
| Fig. 7 SEM images of E. coli treated with AgBr/g-C3N4 (100 μg mL−1) under visible light irradiation for (a) 0, (b) 30, (c) 45, (d) 60, (e) 75 and (f) 90 min. Scale bar is 500 nm. | ||
3.5 The effect of Ag+ ions
It is well known that AgBr is not stable under light irradiation and will undergo decomposition to release Ag+ into solution. To elucidate the effect of Ag+ on the disinfection performance of the photocatalysts, the Ag+ concentration during the disinfection experiment was monitored. During the photocatalytic disinfection process, the concentrations of Ag+ in the solution were ca. 0.16 and 0.13 ppm for AgBr and AgBr/g-C3N4, respectively, as determined by ICP. According to our previous study,26 0.5 ppm Ag+ can only result 0.62 log removal of E. coli in 90 min. So, the contribution of Ag+ to the disinfection performance of the photocatalysts was negligible.3.6 Influence of pH and humic acid
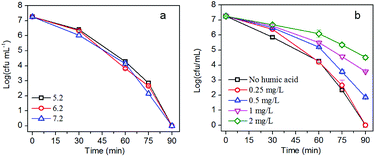
The pH of the solution during the photocatalytic disinfection process is usually considered to be an important factor since pH has a significant influence on the adsorption of bacteria on the photocatalyst. Moreover, the pH of water contaminated by pathogenic bacteria may vary due to the metabolic activity of the bacteria. The influence of pH on the photocatalytic inactivation of E. coli was studied by adjusting the pH of the solution while keeping other parameters constant. The solution pH shows negligible influence on the disinfection efficiency (Fig. 8a). The high tolerability of AgBr/g-C3N4 to pH would be beneficial for its practical use. Humic acid (HA) is the most common natural organic matter which widely exists in natural water. Originating from the decomposition of plants and animals, HA is composed of a hydrophobic aromatic core that is highly substituted with functional groups including alcohol, carboxyl, phenolic-OH, hydroxyl, carbonyl, amide, amine, and quinone. As shown in Fig. 8b, HA exhibits significant influence on disinfection efficiency of the nanocomposites in a dose-dependent manner. The disinfection efficiency shows apparent decrease when the concentration of HA is above 0.5 mg L−1. There are carboxyl, amidogen, and hydroxyl groups on the surface of cell membrane and cell wall of E. coli. Moreover, most nucleic acids, proteins, and other biomacromolecules contain aromatic rings. Given the structure of HA, E. coli and HA may interact with each other through forming hydrogen and π–π bonds. At higher concentration, HA would retard the collision between E. coli cells and photocatalysts. As confirmed by the fluorescence result, adsorption of E. coli is the first step for the disinfection process, and blocking the contact of E. coli and photocatalyst will definitely result in a decrease of the disinfection efficiency. HA can also absorb a broad spectrum of light; it therefore could mitigate the detrimental impacts of light irradiation on E. coli.57 Moreover, HA will compete with E. coli cells for reactive species, which also will lead to a decrease of disinfection efficiency.263.7 Mechanism of improved photocatalytic disinfection
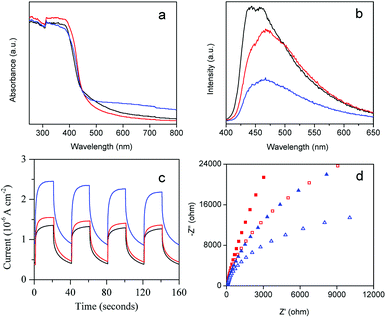
The photocatalytic disinfection performance of the photocatalyst is closely related to its photo-electrochemical properties. To investigate the enhanced mechanism of photocatalytic disinfection of AgBr/g-C3N4, we first measured the UV-visible diffuse reflectance spectra of the as-prepared samples (Fig. 9a). The calculated band gap energy of pristine g-C3N4 is 2.7 eV, which is lower than that of protonated g-C3N4 (2.78 eV), indicating that protonation treatment can cause a blue shift.58 This blue-shift phenomenon could be attributed to the weakening of the π-conjugated system due to the formation of pores.59 Comparing with g-C3N4, introducing AgBr to g-C3N4 matrix can only cause minimal changes in the absorption edge, while the absorption intensity in the visible region is significantly enhanced. Generally, the enhancement of absorption in the visible region increased with an increase of the percentage of AgBr. This enhancement could be ascribed to the formation of heterojunctions between AgBr and g-C3N4. The enhancement of visible light absorption can increase the production rate of free electrons and holes, which is beneficial for photocatalytic disinfection.To investigate the recombination and lifespan of photogenerated electron–hole pairs in the photocatalysts, the PL emission spectra of the samples were examined. As shown in Fig. 9b, all of the samples exhibit a similar shape with broad emission peak centered at 455 nm. Protonation treatment as well as AgBr doping can significantly weaken the intensity of the PL emission of g-C3N4. It is believed that the intensity of PL is positively correlated to the recombination probability of photogenerated charge carriers. The significant drop of the PL intensity of AgBr/g-C3N4 indicates that AgBr doping can effectively prevent the recombination of photogenerated electron–hole pairs. AgBr/g-C3N4 exhibits the lowest emission peak intensity (Fig. S4†), illustrating the lowest recombination of photogenerated charge carriers. The results are highly consistent with the photocatalytic disinfection result (Fig. 5b).
The transient photocurrent responses have been demonstrated to be a useful method to investigate the separation of photogenerated electron–hole pairs of the photocatalysts. Fig. 9c displays the results of the photocurrent response of g-C3N4 and AgBr/g-C3N4 with several on–off cycles of intermittent visible light irradiation. The photocurrent is formed from the separation and diffusion of the photoinduced electrons and holes.40 The current value dropped rapidly as the incident light was switched off and returned to the original value instantaneously when the light was switched on again. The quick on/off response of the photocurrent to visible light could be attributed to the rapid separation and transfer of the photogenerated charges on the surface of the prepared working electrodes. There is no appreciable difference in the photocurrent response time of the two photocatalysts, whereas the current value of the AgBr/g-C3N4 sample is much higher than that of g-C3N4, indicating more photogenerated charge carriers. The result suggests the heterojunctions formed between AgBr and g-C3N4 could efficiently promote the generation as well as separation of photogenerated electron–hole pairs.60 The results of photocurrent response together with the PL spectra results indicate that the efficient charge separation is the most important factor for the performance enhancement of AgBr/g-C3N4.
Electrochemical impedance spectra of g-C3N4 and AgBr/g-C3N4 were examined to determine their charge transfer resistance. As shown in the Nyquist plots in Fig. 9d, the arc radius of AgBr/g-C3N4 is smaller compared with g-C3N4 under visible light, indicating the better charge transfer ability of AgBr/g-C3N4 than g-C3N4. The arc radius of AgBr/g-C3N4 is also smaller than that of g-C3N4 in the dark, suggesting that AgBr loading facilitates charge transfer even in dark condition.
3.8 Analysis of reactive species
It is well known that reactive species including O2−, H2O2, OH, e−, and h+ play important roles in photocatalytic disinfection processes.6,26 The role of different reactive species varies for different photocatalysts. In order to clarify the role of reactive species in our system, different scavengers were introduced into the disinfection system to remove the corresponding reactive species. Ethylenediaminetetra-acetic acid disodium salt (EDTA-2Na), Cr(VI) and isopropanol were used as scavengers for h+, e− and ·OH, respectively. As is clear in Fig. 10a, adding EDTA-2Na into the experimental system caused the greatest drop in disinfection efficiency, suggesting that h+ is the main reactive species in the disinfection process. The addition of isopropanol (OH scavenger) and Cr(VI) (e− scavenger) can also cause apparent decrease of disinfection efficiency, suggesting that ·OH and e− are also involved in the disinfection process. Based on these results, h+ is supposedly the main reactive species in the photocatalytic disinfection process, although ·OH and e− are also involved. Given h+ can only exist on the surface of the photocatalyst, direct contact between E. coli and photocatalyst is therefore very important for inactivating E. coli. The results are consistent with the fluorescence assay and humic acid experiment which both suggest the critical role of direct contact in inactivating E. coli cells.To further investigate radical generation during the photocatalytic disinfection process, the ESR technique with DMPO as trapping agent was employed to detect the production of ·OH and ·O2− (Fig. 10b). As shown in Fig. 10b, no distinct signals could be observed for both ·OH and ·O2− radicals in the dark. After visible light irradiation for 5 min, quadruple characteristic peaks for the DMPO–·OH adduct with an intensity ratio of 1![[thin space (1/6-em)]](https://www.rsc.org/images/entities/char_2009.gif) :
:![[thin space (1/6-em)]](https://www.rsc.org/images/entities/char_2009.gif) 2
2![[thin space (1/6-em)]](https://www.rsc.org/images/entities/char_2009.gif) :
:![[thin space (1/6-em)]](https://www.rsc.org/images/entities/char_2009.gif) 2
2![[thin space (1/6-em)]](https://www.rsc.org/images/entities/char_2009.gif) :
:![[thin space (1/6-em)]](https://www.rsc.org/images/entities/char_2009.gif) 1 could be observed, confirming the formation of ·OH via the OH−/H2O oxidation by holes.61,62 Given that ·O2− radicals are very unstable and undergo disproportionation easily rather than slowly reacting with DMPO, DMPO–O2− adducts were detected in methanol. According to Fig. 10c, six characteristic peaks of the DMPO–·O2− adducts derived from O2 reduction by electrons are observed.63,64 It is also clear that the signal of ·O2− is much stronger than that of ·OH. The results confirmed that ·OH and ·O2− were produced by AgBr/g-C3N4 nanocomposite under visible light illumination, presenting solid evidence that photogenerated holes and electrons could remain long enough to react with dissolved oxygen/H2O to form ·OH and ·O2−.
1 could be observed, confirming the formation of ·OH via the OH−/H2O oxidation by holes.61,62 Given that ·O2− radicals are very unstable and undergo disproportionation easily rather than slowly reacting with DMPO, DMPO–O2− adducts were detected in methanol. According to Fig. 10c, six characteristic peaks of the DMPO–·O2− adducts derived from O2 reduction by electrons are observed.63,64 It is also clear that the signal of ·O2− is much stronger than that of ·OH. The results confirmed that ·OH and ·O2− were produced by AgBr/g-C3N4 nanocomposite under visible light illumination, presenting solid evidence that photogenerated holes and electrons could remain long enough to react with dissolved oxygen/H2O to form ·OH and ·O2−.
3.9 Disinfection mechanism
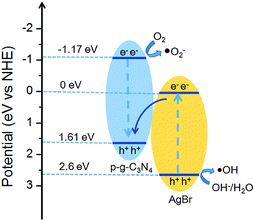
Based on the data derived from UV-visible DRS, the potentials of conduction band (CB) and valence band (VB) edges of g-C3N4 (AgBr) are determined to be −1.17 eV (0 eV) and +1.61 eV (+2.6 eV), respectively. When the AgBr/g-C3N4 photocatalysts were exposed to visible light, both AgBr and g-C3N4 could be excited to generate electron–hole pairs. According to the traditional charger carrier transfer mechanism, the photogenerated electrons in the CB of g-C3N4 will flow down to the CB of AgBr, and photogenerated positive carriers in the VB of AgBr will migrate to the VB of g-C3N4. However, considering the band structure of AgBr and g-C3N4, the electrons accumulated in the CB of AgBr (ECB = 0.0 eV) cannot reduce O2 to generate ·O2− (E°(O2/·O2−) = −0.33 eV), and the VB holes of g-C3N4 (EVB = 1.61 eV) cannot oxidize OH−/H2O to give ·OH (1.99 and 2.38 eV for OH−/·OH and H2O/·OH potential). This mechanism, therefore, is contradictory to the experimental results since both O2− and ·OH are detected in our system. Instead, the experimental phenomena could be perfectly explained by a Z-scheme charge transfer mechanism (Fig. 11). The VB holes of g-C3N4 recombine with the photogenerated electrons in the CB of AgBr. While the electrons remain in the CB of g-C3N4 to reduce O2 to yield ·O2− radicals.60,61 Meanwhile, the VB holes of AgBr oxidize OH−/H2O to give ·OH. Therefore, for the AgBr/g-C3N4 nanocomposites, the reduction active site is on the CB of g-C3N4 while the oxidation active site is on the VB of AgBr.4. Conclusions
In summary, a highly efficient visible-light-driven AgBr/g-C3N4 hybrid photocatalyst was successfully synthesized by growth of AgBr nanoparticles on a protonated g-C3N4 matrix. The AgBr/g-C3N4 hybrid photocatalysts exhibited excellent visible-light-driven photocatalytic inactivation toward E. coli, which outperformed g-C3N4 and AgBr. The optimal AgBr loading was 30%, and 107 cfu mL−1 E. coli could be completely inactivated in 90 min. The remarkably enhanced photocatalytic inactivation performance was ascribed to the enhanced generation as well as suppressed recombination of photogenerated charge carriers through a Z-scheme charge transfer route. The mechanism study suggests h+ was the main reactive species accounting for inactivation of E. coli.Conflicts of interest
There are no conflicts to declare.Acknowledgements
The authors gratefully acknowledge the financial support from the National Natural Science Foundation of China (grant no. 21377061), National Science and Technology Major Project (grant no. 2016ZX05058-003-004), and Natural Science Foundation of Tianjin (grant no. 15JCYBJC48400, 15JCZDJC41200 and 16YFZCSF00300).Notes and references
- W. H. Organization and UNICEF, Progress on Drinking Water, Sanitation and Hygiene: 2017 update and SDG baselines, 2017 Search PubMed.
- Q. Li, S. Mahendra, D. Y. Lyon, L. Brunet, M. V. Liga, D. Li and P. J. J. Alvarez, Water Res., 2008, 42, 4591–4602 CrossRef CAS PubMed.
- S. Lin, R. Huang, Y. Cheng, J. Liu, B. L. T. Lau and M. R. Wiesner, Water Res., 2013, 47, 3959–3965 CrossRef CAS PubMed.
- T. Matsunaga, R. Tomoda, T. Nakajima and H. Wake, FEMS Microbiol. Lett., 1985, 29, 211–214 CrossRef CAS.
- Q. Zhou, S. Ma and S. Zhan, Appl. Catal., B, 2018, 224, 27–37 CrossRef CAS.
- S. Ma, S. Zhan, Y. Jia, Q. Shi and Q. Zhou, Appl. Catal., B, 2016, 186, 77–87 CrossRef CAS.
- J. Liang, F. Liu, J. Deng, M. Li and M. Tong, Water Res., 2017, 123, 632–641 CrossRef CAS PubMed.
- M. N. Chong, B. Jin, C. W. K. Chow and C. Saint, Water Res., 2010, 44, 2997–3027 CrossRef CAS PubMed.
- N. S. Lewis, Science, 2007, 315, 798–801 CrossRef CAS PubMed.
- X. Bai, L. Wang, Y. Wang, W. Yao and Y. Zhu, Appl. Catal., B, 2014, 152–153, 262–270 CrossRef CAS.
- H. Huang, K. Xiao, Y. He, T. Zhang, F. Dong, X. Du and Y. Zhang, Appl. Catal., B, 2016, 199, 75–86 CrossRef CAS.
- H. Huang, K. Xiao, F. Dong, J. Wang, X. Du and Y. Zhang, RSC Adv., 2016, 6, 94361–94364 RSC.
- H. Huang, X. Han, X. Li, S. Wang, P. K. Chu and Y. Zhang, ACS Appl. Mater. Interfaces, 2015, 7, 482–492 CrossRef CAS PubMed.
- K. Li, Z. Zeng, L. Yan, S. Luo, X. Luo, M. Huo and Y. Guo, Appl. Catal., B, 2015, 165, 428–437 CrossRef CAS.
- H. Zhao, H. Yu, X. Quan, S. Chen, Y. Zhang, H. Zhao and H. Wang, Appl. Catal., B, 2014, 152–153, 46–50 CrossRef CAS.
- H. Huang, K. Xiao, N. Tian, F. Dong, T. Zhang, X. Du and Y. Zhang, J. Mater. Chem. A, 2017, 5, 17452–17463 RSC.
- K. Wang, Q. Li, B. Liu, B. Cheng, W. Ho and J. Yu, Appl. Catal., B, 2015, 176–177, 44–52 CAS.
- S. C. Yan, Z. S. Li and Z. G. Zou, Langmuir, 2010, 26, 3894–3901 CrossRef CAS PubMed.
- G. Li, X. Nie, J. Chen, Q. Jiang, T. An, P. K. Wong, H. Zhang, H. Zhao and H. Yamashita, Water Res., 2015, 86, 17–24 CrossRef CAS PubMed.
- W. Wang, J. C. Yu, D. Xia, P. K. Wong and Y. Li, Environ. Sci. Technol., 2013, 47, 8724–8732 CrossRef CAS PubMed.
- Y. Li, C. Zhang, D. Shuai, S. Naraginti, D. Wang and W. Zhang, Water Res., 2016, 106, 249–258 CrossRef CAS PubMed.
- H. Li, J. Liu, W. Hou, N. Du, R. Zhang and X. Tao, Appl. Catal., B, 2014, 160–161, 89–97 CrossRef CAS.
- C. Han, L. Ge, C. Chen, Y. Li, X. Xiao, Y. Zhang and L. Guo, Appl. Catal., B, 2014, 147, 546–553 CrossRef CAS.
- P. He, L. Song, S. Zhang, X. Wu and Q. Wei, Mater. Res. Bull., 2014, 51, 432–437 CrossRef CAS.
- T. Zhu, Y. Song, H. Ji, Y. Xu, Y. Song, J. Xia, S. Yin, Y. Li, H. Xu, Q. Zhang and H. Li, Chem. Eng. J., 2015, 271, 96–105 CrossRef CAS.
- Y. Li, Y. Li, S. Ma, P. Wang, Q. Hou, J. Han and S. Zhan, J. Hazard. Mater., 2017, 338, 33–46 CrossRef CAS PubMed.
- Y. Song, J. Qi, J. Tian, S. Gao and F. Cui, Chem. Eng. J., 2018, 341, 547–555 CrossRef CAS.
- Y. Liu, S. Yang, S.-N. Yin, L. Feng, Y. Zang and H. Xue, Chem. Eng. J., 2018, 334, 2401–2407 CrossRef CAS.
- R. J. Deri, J. P. Spoonhower and J. F. Hamilton, J. Appl. Phys., 1985, 57, 1968–1970 CrossRef CAS.
- D. Wang, L. Guo, Y. Zhen, L. Yue, G. Xue and F. Fu, J. Mater. Chem. A, 2014, 2, 11716–11727 RSC.
- X. Wen, C. Niu, L. Zhang, C. Liang, H. Guo and G. Zeng, J. Catal., 2018, 358, 141–154 CrossRef CAS.
- J. He, Y. Cheng, T. Wang, D. Feng, L. Zheng, D. Shao, W. Wang, W. Wang, F. Lu, H. Dong, R. Zheng and H. Liu, Appl. Surf. Sci., 2018, 40, 99–106 CrossRef.
- X. Wen, C. Niu, H. Guo, L. Zhang, C. Liang and G. Zeng, J. Catal., 2018, 358, 211–223 CrossRef CAS.
- X. Miao, X. Shen, J. Wu, Z. Ji, J. Wang, L. Kong, M. Liu and C. Song, Appl. Catal., A, 2017, 539, 104–113 CrossRef CAS.
- T. W. Ng, L. Zhang, J. Liu, G. Huang, W. Wang and P. K. Wong, Water Res., 2016, 90, 111–118 CrossRef CAS PubMed.
- J. N. Tiwari, K. Mahesh, N. H. Le, K. C. Kemp, R. Timilsina, R. N. Tiwari and K. S. Kim, Carbon, 2013, 56, 173–182 CrossRef CAS.
- Y. Feng, J. Shen, Q. Cai, H. Yang and Q. Shen, New J. Chem., 2015, 39, 1132–1138 RSC.
- X. Miao, Z. Ji, J. Wu, X. Shen, J. Wang, L. Kong, M. Liu and C. Song, J. Colloid Interface Sci., 2017, 502, 24–32 CrossRef CAS PubMed.
- H. Katsumata, T. Sakai, T. Suzuki and S. Kaneco, Ind. Eng. Chem. Res., 2014, 53, 8018–8025 CrossRef CAS.
- W.-J. Ong, L. K. Putri, L.-L. Tan, S.-P. Chai and S.-T. Yong, Appl. Catal., B, 2016, 180, 530–543 CrossRef CAS.
- C. Han, Y. Wang, Y. Lei, B. Wang, N. Wu, Q. Shi and Q. Li, Nano Res., 2015, 8, 1199–1209 CrossRef CAS.
- S. Zhou, Y. Liu, J. Li, Y. Wang, G. Jiang, Z. Zhao, D. Wang, A. Duan, J. Liu and Y. Wei, Appl. Catal., B, 2014, 158–159, 20–29 CrossRef CAS.
- J. Ma, C. Wang and H. He, Appl. Catal., B, 2016, 184, 28–34 CrossRef CAS.
- Z. Zhao, Y. Sun and F. Dong, Nanoscale, 2015, 7, 15–37 RSC.
- N. T. K. Thanh, N. Maclean and S. Mahiddine, Chem. Rev., 2014, 114, 7610–7630 CrossRef CAS PubMed.
- P. Niu, Y. Yang, J. C. Yu, G. Liu and H.-M. Cheng, Chem. Commun., 2014, 50, 10837–10840 RSC.
- G. Greczynski and L. Hultman, ChemPhysChem, 2017, 18, 1507–1512 CrossRef CAS PubMed.
- L. Ge, C. Han, J. Liu and Y. Li, Appl. Catal., A, 2011, 409–410, 215–222 CrossRef CAS.
- Q. Xiang, J. Yu and M. Jaroniec, J. Phys. Chem. C, 2011, 115, 7355–7363 CrossRef CAS.
- Y. Cui, J. Zhang, G. Zhang, J. Huang, P. Liu, M. Antonietti and X. Wang, J. Mater. Chem., 2011, 21, 13032–13039 RSC.
- Y. Yang, Y. Guo, F. Liu, X. Yuan, Y. Guo, S. Zhang, W. Guo and M. Huo, Appl. Catal., B, 2013, 142–143, 828–837 CrossRef CAS.
- B. Z. Ristic, M. M. Milenkovic, I. R. Dakic, B. M. Todorovic-Markovic, M. S. Milosavljevic, M. D. Budimir, V. G. Paunovic, M. D. Dramicanin, Z. M. Markovic and V. S. Trajkovic, Biomaterials, 2014, 35, 4428–4435 CrossRef CAS PubMed.
- Z. Liu, W. Guo, C. Guo and S. Liu, RSC Adv., 2015, 5, 72872–72880 RSC.
- C. Tang, H. Bai, L. Liu, X. Zan, P. Gao, D. D. Sun and W. Yan, Appl. Catal., B, 2016, 196, 57–67 CrossRef CAS.
- S. Yang, W. Zhou, C. Ge, X. Liu, Y. Fang and Z. Li, RSC Adv., 2013, 3, 5631–5638 RSC.
- S. Krishna, S. Maslov and K. Sneppen, PLoS Comput. Biol., 2007, 3, e41 CrossRef PubMed.
- A. Muela, J. M. García-Bringas, I. Arana and I. Barcina, Microb. Ecol., 2000, 40, 336–344 CAS.
- Y. Chen, B. Wang, S. Lin, Y. Zhang and X. Wang, J. Phys. Chem. C, 2014, 118, 29981–29989 CrossRef CAS.
- C. Ye, J.-X. Li, Z.-J. Li, X.-B. Li, X.-B. Fan, L.-P. Zhang, B. Chen, C.-H. Tung and L.-Z. Wu, ACS Catal., 2015, 5, 6973–6979 CrossRef CAS.
- S. Yin, J. Han, T. Zhou and R. Xu, Catal. Sci. Technol., 2015, 5, 5048–5061 RSC.
- H. Huang, X. Li, J. Wang, F. Dong, P. K. Chu, T. Zhang and Y. Zhang, ACS Catal., 2015, 5, 4094–4103 CrossRef CAS.
- H. Huang, S. Tu, C. Zeng, T. Zhang, A. H. Reshak and Y. Zhang, Angew. Chem., Int. Ed., 2017, 56, 11860–11864 CrossRef CAS PubMed.
- H. Huang, Y. He, X. Li, M. Li, C. Zeng, F. Dong, X. Du, T. Zhang and Y. Zhang, J. Mater. Chem. A, 2015, 3, 24547–24556 RSC.
- H. Huang, A. H. Reshak, S. Auluck, S. Jin, N. Tian, Y. Guo and Y. Zhang, J. Phys. Chem. C, 2018, 122, 2661–2672 CrossRef CAS.
Footnote |
| † Electronic supplementary information (ESI) available. See DOI: 10.1039/c8ra06923a |
| This journal is © The Royal Society of Chemistry 2018 |

