DOI:
10.1039/C8RA06449K
(Paper)
RSC Adv., 2018,
8, 42145-42152
Ultrasonic-assisted enzymatic extraction of a water soluble polysaccharide from dragon fruit peel and its antioxidant activity
Received
31st July 2018
, Accepted 3rd December 2018
First published on 18th December 2018
Abstract
A novel water soluble polysaccharide from dragon fruit peel named DFPWSP-1 was isolated and purified and chemical analysis was performed. The results indicated that DFPWSP-1, with an average molecular weight of 2.98 × 10² kDa, mainly contained galacturonic acid, glucose and galactose. Then, a Box–Behnken design (BBD) was employed to optimize the ultrasonic-assisted enzymatic extraction (UAEE) of DFPWSP-1. The optimal extraction conditions for the maximum yield of DFPWSP-1 were a cellulase volume of 104 U, an enzymolysis time of 2.06 h, an ultrasonication power of 105 W and a ratio of solution to sample of 8.5 mL g−1. Under these conditions, the extraction yield of DFPWSP-1 was 20.28%. Furthermore, the polysaccharide DFPWSP-1 exhibited a significant scavenging activity of 2-diphenyl-picrylhydrazyl (DPPH) radical, superoxide anion and hydroxyl radical. DFPWSP-1 may be a potential natural antioxidant in the food industry.
1. Introduction
Dragon fruit (Pitaya) is a native plant that mainly exists in Mexico, Central and South America1 and is also widely found in China.2 Dragon fruit is abundant in edible nutrients and bioactive substances, such as plant polysaccharides,3 pectin4 and oligosaccharides.5 Previous works have reported that plant polysaccharides potentially possess antioxidant activity,6 anticarcinogenic activity7 and immunologic competence.8 A water soluble polysaccharide was purified from dragon fruit pulp and its structure was identified by NMR and GC-MS.9 However, there is no publication on water soluble polysaccharides from dragon fruit peel. It is difficult to isolate polysaccharides from dragon fruit peel because of its heavy red color.10
The extraction method is a key factor for isolation of plant polysaccharides. Hot water extraction is a traditional method for extraction of polysaccharide and the cause lies in its simplicity and safety of operation, but it is time-consuming and needs high energy.11 Therefore, various efficient extraction methods have been successfully developed for extraction of active components from plants, such as ultrasonic-assisted extraction (UAE) and enzymatic-assisted extraction (EAE).12 UAE can cause collapse of cavitation bubbles which contributes to elevating the extraction efficiency of target product of plant materials.13–16 EAE can also disrupt plant cells and cause hydrolysis of the cytoderm, and enhance the release of bioactive substance.13,16 To date, however, there has been no report on ultrasound-assisted extraction combined with enzymatic treatment for polysaccharides from dragon fruit peel. In addition, response surface methodology (RSM) has been applied commonly in optimizing the extraction parameters for plant polysaccharides.17–19
In the present study, a water soluble polysaccharide was purified from dragon fruit peel and the chemical analysis was studied. Then, RSM was used to optimize the ultrasonic-assisted enzymatic process (UAEE) for DFPWSP-1 extraction. Moreover, radical scavenging assays of DFPWSP-1 including scavenging activities of 2-diphenyl-picrylhydrazyl (DPPH) radical, superoxide anion and hydroxyl radical were also evaluated.
2. Materials and methods
2.1 Materials
Dragon fruit (Hylocereus undatus) was purchased from local supermarket in Bengbu city of China. The fresh fruits were washed with distilled water and thick skins were peeled off from the fruits manually. Then, the fresh fruits peels were dried at 60 °C and pulverized to an 60-mesh powder. All chemicals used in present study were purchased from Sinopharm Chemical Reagent Co., Ltd, China.
2.2 Extraction of polysaccharides
5.0 g of dried dragon fruit peel powder was defatted using 50 mL of petroleum ether for 12 h and mixed with 150 mL of distilled water evenly. Then, the pretreated samples were conducted with cellulase enzymolysis at 55 °C and extracted with ultrasonication treatment. The treated samples were centrifugated at 8000g for 10 min to collect the supernatant. 10 mL of 4% hydrogen peroxide was added to the supernatant and decolorized at 60 °C for 1.5 h. Then the decolourization solution was mixed with 50 mL of 95% ethanol and stirred vigorously. The precipitates were collected by centrifugation at 8000g for 10 min. Proteins of the precipitates were removed by Sevag method and then dialyzed with a 3500 Mw membrane at 4 °C overnight. The precipitates were collected by again centrifugation and lyophilized under vacuum to obtain crude polysaccharides.
2.3 Purification of DFPWSP-1
0.2 g of the crude polysaccharide was dissolved in 20 mL deionized water and the supernatant was collected by centrifugation at 8000g for 10 min. Then, the supernatant was added onto an anion-exchange DEAE cellulose column (2.6 cm × 50 cm) and eluted with different concentrations of NaCl solutions (0, 0.1, 0.2, 0.3, 0.4 and 0.5 mol L−1) at the flow rate of 3.0 mL min−1. The polysaccharide fraction was collected by elution with 0.1 mol L−1 NaCl solution and was further purified by gel-filtration (2.0 × 100 cm) on Sephadex G-100 column at a flow rate of 0.4 mL min−1 with deionized water as elution solvent. The main peak was concentrated and lyophilized to obtain the pure polysaccharide named DFPWSP-1.
2.4 Analysis of DFPWSP-1
2.4.1 Properties of DFPWSP-1. The total carbohydrate content of DFPWSP-1 was analyzed using the phenol–sulfuric acid method with D-glucose as the standard.20 The protein content was measured using the Bradford assay.21 The uronic acid was evaluated by the carbazole method using the galacturonic acid as standard.22
2.4.2 Determination of molecular weight. The molecular weight of DFPWSP-1 was assayed by gel permeation chromatography (GPC) equipped with a refractive index detector (RID) and a gel-filtration chromatographic column of TSK-GEL G3000Wxl (7.5 mm × 300 mm). 2.0 mg of DFPWSP-1 was dissolved with 0.2 mol L−1 Na2SO4 solution. 20 μL of the sample was injected and eluted with 0.2 mol L−1 Na2SO4 solution at a flow rate of 0.8 mL min−1 at 35 °C. The molecular mass was calculated with dextran as the standard.
2.4.3 Analysis of monosaccharide composition. The monosaccharide composition of the polysaccharide DFPWSP-1 was determined according to the method reported previously.23 Briefly, 10 mg sample was hydrolyzed with 3.0 mL 2.0 mol L−1 trifluoroacetic acid (TFA) solution at 110 °C for 4 h, The chemical compositions of DFPWSP-1 was assayed on HPLC system (Agilent 1200, USA) using a refractive index detector at 30 °C. The elution conditions were performed as described by the previous procedure.23
2.5 FT-IR analysis
Fourier transform-infrared (FT-IR) of the polysaccharide DFPWSP-1 was analyzed using the previous method.24 Briefly, the sample was mixed into potassium bromide (KBr) powder and made into 1.0 mm pellet. FT-IR spectra were recorded on a Bruker Vector 22 instrument (Agilent, USA) at the absorbance from 4000 to 400 cm−1.
2.6 Experimental design
2.6.1 Single-factor experiment. Single factor experiments were performed to investigate the effects of the cellulase volume (50, 75, 100, 125 and 150 U), the enzymolysis time (1.0, 1.5, 2.0, 2.5 and 3.0 h), the ultrasonication power (60, 80, 100, 120 and 140 W) and the ratio of solution to sample (4, 6, 8, 10, and 12 mL g−1) on the yield of DFPWSP-1. One factor changed while the other factors were kept constant in each experiment. The yield of DFPWSP-1 was calculated as follow,
| Yield of DFPWSP-1 (%) = m/M, |
where m was the weight of the dried DFPWSP-1 and M was the weight of the dried dragon fruit peel powder.
2.6.2 Box–Behnken Design. Based on single factor experiments, a Box–Behnken Design (BBD) was used to further optimize the conditions for polysaccharide extraction. The cellulase volume, the enzymolysis time, the ultrasonication power and the ratio of solution to sample were chosen as four independent variables and designated as X1, X2, X3 and X4, respectively. The yield of DFPWSP-1 (Y) was taken as the response (Y). A multiple quadratic model was used to analyze the effects of three independent variables on the DFPWSP yield using the following equation,
| Y = α0 + α1X1 + α2X2 + α3X3 + α4X4 + α11X12 + α22X22 + α33X32 + α44X42 + α12X1X2 + α13X1X3 + α14X1X4 + α23X2X3 + α24X2X4 + α34X3X4 |
where Y was the response variable; α0 were the intercept; α1, α2, α3 and α4 were linear coefficients; α11, α22, α33 and α44 were square coefficients, α12, α12, α13, α14, α23, α24 and α34 were interactive coefficients; X1, X2, X3 and X4 were the independent variables.
2.7 Radical scavenging assays
2.7.1 DPPH radical scavenging activity. 2-Diphenyl-picrylhydrazyl (DPPH) radical scavenging activity of DFPWSP-1 was determined using the method as described previously.25 0.2 mL of fresh DPPH radical solution (0.3 mmol L−1 in methanol) was mixed to 1.0 mL of the DFPWSP-1 solution. The mixture was then incubated at 25 °C in the dark for 30 min. The absorbance was measured at 517 nm and DPPH radical scavenging activity was calculated as,
where A0 was the absorbance of the control (DPPH radical solution instead of the DFPWSP-1 solution), and A1 was the absorbance of the samples.
2.7.2 Hydroxyl radical scavenging activity. The hydroxyl radical scavenging activity was investigated according to the previous method,26 with slight modifications. Briefly, 0.5 mL of 1.5 mmol L−1 FeSO4, 0.35 mL of 6.0 mmol L−1 H2O2 and 0.15 mL of 20 mmol L−1 sodium salicylate were added to 1.0 mL of DFPWSP-1 sample and shaken at 37 °C for 1 h. The absorbance at 562 nm was measured and hydroxyl radical scavenging activity was calculated as follow,
where A0 was the absorbance of the control (distilled water instead of the DFPWSP-1 solution), and A1 was the absorbance of the samples.
2.7.3 Superoxide anion scavenging activity. The superoxide anion scavenging activity was assayed according to the previous method.27 1.0 mL of DFPWSP-1 solution was mixed with 3.0 mL of reaction solution including 0.1 mmol L−1 nitroblue tetrazolium (NBT) solution, 0.4 mmol L−1 nicotinamide adenine dinucleotide-reduced (NADH), and 0.04 mmol L−1 phenazine methosulfate (PMS), and incubated at 25 °C for 5 min. The absorbance at 560 nm was measured and superoxide radical scavenging activity was calculated as follow,
where A0 was the absorbance of the control (distilled water instead of the DFPWSP-1 solution), and A1 was the absorbance of the samples.
2.8 Statistical analysis
All experiments were carried out in triplicate. The results were analyzed using SPSS 20.0 (SPSS, IBM, USA) and expressed as mean ± SD. One-way analysis of variance was performed to determine the statistical difference. Statistical significance was evaluated by Duncan's test. Differences at P < 0.05 or P < 0.01 were considered to be significant.
3. Results and discussion
3.1 Chemical analysis of the purified polysaccharide DFPWSP-1
3.1.1 Properties of DFPWSP-1. The phenol–sulfuric acid analysis showed that total carbohydrate content in DFPWSP-1 was 98.07% and the content of galacturonic acid was 40.57%. However, no protein was detected.
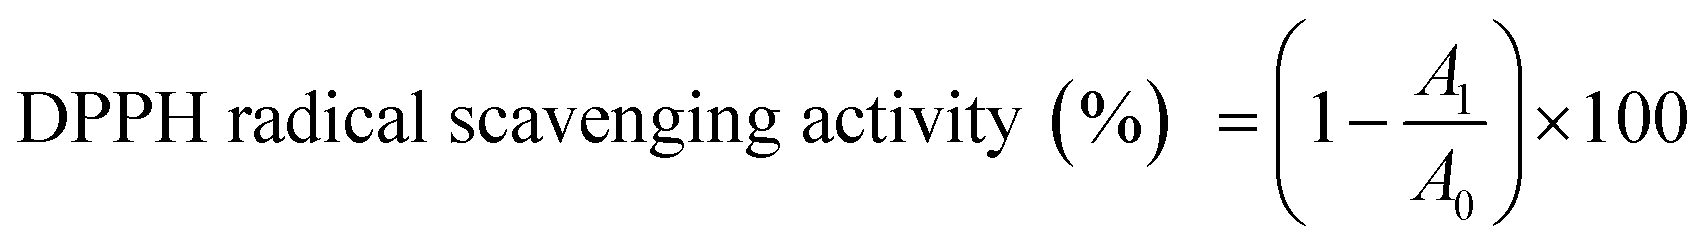
3.1.2 The molecular weight of DFPWSP-1. GPC analysis (Fig. 1) showed that there was one peak between 15 and 20 min, which indicated that the purity of DFPWSP-1 extracted from dragon fruit peel. The molecular weight of DFPWSP was determined to be 2.98 × 10² kDa, with a large dispersity (D = 3.78).
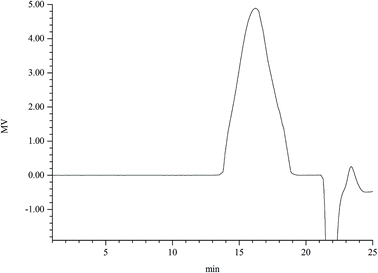 |
| | Fig. 1 GPC chromatogram of the polysaccharide DFPWSP-1. The molecular weight was calculated with GPC software. | |
3.1.3 Analysis of monosaccharide composition. The monosaccharide compositions of the polysaccharide DFPWSP-1 were determined and the results were presented in Table 1. It was observed that the polysaccharide DFPWSP-1 consisted of six kinds of monosaccharides, including glucose, fructose, arabinose, xylose, galactose and rhamnose. The content of glucose and galactose were higher than that of other monosaccharides, indicating that glucose and galactose were the main constituents of the backbone of DFPWSP-1. Previous publication4 reported that the dragon fruit peel pectin comprised of mannose, rhamnose, glucose, galactose, xylose and arabinose. Mannose, rhamnose, glucose and galactose were the leading monosaccharides of the dragon fruit peel pectin. The monosaccharide composition of a water-soluble polysaccharide purified from dragon fruit pulp was measured to be arabinose, galactose and rhamnose3 and galactose was its main monosaccharide. These results suggested that polysaccharides extracted from dragon fruit pulp and dragon fruit peel contained different monosaccharide compositions.
Table 1 Monosaccharide composition of the polysaccharide DFPWSP-1. All experiments were performed in triplicated and the data were expressed as mean ± SD. One-way analysis of variance was performed to evaluate the statistical difference
| Monosaccharide |
Composition (%) |
| Glucose |
12.53 ± 0.25 |
| Fructose |
3.57 ± 0.06 |
| Arabinose |
4.26 ± 0.0.09 |
| Xylose |
1.79 ± 0.05 |
| Galactose |
11.47 ± 0.21 |
| Rhamnose |
9.24 ± 0.18 |
3.2 IR analysis
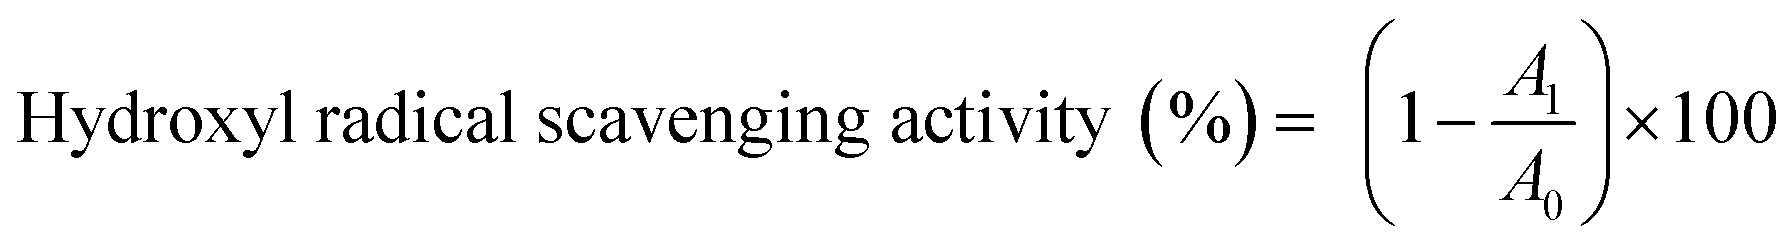
The FT-IR spectra of DFPWSP-1 were depicted in Fig. 2. The strong band at 3422.88 cm−1 was attributed to the –OH stretching vibration, which was indicative of interactions of the polysaccharides chains. The band at 2921.72 cm−1 was due to C–H stretching and bending vibration. The absorption bands at 1635.2 cm−1, associating with ester carbonyl and carboxyl groups, suggested the possible presence of uronic acid in polysaccharides. The absorption peak at 1468.10 and 1416.9 cm−1 were attributed to the deforming vibration of the C–H bond. The absorption bands at 1093.22 and 1043.84 cm−1 suggested the presence of C![[double bond, length as m-dash]](https://www.rsc.org/images/entities/char_e001.gif) O and C–C bonds. Moreover, the characteristic absorption bands at 1241.98, 1093.22 and 897.12 cm−1 indicated that the sugar units existed in DFPWSP-1. In addition, the strong extensive absorption peaks in the region of 1000–1200 cm−1 could be caused by the stretching vibrations of C–O–H side groups and the C–O–C glycosidic band vibrations. Overall, these results evidenced that DFPWSP-1 possessed the typical absorption peaks of polysaccharides.
O and C–C bonds. Moreover, the characteristic absorption bands at 1241.98, 1093.22 and 897.12 cm−1 indicated that the sugar units existed in DFPWSP-1. In addition, the strong extensive absorption peaks in the region of 1000–1200 cm−1 could be caused by the stretching vibrations of C–O–H side groups and the C–O–C glycosidic band vibrations. Overall, these results evidenced that DFPWSP-1 possessed the typical absorption peaks of polysaccharides.
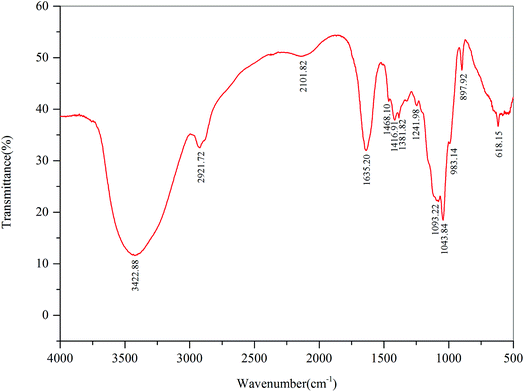 |
| | Fig. 2 FT-IR spectra of the polysaccharide DFPWSP-1. | |
3.3 Effects of enzymolysis-ultrasonic assisted extraction conditions on the yield of DFPWSP-1
3.3.1 Cellulase volume. The effect of cellulase volume on DFPWSP-1 extraction was investigated and the results were shown in Fig. 3A. The yield of DFPWSP-1 increased with the increase of the cellulase volume. The yield of DFPWSP-1 reached the maximum value when the cellulase volume was 100 U. However, the further increase of the cellulase volume had no significant effect on the yield of DFPWSP-1. Therefore, the cellulase volume of 100 U was chosen as the optimum dosage for DFPWSP-1 extraction.
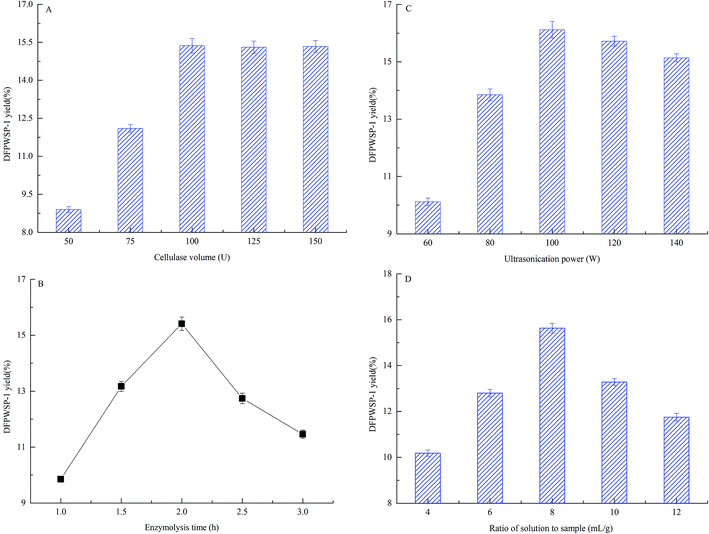 |
| | Fig. 3 Effects of enzymolysis-ultrasonic assisted extraction conditions on the yield of DFPWSP-1. (A) Cellulase volume; (B) enzymolysis time; (C) ultrasonication power; (D) ratio of solution to sample. All experiments were performed in triplicated and the data were expressed as mean ± SD. One-way analysis of variance was performed to evaluate the statistical difference. Statistical significance was evaluated by Duncan's test. Differences at P < 0.05 or P < 0.01 were considered to be significant. | |
3.3.2 Enzymolysis time. As shown in Fig. 3B, the DFPWSP-1 yield had an obvious increase with the increase of the enzymolysis time from 1.0 to 2.0 h, indicating that properly prolonging the enzymolysis time could be helpful for DFPWSP-1 extraction. However, when the enzymolysis time was over 2.0 h, the DFPWSP-1 yield decreased. Thus, the enzymolysis time of 2.0 h was chosen as the preferred level for DFPWSP-1 extraction.
3.3.3 Ultrasonication power. The effect of ultrasonication power on the yield of DFPWSP-1 was shown in Fig. 3C. The yield of DFPWSP-1 increased significantly as the ultrasonication power increased from 60 to 100 W. However, the yield of DFPWSP-1 decreased when the ultrasonication power was over 100 W. Therefore, the ultrasonication power of 100 W was selected for further study.
3.3.4 Ratio of solution to sample. The effect of ratio of solution to sample on the yield of DFPWSP-1 were shown in Fig. 3D. When the ratio of solution to sample increased, the DFPWSP-1 yield enhanced and reached a peak value at 8.0 mL g−1. Therefore, 8 mL g−1 was selected as the optimum level for DFPWSP-1 extraction.
3.4 Optimization of DFPWSP-1 extraction
3.4.1 Statistical analysis of the model. A 29-run Box–Behnken design (BBD) was taken to optimize the conditions for DFPWSP-1 extraction. Four independent variables of the cellulase volume (X1, U), the enzymolysis time (X2, h), the ultrasonication power (X3, W) and the ratio of solution to sample (X4, mL g−1) were selected and the corresponding results were listed in Table 2, with the DFPWSP-1 yield (Y) as a response. The analysis of variance and the adequacy of the regression model were summarized in Table 3. The results indicated that the response variable and the four independent variables followed the second-order polynomial equation:
| Y = −51.50 + 0.49X1 + 17.40X2 + 0.21X3 + 3.64X4 + 4.20 × 10−3X1X2 + 1.35 × 10−4X1X3 + 1.45 × 10−3X1X4 − 2.75 × 10−3X2X3 + 0.76X2X4 + 6.88 × 10−3X3X4 − 2.45 × 10−3X12 − 5.82X22 − 1.20 × 10−4X32 − 0.36X42 |
Table 2 Box–Behnken design and results of the experimental values and predicted values for the DFPWSP-1 yield
| Standard run |
Cellulase volume (X1, U) |
Enzymolysis time (X2, h) |
Ultrasonication power (X3, W) |
Ratio of solution to sample (X4, mL g−1) |
DFPWSP-1 yield (Y) (%) |
| Actual |
Predicted |
| 1 |
−1 (75) |
−1 (1.5) |
0 (100) |
0 (8) |
16.21 |
16.26 |
| 2 |
1 (125) |
−1 (1.5) |
0 (100) |
0 (8) |
17.51 |
17.59 |
| 3 |
−1 (75) |
1 (2.5) |
0 (100) |
0 (8) |
16.53 |
16.48 |
| 4 |
1 (125) |
1 (2.5) |
0 (100) |
0 (8) |
18.04 |
18.02 |
| 5 |
0 (100) |
0 (2) |
−1 (80) |
−1 (6) |
17.12 |
17.16 |
| 6 |
0 (100) |
0 (2) |
1 (120) |
−1 (6) |
18.28 |
18.01 |
| 7 |
0 (100) |
0 (2) |
−1 (80) |
1 (10) |
17.48 |
17.78 |
| 8 |
0 (100) |
0 (2) |
1 (120) |
1 (10) |
19.74 |
19.74 |
| 9 |
−1 (75) |
0 (2) |
0 (100) |
−1 (6) |
15.76 |
15.89 |
| 10 |
1 (125) |
0 (2) |
0 (100) |
−1 (6) |
17.12 |
17.18 |
| 11 |
−1 (75) |
0 (2) |
0 (100) |
1 (10) |
16.83 |
16.92 |
| 12 |
1 (125) |
0 (2) |
0 (100) |
1 (10) |
18.48 |
18.50 |
| 13 |
0 (100) |
−1 (1.5) |
−1 (80) |
0 (8) |
17.51 |
17.25 |
| 14 |
0 (100) |
1 (2.5) |
−1 (80) |
0 (8) |
17.37 |
17.63 |
| 15 |
0 (100) |
−1 (1.5) |
1 (120) |
0 (8) |
18.82 |
18.71 |
| 16 |
0 (100) |
1 (2.5) |
1 (120) |
0 (8) |
18.57 |
18.98 |
| 17 |
−1 (75) |
0 (2) |
−1 (80) |
0 (8) |
16.90 |
16.71 |
| 18 |
1 (125) |
0 (2) |
−1 (80) |
0 (8) |
18.16 |
18.01 |
| 19 |
−1 (75) |
0 (2) |
1 (120) |
0 (8) |
18.01 |
17.98 |
| 20 |
1 (125) |
0 (2) |
1 (120) |
0 (8) |
19.54 |
19.55 |
| 21 |
0 (100) |
−1 (1.5) |
0 (100) |
−1 (6) |
16.97 |
17.20 |
| 22 |
0 (100) |
1 (2.5) |
0 (100) |
−1 (6) |
16.21 |
16.02 |
| 23 |
0 (100) |
−1 (1.5) |
0 (100) |
1 (10) |
16.86 |
16.87 |
| 24 |
0 (100) |
1 (2.5) |
0 (100) |
1 (10) |
19.12 |
18.71 |
| 25 |
0 (100) |
0 (2) |
0 (100) |
0 (8) |
20.24 |
20.08 |
| 26 |
0 (100) |
0 (2) |
0 (100) |
0 (8) |
19.85 |
20.08 |
| 27 |
0 (100) |
0 (2) |
0 (100) |
0 (8) |
20.23 |
20.08 |
| 28 |
0 (100) |
0 (2) |
0 (100) |
0 (8) |
19.85 |
20.08 |
| 29 |
0 (100) |
0 (2) |
0 (100) |
0 (8) |
20.21 |
20.08 |
Table 3 ANOVA for response surface quadratic model of the yield of DFPWSP-1a
| Source |
Sum of squares |
df |
Mean square |
F-value |
P-value |
| ** Significant (P < 0.05). |
| Model |
49.84 |
14 |
3.56 |
49.17 |
<0.0001** |
| X1 |
6.18 |
1 |
6.18 |
85.34 |
<0.0001** |
| X2 |
0.32 |
1 |
0.32 |
4.42 |
0.0540 |
| X3 |
5.91 |
1 |
5.91 |
81.61 |
<0.0001** |
| X4 |
4.14 |
1 |
4.14 |
57.22 |
<0.0001** |
| X1X2 |
0.011 |
1 |
0.011 |
0.15 |
0.7022 |
| X1X3 |
0.018 |
1 |
0.018 |
0.25 |
0.6236 |
| X1X4 |
0.021 |
1 |
0.021 |
0.29 |
0.5984 |
| X2X3 |
3.025 × 10⁻³ |
1 |
3.025 × 10⁻³ |
0.042 |
0.8410 |
| X2X4 |
2.28 |
1 |
2.28 |
31.50 |
<0.0001** |
| X3X4 |
0.30 |
1 |
0.30 |
4.18 |
0.0602 |
| X12 |
15.24 |
1 |
15.24 |
210.46 |
<0.0001** |
| X22 |
13.71 |
1 |
13.71 |
189.39 |
<0.0001** |
| X32 |
1.50 |
1 |
1.50 |
20.76 |
0.0004** |
| X42 |
13.13 |
1 |
13.13 |
181.34 |
<0.0001** |
| Residual |
1.01 |
14 |
0.072 |
|
|
| Lack of fit |
0.84 |
10 |
0.084 |
1.97 |
0.2675 |
| Pure error |
0.17 |
4 |
0.043 |
|
|
| Cor total |
50.85 |
28 |
|
|
|
| R2 |
0.9801 |
|
|
|
|
| RAdj2 |
0.9601 |
|
|
|
|
| C.V.% |
1.49 |
|
|
|
|
The P-value of the model was smaller than 0.01, meaning that the model was highly statistically significant. The P-value of the lack of fit was 0.2675, which confirmed the goodness-of-fit and the suitability of regression model. The determination coefficient (R2 = 0.9801) and the adjusted determination coefficient (RAdj2 = 0.9601) indicated that the predicted values was found to fit the observed values well. The coefficient variation value of 1.49 revealed that experimental value of regression model was dependable. Table 3 also demonstrated that the linear coefficients (X1, X3 and X4), the quadratic term coefficients (X12, X22 and X42) and the cross product coefficient (X2X4) were significant (P < 0.01). These results showed that the predicted model could be efficiently used to predict the yield of DFPWSP-1.
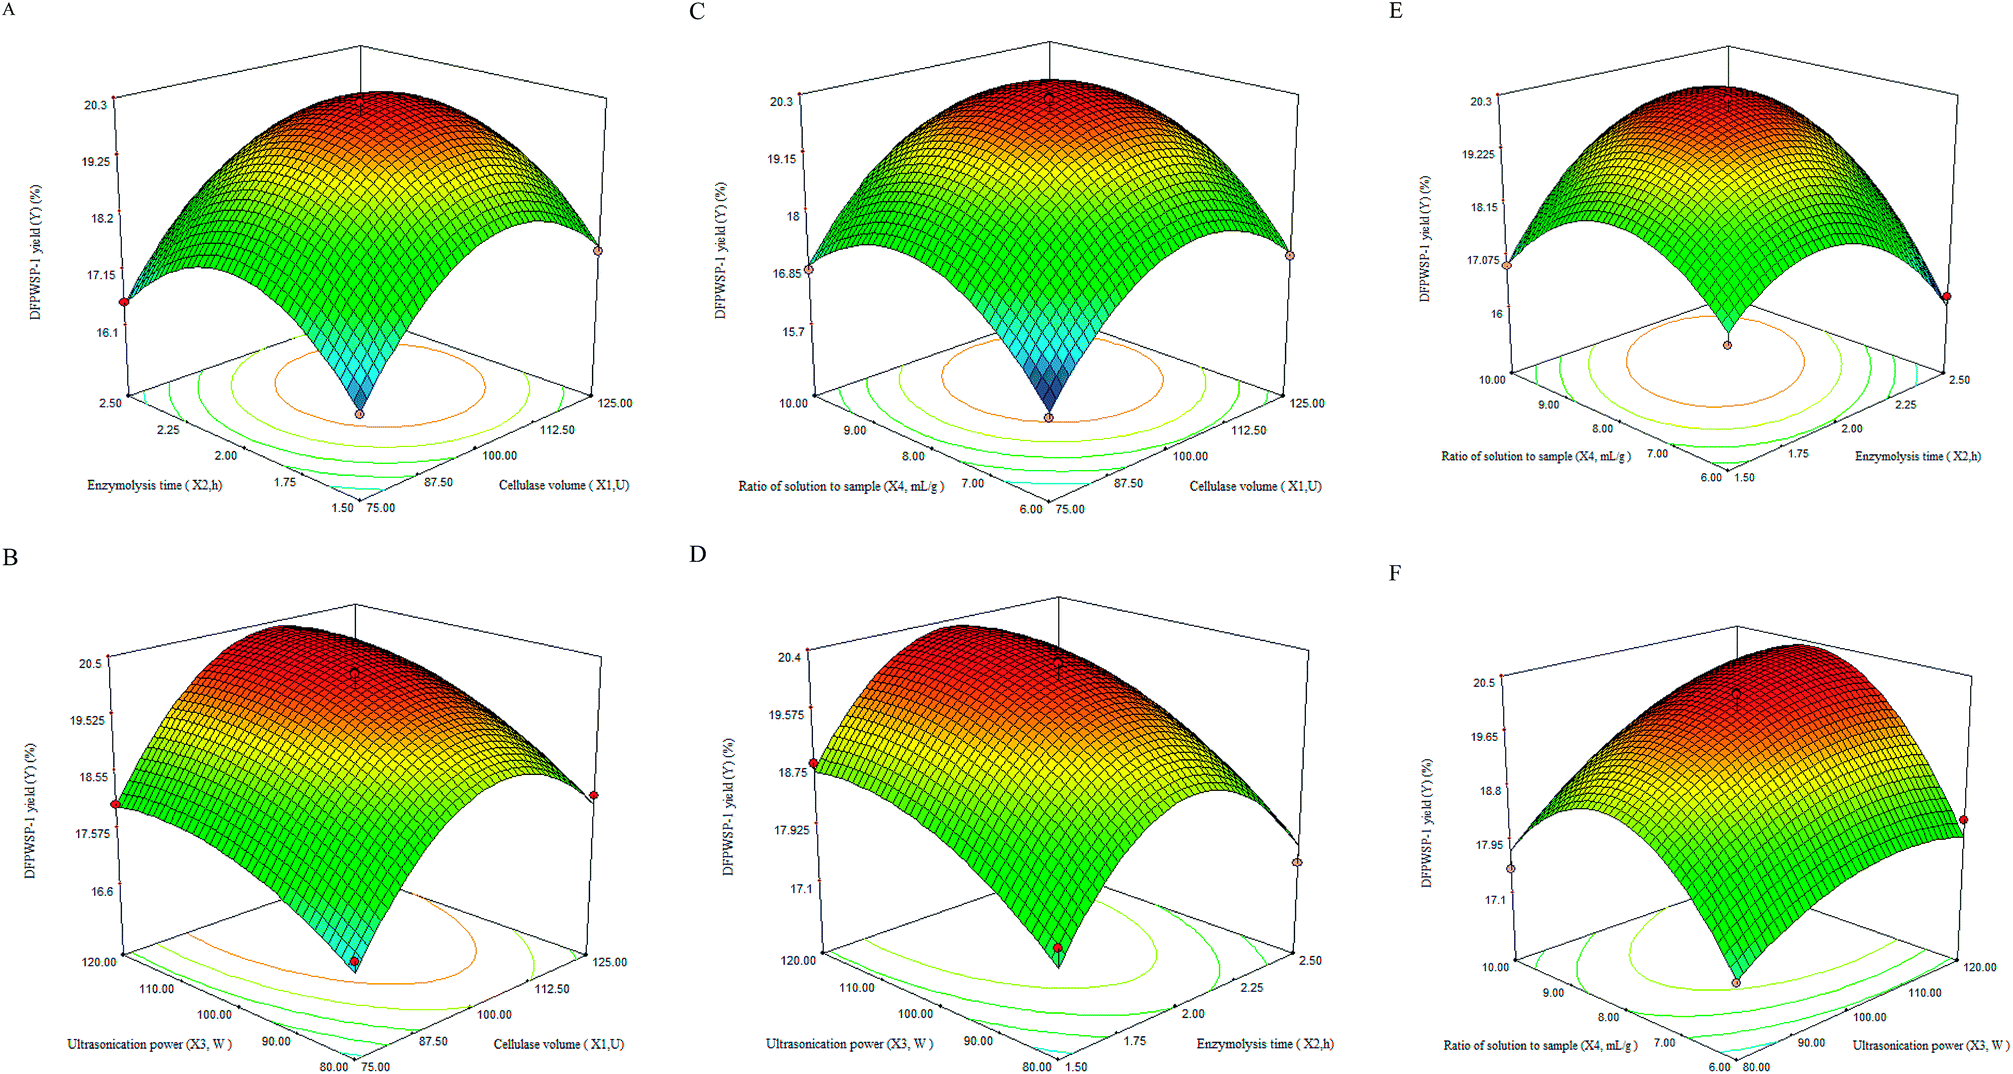
3.4.2 Response surfaces analysis. To describe the relationships between the independent and dependent variables, the 3D response surfaces were portrayed and the results were shown in Fig. 4. While the other two variables were fixed at zero level, the interactive effect of two variables of the cellulase volume (X1), the enzymolysis time (X2), the ultrasonication power (X3) and the ratio of solution to sample (X4) on the yield of DFPWSP-1 were presented. As shown in Fig. 4, the predicted optimal conditions for DFPWSP-1 extraction were obtained. The predicted optimal values were modified slightly because of being unmanageable to control extraction conditions in actual experiments. The practical optimal extraction parameters were adjusted as follow: the cellulase volume of 104 U, the enzymolysis time of 2.06 h, the ultrasonication power of 105 W and the ratio of solution to sample of 8.5 mL g−1. Under these conditions, the experimental yield of DFPWSP-1 was observed to be 20.28 ± 0.45% (n = 3), which was agreed closely with the predicted value (20.39%). These results confirmed that the response model was accurate and valid for the optimal EUAE conditions for DFPWSP-1 extraction.
 |
| | Fig. 4 Response-surface plots and contour plots of enzymolysis-ultrasonic assisted extraction conditions on the DFPWSP-1 yield. (A) Interactive effects between cellulase volume (X1) and enzymolysis time (X2); (B) interactive effects between cellulase volume (X1) and ultrasonication power (X3); (C) interactive effects between cellulase volume (X1) and ratio of solution to sample (X4); (D) interactive effects between enzymolysis time (X2) and ultrasonication power (X3); (E) interactive effects between enzymolysis time (X2) and ratio of solution to sample (X4); (F) interactive effects between ultrasonication power (X3) and ratio of solution to sample (X4). All experiments were performed in triplicated and the data were expressed as mean ± SD. Statistical significance was evaluated by Duncan's test. Differences at P < 0.05 or P < 0.01 were considered to be significant. | |
3.5 Radical scavenging assays
3.5.1 DPPH radical scavenging activity. DPPH radical has been typically used as a tool for evaluating the free radical scavenging activities of antioxidants. As depicted in Fig. 5A, the polysaccharide DFPWSP-1 indicated the dose-dependent DPPH radical scavenging effects. When the DFPWSP-1 concentration ranged from 1.0 to 5.0 mg mL−1, the DPPH radical inhibition effects increased obviously. The DPPH radical scavenging activity was up to 70.17% at 5 mg mL−1 of DFPWSP-1, indicating that DFPWSP-1 exhibited a good DPPH radical scavenging activity. The previous paper reported that the antioxidant activity of polysaccharides correlated with uronic acid content and molecular weight.3 High uronic acid content and large molecular weight of DFPWSP-1 might contribute to high DPPH radical scavenging activity.
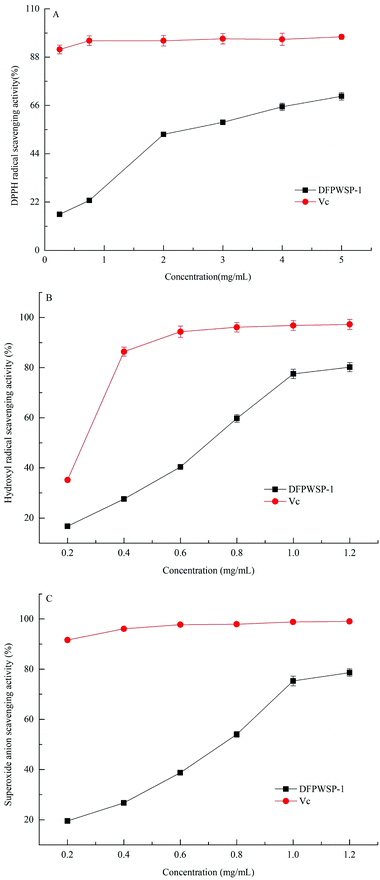 |
| | Fig. 5 Radical scavenging assays of the polysaccharide DFPWSP-1. (A) DPPH radical scavenging activity; (B) hydroxyl radical scavenging activity; (C) superoxide anion radical scavenging activity. All experiments were performed in triplicated and the data were expressed as mean ± SD. One-way analysis of variance was performed to evaluate the statistical difference. Statistical significance was evaluated by Duncan's test. Differences at P < 0.05 or P < 0.01 were considered to be significant. | |
3.5.2 Hydroxyl radical scavenging activity. Hydroxyl radical can cause cancer, mutagenesis and cytotoxicity through breaking cell membranes, and damaging DNA or proteins. Hydroxyl radical scavenging activity plays an important role in protecting living cells.28 Fig. 5B indicated a positive hydroxyl radical scavenging effect correlated with the increasing concentration of DFPWSP-1. The hydroxyl radical scavenging activity increased significantly, when the concentration of DFPWSP-1 ranged from 0.2 to 1.0 mg mL−1. The hydroxyl radical scavenging activity reached a peak value of 80.52% at 1.2 mg mL−1 of DFPWSP-1, demonstrating that DFPWSP-1 had a remarkable ability to scavenge hydroxyl radicals. Active hydroxyl groups in polysaccharide were beneficial to produce high antioxidant activity.29 A number of hydroxyl groups contained in DFPWSP-1 caused high scavenging hydroxyl radical activity.
3.5.3 Superoxide anion scavenging activity. Fig. 5C indicated that the polysaccharide DFPWSP-1 exhibited obviously superoxide anion scavenging activity. When at 1.2 mg mL−1 of DFPWSP-1, the superoxide anion scavenging activity was 78.61%. Superoxide anion scavenging activity was potentially viewed as an important indicator of antioxidants.30 The previous report revealed that the superoxide anion scavenging activity might be closely related to carboxylic groups and uronic acid content in polysaccharide.31 High superoxide anion scavenging activity might be attributed to carboxylic groups and high uronic acid content of DFPWSP-1.
4. Conclusions
In the present study, a novel water soluble polysaccharide named DFPWSP-1 was purified from dragon fruit peel. The chemical analysis showed that DFPWSP-1, with an average molecular weight of 2.98 × 10² kDa, mainly contained galacturonic acid, glucose and galactose. FTIR spectrum revealed that DFPWSP-1 had the characteristic absorption bands of polysaccharides. The response surface methodology (RSM) was successfully used for optimizing the ultrasonic-assisted enzymatic extraction (UAEE) of DFPWSP-1. The optimum conditions were determined to be the cellulase volume of 104 U, the enzymolysis time of 2.06 h, the ultrasonication power of 105 W and the ratio of solution to sample of 8.5 mL g−1 and 20.28% of DFPWSP-1 was obtained. Moreover, DFPWSP-1 exhibited significant scavenging activities for 2-diphenyl-picrylhydrazyl (DPPH) radical, hydroxyl radical and superoxide anion. Potentially, DFPWSP-1 can be used a nature antioxidant in food industry.
Conflicts of interest
There are no conflicts of interest to declare.
Acknowledgements
This work was financially supported by the National Natural Science Foundation of China (No. 31571887) and Young Talents Project for Jiangsu Collaborative Innovation Center of Regional Modern Agriculture and Environmental Protection (HSXT2-312).
References
- A. Nerd and Y. Mizrahi, Hortic. Rev., 1997, 18, 321–346 Search PubMed.
- L. C. Wu, H. W. Hsu, Y. C. Chen, C. C. Chiu, Y. I. Lin and J. A. Ho, Food Chem., 2006, 95, 319–327 CrossRef CAS.
- L. Xu, Y. Zhang and L. Wang, Carbohydr. Polym., 2016, 146, 224–230 CrossRef CAS PubMed.
- K. Muhammad, N. I. M. Zahari, S. P. Gannasin, N. M. Adzahan and J. Bakar, Food Hydrocolloids, 2014, 42, 289–297 CrossRef CAS.
- S. Wichienchot, M. Jatupornpipat and R. A. Rastall, Food Chem., 2010, 120, 850–857 CrossRef CAS.
- A. Raza, F. Li, X. Xu and J. Tang, Int. J. Biol. Macromol., 2017, 94, 335–344 CrossRef CAS PubMed.
- X. Jia, C. Zhang, J. Qiu, L. Wang, J. Bao, K. Wang, Y. Zhang, M. Chen, J. Wan and H. Su, Carbohydr. Polym., 2015, 132, 67–71 CrossRef CAS PubMed.
- E. Wang, X. Chen, K. Wang, J. Wang, D. Chen, Y. Geng, W. Lai and X. Wei, Fish Shellfish Immunol., 2016, 59, 196–202 CrossRef CAS PubMed.
- Y. Xu, L. Zhang, Y. Yang, X. Song and Z. Yu, Carbohydr. Polym., 2015, 117, 895–902 CrossRef CAS PubMed.
- K. Kishore, Sci. Hortic., 2016, 213, 294–302 CrossRef.
- H. Wu, J. Zhu, W. Diao and C. Wang, Carbohydr. Polym., 2014, 113, 314–324 CrossRef CAS PubMed.
- N. Liao, J. Zhong, X. Ye, S. Lu, W. Wang, R. Zhang, J. Xu, S. Chen and D. Liu, LWT--Food Sci. Technol., 2015, 60, 1113–1121 CrossRef CAS.
- H. Chen, X. Zhou and J. Zhang, Carbohydr. Polym., 2014, 111, 567–575 CrossRef CAS PubMed.
- A. Hematian Sourki, A. Koocheki and M. Elahi, Int. J. Biol. Macromol., 2017, 95, 462–475 CrossRef CAS PubMed.
- J. Hu, X. Jia, X. Fang, P. Li, C. He and M. Chen, Int. J. Biol. Macromol., 2016, 85, 277–284 CrossRef CAS PubMed.
- S. Varakumar, K. V. Umesh and R. S. Singhal, Food Chem., 2017, 216, 27–36 CrossRef CAS PubMed.
- C. Chen, Y. Shao, Y. Tao and H. Wen, LWT--Food Sci. Technol., 2015, 64, 1263–1269 CrossRef CAS.
- S. Tahmouzi, Carbohydr. Polym., 2014, 106, 238–246 CrossRef CAS PubMed.
- L. Zhang and M. Wang, Int. J. Biol. Macromol., 2017, 95, 675–681 CrossRef CAS PubMed.
- M. Dubois, K. A. Gilles, J. K. Hamilton, P. A. T. Rebers and F. Smith, Anal. Chem., 1956, 28, 350–356 CrossRef CAS.
- M. M. Bradford, Anal. Biochem., 1976, 72, 248–254 CrossRef CAS PubMed.
- T. Bitter and H. M. Muir, Anal. Biochem., 1962, 4, 330–334 CrossRef CAS PubMed.
- X. Li and W. Lu, Int. J. Biol. Macromol., 2016, 83, 270–276 CrossRef CAS PubMed.
- D. Y. Zhang, Y. Wan, J. Y. Xu, G. H. Wu, L. Li and X. H. Yao, Carbohydr. Polym., 2016, 137, 473–479 CrossRef CAS PubMed.
- Q. Han, Z. Wu, B. Huang, L. Sun, C. Ding, S. Yuan, Z. Zhang, Y. Chen, C. Hu, L. Zhou, J. Liu, Y. Huang, J. Liao and M. Yuan, Int. J. Biol. Macromol., 2016, 92, 116–124 CrossRef CAS PubMed.
- B. Zeng, M. Su, Q. Chen, Q. Chang, W. Wang and H. Li, Carbohydr. Polym., 2016, 153, 391–398 CrossRef CAS PubMed.
- Z. Ye, W. Wang, Q. Yuan, H. Ye, Y. Sun, H. Zhang and X. Zeng, Carbohydr. Polym., 2016, 147, 354–364 CrossRef CAS PubMed.
- Y. Liu, M. Qiang, Z. Sun and Y. Du, Int. J. Biol. Macromol., 2015, 80, 350–357 CrossRef CAS PubMed.
- T. Baran and A. Menteş, Int. J. Biol. Macromol., 2015, 72, 94–103 CrossRef CAS PubMed.
- M. F. Barroso, N. De-Los-Santos-Álvarez, M. J. Lobo-Castañón, A. J. Miranda-Ordieres, C. Delerue-Matos, M. B. P. P. Oliveira and P. Tuñón-Blanco, J. Electroanal. Chem., 2011, 659, 43–49 CrossRef CAS.
- X. Zhou, S. Feng, S. Shen, H. Wang, Y. Ming, L. Jing, H. Yan and C. Ding, Carbohydr. Polym., 2016, 144, 122–130 CrossRef PubMed.
Footnote |
| † These authors contributed equally to this work. |
|
| This journal is © The Royal Society of Chemistry 2018 |
Click here to see how this site uses Cookies. View our privacy policy here. 
 Open Access Article
 This Open Access Article is licensed under a Creative Commons Attribution-Non Commercial 3.0 Unported Licence
 a,
Xiaohui Fang†b,
Demiao Dan†c,
Enjie Diaoa and
Zhaoxin Lud
a,
Xiaohui Fang†b,
Demiao Dan†c,
Enjie Diaoa and
Zhaoxin Lud