 Open Access Article
Template-free synthesis of three dimensional porous boron nitride nanosheets for efficient water cleaning†
Jie Li*ab,
Shi Hea,
Rui Liab,
Wei Daiab,
Junhui Taoab,
Chuanhui Wangab,
Junyi Liub,
Tian Wu *ab and
Chengchun Tang
 c
c
aSchool of Physics and Mechanical & Electronical Engineering, Institute for Functional Materials, Hubei University of Education, Wuhan 430205, P. R. China. E-mail: lijie@hue.edu.cn; twu@whu.edu.cn; Fax: +86-27-87943673; Tel: +86-27-87943673
bInstitute of Materials Research and Engineering, Hubei University of Education, Wuhan 430205, P. R. China
cSchool of Materials Science and Engineering, Hebei University of Technology, Tianjin 300130, People's Republic of China
First published on 24th September 2018
Abstract
Preparation of efficient and reusable adsorption materials for water treatment and purification is still remarkably challenging. In this paper, three dimensional porous boron nitride nanosheets (3D porous BNNSs) with high chemical stability and excellent adsorption capacity for organic dyes have been successfully synthesized through a template-free route. The 3D porous BNNSs consist of uniform nanosheets with average diameter of about 200 nm and thickness of about 3 nm. The adsorption conditions have been optimized by varying the experimental parameters such as initial dye concentration, solution pH, contact time, etc. As expected, the 3D porous BNNSs exhibit superior adsorption activity toward methylene blue (MB) in aqueous solution: more than 95.3% of the dye can be removed within 5 min compared with the adsorption efficiency of 10% for conventional activated carbon and 67.5% for the 3D porous BNNSs reported previously at pH 8.0 and 30 °C. The unique 3D structure and high density adsorption sites are believed to play a key role in the efficient removal performance. Moreover, about 94.5% of the starting adsorption capacity is maintained after ten adsorption–regeneration cycles. With the high adsorption efficiency and reusability performance, the 3D porous BNNSs are suitable for water cleaning and meet the requirement of mass production.
1. Introduction
Three dimensional porous nanomaterials are some of the most exciting nanomaterials due to their excellent physicochemical properties and wide range of potential applications.1–4 The interest in exploring these new three dimensional porous nanomaterials has significantly grown in the past few decades. Three dimensional porous boron nitride, an analog to graphite, exhibits high chemical stability, low density, high mechanical strength and good oxidation resistance, which cannot be observed in porous carbon.5 Compared to the 3D porous carbon materials, the synthesis of the 3D porous BN is more difficult because of the nature of BN and limited B and N sources. Until now, intensive investigations have been devoted to the controllable synthesis of 3D porous BN including 3D hollow spheres,6 NaOH-embedded 3D porous BN,7 3D nanoflowers,8 3D-BNNS networks,9 porous microsponges10 and ultralight boron nitride aerogels.11Today, rapidly changing technologies, industrial products and practices generate waste and toxic pollutants that if improperly managed, have threatened human health and the environment.12 Taking into consideration the volume of discharge and effluent composition, textile industries are assessed as high polluters. Considerable attention has been paid to adsorption technology as an efficient and economical method of removing organic dyes from textile wastewater effluents. Owing to their high specific surface area, peculiar B–N bond polarity, and good thermal and chemical stability, the porous BN materials are the potential competitive candidates for the organic pollutions removal.13–17 To satisfy the requirement for practical applications, the 3D BN nanostructures have aroused continuous research interest because of combining the adsorption property of BN materials and characteristic of 3D nanostructures. Up to now, various formulations of 3D BN nanostructures have been explored and they have been used as adsorbents for the removal of organic dyes. Nanosheet-structured boron nitride spheres prepared by Liu et al. have shown excellent performance in wastewater treatment.18 Liu et al. have successfully synthesized functional 3D BN architecture for removal of dyes from water.19 Xue et al. have fabricated boron nitride foam-like porous monoliths for efficient and fast removal of rhodamine B from the wastewater.5 The 3D white grapheme foam has been prepared by Zhao et al. that exhibits quick adsorption rate and high adsorption capacity for methylene blue.20
Herein, we report a template-free and catalyst-free route by which the 3D porous BNNSs with high thermal stability can be synthesized at large scale. The typical synthesis process consists of the formation of the precursor and the pyrolysis reaction in an ammonia flow. The as-grown 3D porous BNNSs with average diameters of about 200 nm and thicknesses of about 3 nm consist of an interconnected flexible network of BN nanosheets. Substantial experiments demonstrate that the 3D porous BNNSs possess high adsorption rate and capacity for organic dyes in the aqueous solution due to the combination of three dimensional BN structures and rich adsorption sites. The removal capacity of the 3D porous BNNSs is measured to be 413.3 mg g−1 for MB at 30 °C and pH 8. Moreover, after simple high temperature treatment, these used 3D porous BNNSs can be regenerated and used repeatedly with a negligible capacity loss (about 5.5% of adsorption efficiency loses even after ten cycles). All these features make the 3D porous BNNSs suitable for water cleaning, indicate its potentiality in a wide range of applications including energy storage and catalytic support.
2. Experimental
Synthesis
All chemical reagents were used directly without further purification as starting materials. The synthesis process is briefly described as follows. Firstly, 0.05 mol of B2O3 was added into 0.1 mol of ethylene diamine solution, then the solution was mixed under vigorous stirring for 1 h to get a homogenous solution. Secondly, the homogenous mixture was placed into a three-necked round-bottomed flask and treated at 280 °C for 1 h, then the as-prepared sample was naturally cooled to room temperature to get yellow colloform, a novel precursor. Finally, the as-prepared precursor was pretreated at 500 °C for 1 h, and then the temperature was slowly increased to1300 °C at a heating rate of 4 °C min−1 to keep for another 2 h to obtained the 3D porous BNNSs. All reactions were carried out in an ammonia flow rate of 200 mL min−1.Characterization
The phase of the 3D porous BNNSs were identified by X-ray powder diffraction (XRD, BRUKER D8 FOCUS). Fourier Transformation Infrared spectrometer (FTIR, Nicolet 7100) was used to feature the chemical compositions and bond characters. The morphology was examined by using field emission scanning electron microscopy (SEM, HITACHI S-4800) and transmission electron microscopy (TEM, Philips Tecnai F20) with an acceleration voltage of 200 kV. Thermogravimetry (TG) was measured at a controllable temperature ranging from room temperature to 1100 °C at a heating rate of 10 °C min−1 under air flow on a SDTQ-600 thermal analyzer. The nitrogen adsorption–desorption isotherm was measured at 77 K on an AutoSorb iQ-C TCD analyzer. The specific surface area was calculated by using Brunauer–Emmett–Teller (BET) equation (eqn (1)) in the relative pressure ranging from 0.01 to 0.3.
 | (1) |
Batch adsorption experiments
Batch adsorption experiments were undertaken in 100 mL flasks. To acquire the solution of organic dyes, methylene blue (MB) was dissolved in deionized water and then diluted to the required concentration before use. The pH of initial dye aqueous solution were adjusted to the required values by adding either 0.05 M HCl or 0.01 M NaOH solution. Buffer solution of potassium phosphate (1 mM) was added to the dye solution to enable better control of the pH on the basis of the acid–base characteristic of the dyes. To investigate the influence of contact time, 50 mg of the 3D porous BNNSs was brought into 100 mL of dye aqueous solution with a desired concentration and pH under continuously stirring at a constant speed of 150 rpm. The effect of pH on the adsorption capacity of the 3D porous BNNSs for MB was investigated in the pH range of 3–9. The amount of dye adsorbed onto the 3D porous BNNSs was calculated by a mass balance. The adsorption properties were measured at different time intervals at the optimized temperature and solution pH. For comparison, the adsorption performances of the porous 3D BNNSs for methyl orange (MO) were also measured.The pollutant removal percentage of the 3D porous BNNSs was calculated according to the following equation (eqn (2)):
| η (%) = (C0 − Ce)100/C0 | (2) |
The adsorption isotherm is fitted (correlation coefficients, R2 > 0.99) by using the following Langmuir adsorption model (eqn (3)):
| qe = qmKCe/(1 + KCe) | (3) |
Regeneration and reusability
The regeneration of the dye-containing 3D porous BNNSs was carried out by annealing at 400 °C in air for 1 h.3. Results and discussion
Characterization of the adsorbents
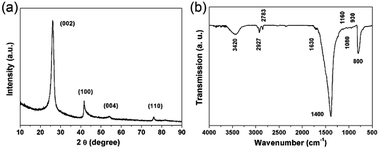
To study the crystal structure of the as-prepared 3D porous BNNSs, the powder XRD pattern is investigated. The typical XRD pattern is shown in Fig. 1a, in which the diffraction peak at 26.5° can be indexed as (002) lattice plane, indicating towards the hexagonal type of crystal structure in the hexagonal boron nitride (h-BN) (JCPDS card no. 34-0421).22,23 The peaks at 42.1°, 54.8° and 76.4° can also be indexed as the (100), (004), and (110) planes of h-BN, respectively. The sharpness of the main peaks and the appearance of the peak at 76.4° corresponding to the interplanar order (110) plane confirm that the 3D porous BNNSs possess higher degree of crystallinity than that of porous BN or activated BN.14,24 The 3D porous BNNSs with high crystallinity makes themselves possess good stability in the adsorption process, which is consistent with the result of TG measurement (please see the following section).The structural information and surface chemical properties of 3D porous BNNSs are illustrated by the FTIR spectrum in Fig. 1b. The two strong vibrations at around 1400 and 800 cm−1 in the FTIR spectrum attribute towards the in-plane stretching vibration of sp2-bonded B–N and the out-of-plane bending vibration of sp2-bonded B–N–B, respectively.25 Apart from the intrinsic peaks of h-BN, several weak peaks are also observed, including CH (∼2927 cm−1), –CH3 (∼2783 cm−1), CO (∼1630 cm−1), B–N–O (∼1160 cm−1), CO (∼1080 cm−1), and B–N–O (∼930 cm−1).26 It is worth noting that the extra peak centered at 3420 cm−1 can be ascribed to the hydroxyl group bonding to B atom or absorbed moisture. The FTIR analyses indicate that the 3D porous BNNSs possess abundant hydroxyl and surface organic groups, which are conducive to enhanced removal performance of the 3D porous BNNSs for organic dyes.
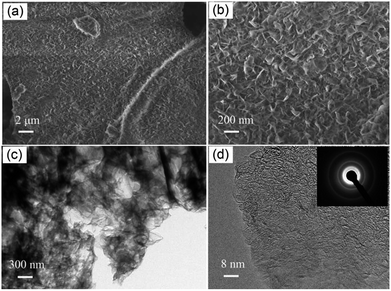
From the SEM observation in Fig. 2a, a foam-like morphology in the overall can be certified as the representative of the 3D porous BNNSs, which are prepared by a template-free synthetic method at 1300 °C. A photo of the sample is displayed in Fig. S1 (ESI†). The 3D porous BNNSs consist of BN nanosheets, and exhibit porous, fluffy and corrugated structures. The high-magnification SEM image (Fig. 2b) illustrates that the average diameters of the BN nanosheets assembling the foam-like 3D porous BNNSs are about 200 nm, and further reveal that the 3D porous BNNSs comprise a 3D porous structure. It is noticed that the pore volume of the 3D porous BNNSs is attributed to the aggregation of the BN nanosheets rather than their intraplate holes, which is further confirmed by the results from the analysis of the pore size distribution (please see the following section). The TEM images provide an insight vision of structure, morphology and nanosheet size of the 3D porous BNNSs. The TEM image reveals that the 3D porous BNNSs are consisted of interconnected wrinkled layers, as displayed in Fig. 2c. The corresponding high-magnification TEM image in Fig. 2d further indicates the wrinkled layer structures, and also depicts the presence of specific lattice planes. The atomic layers of the BN nanosheets rang from 4 to 10 layers. The selected area electron diffraction (SAED) pattern (Fig. 2d, inset) confirms the presence of crystalline nature corresponding to the (002) and (100) diffraction rings related to h-BN, which is also accordance with the above-mentioned XRD observation.27 A further investigation of the outer surface of the nanosheets reveals that numerous surface defects are introduced in the surface of the 3D porous BNNSs. The exposed BN edges with rich surface defects can provide excellent adsorption reactivity of the 3D porous BNNSs for organic dyes in the aqueous solution due to the high density structural defects offering strong binding sites.
The specific surface area, pore volume and pore size distribution play the significant roles during the adsorption process. The outgassing of the 3D porous BNNSs was carried at 300 °C for 3 h prior to nitrogen adsorption/desorption measurement. The nitrogen adsorption/desorption isotherm is conducted to determine the specific surface area and the pore size distribution of the 3D porous BNNSs. As displayed in Fig. 3a, the obtained isotherm is a characteristic of type-II isotherm according to the IUPAC nomenclature,28 and exhibits a H3 type broad hysteresis loop at a relative pressure between about 0.6 and 1.0. It is depicted that the 3D porous BNNSs possess predominant mesoporous structures with the slit-shaped pores, which result from the accretion of the BN nanosheets. The specific surface area of 474 m2 g−1 can be calculated by using the BET model.29 The broad pore diameters ranging from 3.8 to 29 nm have the main characteristic pore size of about 15 nm calculated by using the NLDFT method,30,31 as shown in Fig. 3b. On the basis of the isotherm profile, the pore volume is calculated to be 0.77 cm3 g−1.
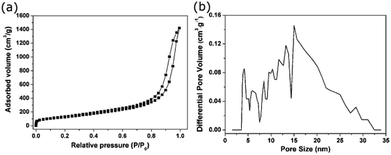 | ||
| Fig. 3 (a) Nitrogen adsorption/desorption isotherm of the 3D porous BNNSs, (b) the corresponding pore size distributions obtained by DFT method. | ||
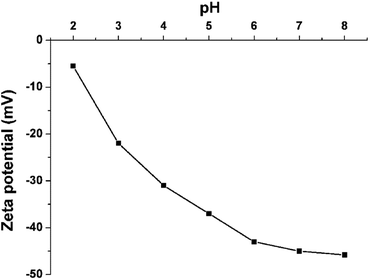
Zeta potential, revealing the type and value of the surface charge, plays a significant role to control the adsorption capacity and rate of the 3D porous BNNSs for the different organic dyes. For the 3D porous BNNSs, the medium is kept water at a range of pH (ranging from 2 to 8). A constant voltage (3.4 V) is applied to the electrodes placed in the dispersion medium. The conductivities of the 3D porous BNNSs are measured at different pH, and the corresponding zeta potential values are evaluated to be −5 to −45.8 mV at pH (ranging from 2 to 8), as shown in Fig. 4. The negative values of zeta potential confirm that the 3D porous BNNSs possess an overall negative surface charge even at above pH 2. Such negative surface charge is mainly attributed to the hydroxyl and amino groups on the surface and numerous structural defects.5 In addition, the zeta potential of the 3D porous BNNSs become less negative with an decrease in pH of the aqueous solution, as a result of the protonation of the –OH/–NH2 on the surface.17 Relatively enormous negative charges at high pH lead to improved electrostatic attraction between the 3D porous BNNSs and the cationic dye, which facilitates the adsorption of MB.
The high thermostability of the adsorbent enhances their cost-effectiveness due to long-term reusability. Fig. 5 displays the TG curve of the as-prepared 3D porous BNNSs measured in an air flow. From TG observation, the serious oxidation of the porous 3D BNNSs happens at about 930 °C, which is much higher than that of their analogue, the activated carbon.32 The higher thermostability and resistance to oxidation enables better stability of the sorbent in adsorption and regeneration process, which is consistent with the result of XRD measurement. This result also suggests that the regeneration of the dye-containing 3D porous BNNSs is carried out by a simple high temperature treatment. It is believed that the 3D porous BNNSs can also be a promising candidate for high-temperature applications in the air.
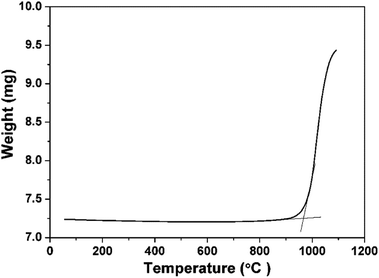 | ||
| Fig. 5 Thermogravimetry (TG) curve of the 3D porous BNNSs performed in an air flow. Temperature: 1100 °C; step: 10 °C min−1. | ||
Adsorption studies
MB and MO as the pollutants are employed to study the adsorption properties and demonstrate the potential applicability of the 3D porous BNNSs in wastewater treatment. In addition, the effects of the experimental parameters, such as solution pH, concentrations and contact time on removal efficiency of the 3D porous BNNSs for the organic dyes are investigated to achieve high adsorption capacity and rate in details.The solution pH plays an important role in the whole adsorption process and particularly on the adsorption capacity. The variations of MB and MO adsorption on the 3D porous BNNSs over a broad range of pH (ranging from 3 to 9) are shown in Fig. 6. It is known that ionic dyes upon dissolution release coloured dye anions/cations into the solution. It is obvious that the different trends of adsorption are followed by both dyes due to the types of charge on their surface. As shown in Fig. 6, the equilibrium adsorption capacities of the 3D porous BNNSs for MB increase with increasing solution pH, the adsorption mechanism for organic compounds is similar to that of the highly water-soluble and porous BN materials reported previously.33 Specially, these equilibrium adsorption capacity has more significant enhancement in the adsorption process as the solution pH is reached at 8 rather than at 7 or 9. The maximum adsorption percentage is up to 98.3% at pH 8, which is consistent with the zeta potential measurement. This can be attributed to the electrostatic attraction between the negatively charged surface of the 3D porous BNNSs and the cationic dye (MB). Decreasing in competition between H+ and positively charge dye leads to more availability of adsorption sites with the increase of solution pH.34 By contraries, the adsorption efficiency of the 3D porous BNNSs for the anionic dyes such as MO is enhanced with the decrease of pH and reaches the maximum adsorption percentage at pH 4. This result suggests that the reduction of negative charge on the surface of the 3D porous BNNSs is cause of neutralizing with H+. Different from the adsorption of cationic dye (MB), the electrostatic repulsion between the 3D porous BNNSs with negative charge and anionic dye (MO) results in decreasing the adsorption capacity. Therefore, the adsorption of these charged dyes onto the surface of the 3D porous BNNSs is primarily influenced by the surface charge on the adsorbent which is in turn influenced by the solution pH.
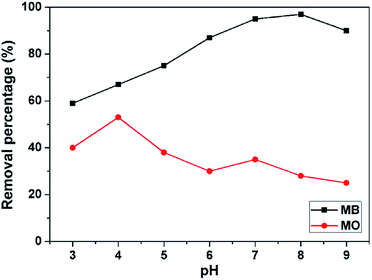 | ||
| Fig. 6 Effect of solution pH on the equilibrium removal percentage of MB (mass of adsorbent: 50 mg, contact time: 180 min, adsorption temperature: 30 °C, dye concentration: 200 mg L−1). | ||
The MB adsorption of the 3D porous BNNSs as a function of the initial pollution concentrations is depicted in Fig. 7. The initial pollution concentrations range from 5 mg L−1 to 190 mg L−1 while other experimental parameters, such as solution pH, contact time, are kept constant. The removal percentages of MB are investigated to be decreased with an increase in the initial concentrations due to the reduction in the effective adsorption sites of the 3D porous BNNSs. The adsorption of MO on the 3D porous BNNSs is also displayed in Fig. 7 for comparison. Under the same experimental conditions, the removal percentage of MB is much higher than that of MO. It is believed that the high density hydroxyl and amino groups and surface defects on the 3D porous BNNSs provide a large number of active sites for the adsorption of the cationic dye (MB) rather than the anionic dye (MO).35
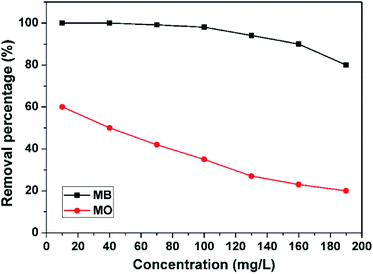 | ||
| Fig. 7 Effect of initial dye concentrations on adsorption of MB (mass of adsorbent: 50 mg, solution pH: 8, contact time: 180 min, adsorption temperature: 30 °C). | ||
The contact time is very important parameter to evaluate the rate of adsorption. As shown in Fig. 8, the removal rate of the 3D porous BNNSS for MB is very fast, especially in the first 5 min. About 95.3 wt% of MB in the aqueous solution is removed in the first 5 min in comparison with the adsorption efficiency of 10 wt% for conventional activated carbon and 67.5 wt% of the 3D porous BNNSs reported previously (Fig. S2, ESI†),7 and the removal percentage of MB increase to 99 wt% at 20 min. The equilibrium adsorption capacity (99.5 wt%) for MB on the 3D BNNSs quickly reach at 30 min. On the contrary, only ∼28.3 wt% of MO in the aqueous solution is removed within 60 min. This suggests that the overall negative charges of the 3D porous BNNSs are favorable for enhancing attractive forces between the unsaturated adsorbent surface and unabsorbed cationic dye (MB) rather than anionic dye (MO) molecules in the aqueous solution.
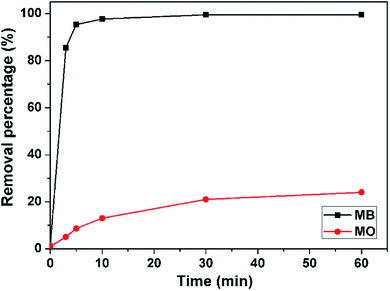 | ||
| Fig. 8 Effect of contact time on adsorption of MB (mass of adsorbent: 50 mg, solution pH: 8, dye concentration: 100 mg L−1, adsorption temperature: 30 °C). | ||
The experimental data are applied to the Langmuir isotherm model to investigate the adsorption behaviors of MB on the 3D porous BNNSs, as displayed in Fig. 9. The adsorption isotherm indicates that Langmuir model has a good fit with the experimental data for the 3D porous BNNSs (correlation coefficients, R2 > 0.99). This suggests that all sites are equal (equal enthalpies and energies). The maximum adsorption capacity of the 3D porous BNNSs calculated from the Langmuir equation is up to 413.3 mg g−1, which is higher than those of most nanomaterials reported previously.14,17,36–38 It is noticed that the removal capacity is also higher than most of the BN materials reported previously including porous BNNSs,14 BN nanocarpets,16 activated BN,17 3D BNNSs foam,20 BN hollow spheres,39 as listed in Table S1 (ESI†). A very steep slope in the initial portion of the adsorption isotherm reveals high adsorption capacity and rate of the 3D porous BNNSs. The high efficiency of the 3D porous BNNSs for water cleaning can be attributed to unique 3D structure and high density adsorption sites.
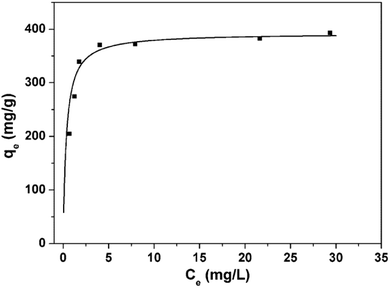 | ||
| Fig. 9 Adsorption isotherm of MB on the 3D porous BNNSs (contact time: 180 min, solution pH: 8, temperature: 30 °C). | ||
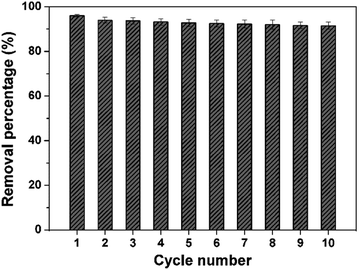
The reliable recovery and recycling of the 3D porous BNNSs is very important for application in water cleaning. A high-temperature treatment in air is used to regenerate organic dyes-saturated 3D porous BNNSs. Batch of regeneration experiments shown in Fig. 10 reveal that about 94.5% of the starting adsorption capacity is retained even after ten adsorption–regeneration cycles, which is much higher than that of the conventional activated carbon (the most widely used material for water cleaning at present). Moreover, the removal efficiency has no obvious decrease with the increase of cycles. From the XRD and SEM observations (Fig. S3, ESI†), one can see that the structure and morphology of the regenerated 3D porous BNNSs have no obvious change. The efficient reusability is mainly attributed to the high thermostability and oxidation resistance, which can enhance the cost-effectiveness of the 3D porous BNNSs.
4. Conclusions
In summary, the 3D porous BNNSs with high thermostability are successfully prepared by the template-free synthesis route without the use of any catalyst, which consist of the corrugated BN nanosheets. Solution pH plays very important role in the adsorption process on basis of the investigation of negative charge over the surface on the 3D porous BNNSs. The 3D porous BNNSs exhibit excellent adsorption capacity without any additives as high as 413.3 mg L−1 and adsorption rate (effectively eliminating ∼95.3 wt% within 5 min) at pH 8. It also features good cycling performance due to high resistance to oxidation and good chemical inertness. Therefore, the 3D porous BNNSs are very promising candidates for application in water cleaning.Conflicts of interest
There are no conflicts to declare.Acknowledgements
This work was supported by the Natural Science Foundation of Hubei Province (2017CFB581), the Science and Technology Research Program of the Education Department of Hubei Province (B2017210), Major Project of Technological Innovation (2016AAA038).Notes and references
- J. G. Alauzun, S. Ungureanu, N. Brun, S. Bernard and P. Miele, J. Mater. Chem., 2011, 21, 14025 RSC.
- M. Rousseas, A. P. Goldstein, W. Mickelson, M. A. Worsley, L. Woo and A. Zettl, ACS Nano, 2013, 7, 8540 CrossRef PubMed.
- J. Yin, X. Li, J. Zhou and W. Guo, Nano Lett., 2013, 13, 3232 CrossRef PubMed.
- H. Wang, K. Sun, F. Tao, D. Stacchiola and Y. H. Hu, Angew. Chem., Int. Ed., 2013, 52, 9210 CrossRef PubMed.
- Y. Xue, P. Dai, X. Jiang, X. Wang, C. Zhang, D. Tang, Q. Weng, X. Wang, A. Pakdel, C. Tang, Y. Bando and D. Golberg, J. Mater. Chem. A, 2016, 4, 1469 RSC.
- T. Ohashi, Y. T. Wang and S. Shimada, J. Mater. Chem., 2010, 20, 5129 RSC.
- J. Li, H. Jia, Y. Ding, H. Luo, S. Abbas, Z. Liu, L. Hu and C. Tang, Nanotechnology, 2015, 26, 475704 CrossRef PubMed.
- G. Lian, X. Zhang, M. Tan, S. J. Zhang, D. L. Cui and Q. L. Wang, J. Mater. Chem., 2011, 21, 9201 RSC.
- X. Zeng, Y. Yao, Z. Gong, F. Wang, R. Sun, J. Xu and C. Wong, Small, 2015, 11, 6205 CrossRef PubMed.
- Q. Weng, X. Wang, Y. Bando and D. Golberg, Adv. Energy Mater., 2013, 4, 1 Search PubMed.
- Y. Song, B. Li, S. Yang, G. Ding, C. Zhang and X. Xie, Sci. Rep., 2014, 5, 10337 CrossRef PubMed.
- E. Forgacs, T. Cserháti and G. Oros, Environ. Int., 2004, 30, 953 CrossRef PubMed.
- Q. Li, T. Yang, Q. Yang, F. Wang, K. C. Chou and X. Hou, Ceram. Int., 2016, 42, 8754 CrossRef.
- W. Lei, D. Portehault, D. Liu, S. Qin and Y. Chen, Nat. Commun., 2013, 4, 1777 CrossRef PubMed.
- L. Xue, B. Lu, Z. Wu, C. Ge, P. Wang, R. Zhang and X. Zhang, Chem. Eng. J., 2014, 243, 494 CrossRef.
- X. Zhang, G. Lian, S. Zhang, D. Cui and Q. Wang, CrystEngComm, 2012, 14, 4670 RSC.
- J. Li, Y. Huang, Z. Liu, J. Zhang, X. Liu, H. Luo, Y. Ma, X. Xu, Y. Lu, J. Lin, J. Zuo and C. Tang, J. Mater. Chem. A, 2015, 3, 8185 RSC.
- F. Liu, J. Yu, X. Ji and M. Qian, ACS Appl. Mater. Interfaces, 2015, 7, 1824 CrossRef PubMed.
- D. Liu, W. Lei, S. Qin and Y. Chen, Sci. Rep., 2014, 4, 4453 CrossRef PubMed.
- H. Zhao, X. Song and H. Zeng, NPG Asia Mater., 2015, 7, 1 CrossRef PubMed.
- The Non-Local Density Functional Theory (NLDFT) methods used in the present manuscript correctly describe the local fluid structure near curved solid walls; adsorption isotherms in model pores are determined based on the intermolecular potentials of the fluid-fluid and solid-fluid interactions, the related explanation please read the references, R. Evans, U. M. B. Marconi and P. Tarzona, J. Chem. Soc., Faraday Trans. 2, 1986, 82, 1763 RSC; P. I. Ravikovitch, G. L. Haller and A. V. Neimark, Adv. Colloid Interface Sci., 1998, 203, 76–77 Search PubMed.
- C. Zhi, Y. Bando, C. Tang, D. Golberg, R. Xie and T. Sekigushi, Appl. Phys. Lett., 2005, 86, 213110 CrossRef.
- R. T. Paine and C. K. Narula, Chem. Rev., 1990, 90, 73 CrossRef.
- D. Golberg, Y. Bando, Y. Huang, T. Terao, M. Mitome, C. Tang and C. Zhi, ACS Nano, 2010, 4, 2979 CrossRef PubMed.
- C. Zhi, Y. Bando, C. Tang, H. Kuwahara and D. Golberg, Adv. Mater., 2009, 21, 2889 CrossRef.
- C. Tang, Y. Bando, Y. Huang, C. Zhi and D. Golberg, Adv. Funct. Mater., 2008, 18, 3653 CrossRef.
- J. Li, P. Jin, W. Dai, C. Wang, R. Li, T. Wu and C. Tang, Mater. Chem. Phys., 2017, 196, 186 CrossRef.
- K. S. W. Sing, Pure Appl. Chem., 1985, 57, 603 Search PubMed.
- S. Brunauer, P. H. Emmett and E. Teller, J. Am. Chem. Soc., 1938, 60, 309 CrossRef.
- R. Evans and P. Tarazona, Phys. Rev. Lett., 1984, 52, 557 CrossRef.
- S. Schlieger, J. Alauzun, F. Michaux, L. Vidal, J. Parmentier, C. Gervais, F. Babonneau, S. Bernard, P. Miele and J. B. Parra, Chem. Mater., 2012, 24, 88 CrossRef.
- M. Sekar, V. Sakthi and S. Rengaraj, J. Colloid Interface Sci., 2004, 279, 307 CrossRef PubMed.
- Q. Weng, B. Wang, X. Wang, N. Hanagata, X. Li, D. Liu, X. Wang, X. Jiang, Y. Bando and D. Golberg, ACS Nano, 2014, 8, 6123–6130 CrossRef PubMed.
- E. N. E. Qada, S. J. Allen and G. M. Walker, Chem. Eng. J., 2008, 135, 174–184 CrossRef.
- P. Singla, N. Goel, V. kumar and S. Singhal, Ceram. Int., 2015, 41, 10565 CrossRef.
- S. Wang, Y. Boyjoo, A. Choueib and Z. H. Zhu, Water Res., 2005, 39, 129 CrossRef PubMed.
- L. Zheng, Y. Su, L. Wang and Z. Jiang, Sep. Purif. Technol., 2009, 68, 244 CrossRef.
- C. Kannan, K. Muthuraja and M. R. Devi, J. Hazard. Mater., 2013, 244–245, 10 CrossRef PubMed.
- G. Lian, X. Zhang, S. Zhang, D. Liu, D. Cui and Q. Wang, Energy Environ. Sci., 2012, 5, 7072 RSC.
Footnote |
| † Electronic supplementary information (ESI) available: Langmuir parameters and the correlation coefficients R2, as well as the plots of the calculated spin density distributions. See DOI: 10.1039/c8ra06445h |
| This journal is © The Royal Society of Chemistry 2018 |

