
 Open Access Article
 This Open Access Article is licensed under a Creative Commons Attribution-Non Commercial 3.0 Unported Licence
A gold nanoparticle based colorimetric and fluorescent dual-channel probe for acetylcholinesterase detection and inhibitor screening†
Jie
Lv
,
Binnan
He
,
Na
Wang
,
Meng
Li
 * and
Yulong
Lin
*
* and
Yulong
Lin
*
College of Pharmaceutical Sciences, Hebei Medical University, Shijiazhuang, 050017, China. E-mail: limeng87@hotmail.com; linyulong8@163.com; Fax: +86 311-86266901; Tel: +86 311-86266901
First published on 24th September 2018
Abstract
Based on the competitive host–guest interaction between p-sulfonatocalix[6]arene (p-SC6A) capped AuNPs and Rhodamine B (RhB)/acetylthiocholine, a fluorescent and colorimetric dual channel probe was developed for rapid detection of AChE with high sensitivity and selectivity. The detection limit was estimated to be 0.16 mU mL−1. Crucially, due to the specific host–guest interaction, the high selectivity of the bioassay permitted the discrimination of AChE from other cations and proteins including biothiols and enzymes. Furthermore, the present method was also successfully applied to determinate AChE levels and screen AChE inhibitors in real cerebrospinal fluid (CSF) samples, which suggested that our proposed method has great potential to be applied in monitoring the disease progression and drug treatment effects of Alzheimer's disease (AD).
Introduction
Acetylcholine (ACh), as a central neurotransmitter, plays a decisive role in memory and learning.1,2 It has been reported that Alzheimer's disease (AD), the most common form of dementia in elderly people, is related to a low level of ACh in the brain.3,4 The hydrolysis of ACh catalyzed by acetylcholinesterase (AChE) at cholinergic synapses can cause the termination of synaptic transmission. Furthermore, much research has provided evidence that AChE can also accelerate the aggregation of amyloid-β peptide making a further contribution to the progression of AD.5–7 Therefore, sensitive and quantitative detection of AChE activity and screening of its inhibitors are of diagnostic importance and have therapeutic implications.To this end, a range of methods/techniques for detection of AChE level have been employed, including the colorimetric Ellman method8,9 or the detection of hydrogen peroxide (H2O2) produced by oxidation of choline.10,11 With the development of H2O2 sensors,12–14 recently, fluorescent or colorimetric approaches based on synthetic probes and nanozymes,15–18 as well as various electrochemical methods,19,20 have been developed to monitor AChE activity and screen the inhibitors of AChE. However, most of these methods cannot discriminate AChE from other biothiols. The poor sensitivity and low specificity make them unsuitable for biological sample analysis.
Due to the distinctive physical and optical properties, gold nanoparticles (AuNPs) have been successfully employed as a colorimetric probe for the detection of AChE activity based on their size-dependent surface plasmon resonance absorption.21–23 Although promising, the aggregation of AuNPs in most of these methods was caused by salt-sensitive electrostatic interaction. The electrostatic interaction is not stable in physiological environment, since some biomacromolecules in vivo might also compete for the interactions with the molecules on the surface of nanoparticles. Supramolecular host–guest interaction has played an important role in the chemical sensing research, including the sensor chip for the metal ion detection24,25 and the fluorescent DNA detection.26,27 The use of host–guest interactions is an attractive alternative to electrostatic interaction since the recognition motifs are specific and bioorthogonal without an additional catalyst, which is suitable for biological application.
Herein, a new dual-signalling sensing strategy based on the competitive host–guest interaction between p-sulfonatocalix[6]arene (p-SC6A) capped AuNPs and reporting probe/target was developed. Rhodamine B (RhB) and acetylthiocholine (ATC, an analogue of ACh) were used in a model system as the probe and target molecule, respectively. RhB is an ideal reporter for this assay owing to its water solubility and high fluorescence quantum yield. Especially, RhB has the suitable binding affinity with SC6A, which is weaker than ATC but stronger than other numerous biologically abundant cations, leading to the assay with maximized sensitivity and minimized interference by non-targeted species.28 Free RhB is highly fluorescent in aqueous solution, however, it displays strong fluorescence quenching when interacting with p-SC6A. More importantly, through binding with p-SC6A, the RhB molecules are closely associated with AuNPs which would enhance the quenching efficiency of RhB. Upon addition of ATC into the RhB-p-SC6A-AuNPs solution, the RhB molecules existed inside the p-SC6A host can be replaced by ATC, leading to the recovery of the fluorescence. When AChE was introduced, ATC could be hydrolyzed by AChE to generate thiocholine. Thiocholine strongly binds onto surfaces of AuNPs via the formation of Au–S bond. At the same time, the quaternary ammonium group on thiocholine and the p-SC6A molecules attached on different AuNP surfaces may be able to interact via host–guest interaction and cause the aggregation of AuNPs and a release of RhB-p-SC6A, leading to a further recovery of RhB fluorescence. With the two types of reporters, the system can differentiate well between thiocholine and other biothiols and overcome the interference of salts effects, making it suitable for monitoring the level of AChE in the cerebrospinal fluid (CSF), which is relevant to the progression of AD (Fig. 1).3–7
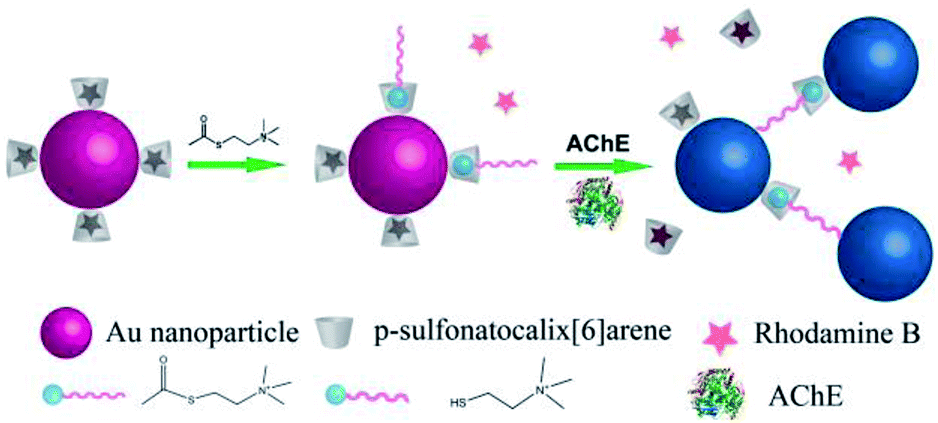 | ||
| Fig. 1 System for detection of AChE activity based on RhB-p-SC6A-AuNPs aggregation and RhB release induced by the competitive host–guest interaction between p-SC6A-AuNPs and RhB/quaternary ammonium group. | ||
Experimental
Materials and measurements
Gold(III) chloride trihydrate (HAuCl4·3H2O), Rhodamine B (RhB), sodium borohydride (NaBH4), acetylcholinesterase (AChE), chymotrypsin and glucose oxidase were obtained from Sigma-Aldrich. para-Sulfonatocalix[6]arene (p-SC6A) was purchased from TCI Development Co., Ltd. (Shanghai, China). Arginine, glutamic acid, tyrosine and threonine were obtained from Aladdin Reagent Inc. (China). All these reagents were used as received without further purification. Deionized water (18.2 MΩ cm) used for all experiments was obtained from a Milli-Q system (Millipore, Bedford, MA).A JASCO FP-6500 spectrofluorometer was used to monitor the fluorescence of RhB. The slit width for the excitation and emission was 5 nm. The UV-vis absorption spectra of Au nanoparticles were recorded by a Jasco-V550 UV-vis spectrophotometer. Fourier transform infrared spectroscopy (FTIR) measurements were carried out with a BRUKER Vertex 70 FTIR spectrometer. The sample was prepared as pellets using spectroscopic grade KBr. Transmission electron microscopic (TEM) experiments were performed on a Philips Tecnai G2 20 S-TWIN microscope operating at 200 kV.
Synthesis of p-SC6A capped AuNPs
The p-SC6A-AuNPs were synthesized according to previous reports.29 Briefly, p-SC6A solution (2 mL, 10 mM) was mixed with deionized water (94 mL) under mid stirring at room temperature, and then HAuCl4 solution (2 mL, 26.3 mM) was added. After stirring for 20 min in the dark, freshly prepared NaBH4 solution (2 mL, 10 mM) was added into the above mixture solution immediately, and then the reaction was allowed to proceed for 2 h in the dark. The obtained p-SC6A-AuNPs were washed twice by centrifugation to remove the free p-SC6A. After that, p-SC6A-AuNPs were dispersed in deionized water and stored at 4 °C for further use.Synthesis of RhB-p-SC6A-AuNPs
RhB (9.58 mg) was dissolved in deionized water (10 mL) to obtain the stock solution. Then different amounts of RhB stock solution were added respectively into the solutions of p-SC6A-AuNPs (5.5 nM) under stirring. The mixture was stirred continuously at room temperature for 2 h. After that, the fluorescence spectra of the mixture solutions were monitored with excitation at 550 nm. As the concentration of RhB increased, the florescence of the resulting solution was intensified. In a low concentration region (c = 0–2 μM), the very weak fluorescence observed in RhB-p-SC6A-AuNPs solutions, indicating that almost all the RhB molecules interacted with p-SC6A on the surface of AuNPs. However, the emission intensity increased when the concentration of RhB was greater than 2 μM. Therefore, we chose 2 μM as the optimal concentration of RhB to synthesize RhB-p-SC6A-AuNPs.Detection of AChE activity assay
For the sensitivity of this assay, different levels of AChE were added to the PBS solution (10 mM, pH = 8.0) composed of ATC (20 μM) and RhB-p-SC6A-AuNPs (5 nM), followed by incubation at room temperature for 20 min to make the reaction between AChE and ATC sufficiently. After that the absorption spectra and fluorescence spectra were monitored. For the selectivity of this assay, different biothiols, amino acids (final concentration of each biothiol or amino acid was 0.1 mM) or enzymes (final concentration of each enzyme was 1 U mL−1) instead of AChE were added to the mixture of RhB-p-SC6A-AuNPs and ATC, respectively. The mixtures were incubated at room temperature for 20 min, and then their absorption spectra and fluorescence spectra were recorded.Evaluation for inhibitor assay
For the inhibition assay, different concentrations of tacrine (an approved AChE inhibitor) were first premixed with AChE (50 mU mL−1) for 30 min at 37 °C. Then, the pretreated AChE samples (The final concentration of AChE was 5 mU mL−1) were mixed with RhB-p-SC6A-AuNPs and ATC. Finally, the reaction solution was allowed to stand at room temperature for 20 min. The absorbance of each sample was recorded using UV-vis spectroscopy. The inhibitory ratios (%) of tacrine was expressed as follows:where A600/A520 was the ratio of the absorbance value at 600 nm to that at 520 nm in the presence of both the inhibitor and the enzyme, AE0600/AE0520 was the ratio of the absorbance value at 600 nm to that at 520 nm with enzyme only. And A0600/A0520 was the ratio of the absorbance value at 600 nm to that at 520 nm in the absence of the enzyme and inhibitor. The fluorescence of the system was also monitored, and the inhibitory ratio was calculated with the same method.
Handing of mice
Eight-week-old male C57BL6/J mice with body weights between 20 and 25 g were obtained from the Experimental Animal Center of the Chinese Academy of Medical Sciences. All the protocols and procedures for animal handling were carried out following the guidelines of the Hebei committee for care and use of laboratory animals, and were approved by the Animal Experimentation Ethics Committee of the Hebei Medical University. CSF was collected under anaesthesia using a glass pulled micropipette after exposure of the cisterna magna, taking care not to contaminate the CSF with blood. The CSF was immediately diluted 1![[thin space (1/6-em)]](https://www.rsc.org/images/entities/char_2009.gif) :10 in phosphate buffered saline (PBS) and detected in one day after collection.
:10 in phosphate buffered saline (PBS) and detected in one day after collection.
Results and discussion
Synthesis and characterization of the RhB-p-SC6A-AuNPs
To develop this strategy, we first synthesized SC6A modified AuNPs using SC6A as the stabilizer. p-SC6A-AuNPs were monodispersed with average size of ∼13 nm according to transmission electron microscopy (TEM) characterization (Fig. S1A†). The p-SC6A-AuNPs solution showed typical plasmon absorption around 520 nm (Fig. S2†). The modification of p-SC6A on the surface of AuNPs was evidenced by FTIR. As shown in Fig. S3,† the characteristic absorption peaks of SO3− at 1177 cm−1 and 1113 cm−1 found in pure p-SC6A, were shifted to 1155 cm−1 and 1104 cm−1, respectively, which suggested that the SO3− groups grafted onto the surface of AuNPs.29 RhB-p-SC6A-AuNPs were prepared by mixing various concentrations of RhB (0–4 μM) with p-SC6A-AuNPs (5.5 nM) solution under mild stirring. To identify an optimal concentration of RhB that could be appended to p-SC6A-AuNPs, the fluorescence of the RhB-p-SC6A-AuNPs solutions were monitored after equilibration for 2 h. As shown in Fig. S4,† the optimal concentration of RhB would be 2 μM, when no excess RhB was free in the solution and only very weak fluorescence was observed. Furthermore, complexed with RhB could not change the absorption band of p-SC6A-AuNPs indicating no aggregation occurred during the functionalized procedure which was in accordance with the TEM image (Fig. S2 and S1B†).Quantitative detection of ATC by RhB-p-SC6A-AuNPs
To evaluate the sensing ability of RhB-p-SC6A-AuNPs for ATC, the absorbance and fluorescence spectra of RhB-p-SC6A-AuNPs in the presence of ATC were monitored (Fig. 2). Addition of ATC to the solution of AuNPs did not induce absorption spectral variation (Fig. S2†) but caused the release of RhB to recover its fluorescence. The detection range of ATC was from 0.05 to 20 μM (Fig. 2B) and the linear relationship between corresponding fluorescence change (F/F0) and ATC concentration was shown in Fig. 2B. The detection limit for ATC can be as low as 13 nM, which attributed to the sensitivity of this assay to detect AChE.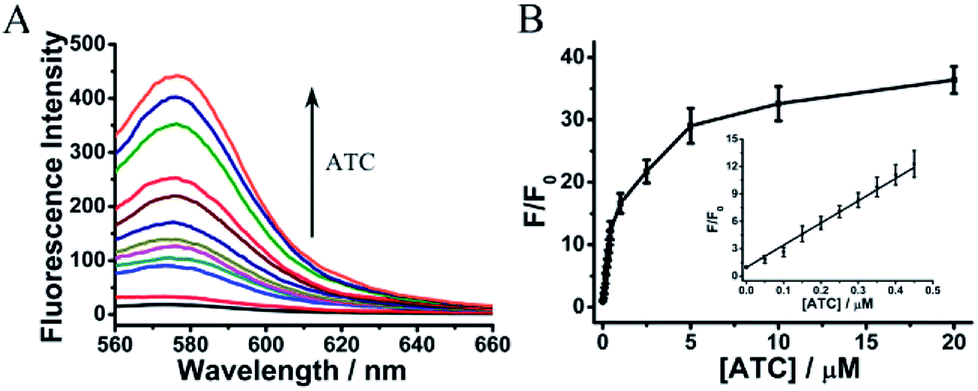 | ||
| Fig. 2 The sensitivity of this assay for detection of ATC by the release of RhB. (A) The fluorescence emission spectra of RhB-p-SC6A-AuNPs that were incubated with different concentrations of ATC. (B) The relationship between F/F0 and the concentration of ATC from 0 to 20 μM. Error bars were estimated from three independent measurements. Inset was a linear region. F and F0 were the fluorescence intensities of RhB-p-SC6A-AuNPs at 578 nm in the presence and absence of ATC, respectively. The excitation wavelength was 550 nm. | ||
Sensitivity of the assay for AChE detection
AChE can catalyze its substrate ATC to generate thiocholine, which would lead to the aggregation of p-SC6A-AuNPs. For further determining the sensitivity of the protocol to monitor the activity of AChE, we first applied the AuNP-based colorimetric assay. Various amounts of AChE were added to the solution composed of ATC (20 μM) and RhB-p-SC6A-AuNPs (5 nM) in PBS (10 mM, pH = 8.0), followed by incubation at room temperature for 20 min to make the reaction between AChE and ATC sufficiently. The aggregation process of AuNPs can be easily visualized by a colour change from red to purple with the naked-eye (Fig. 3A). Simultaneously, the UV/vis absorption spectra of the solutions were recorded. As indicated in Fig. 3A, as the concentration of AChE increased, the absorption around 520 nm gradually decreased along with an increase in intensity of the band above 600 nm (Fig. 3A), indicating the formation of AuNP aggregates. The aggregation process was also directly confirmed by TEM analysis (Fig. S5†).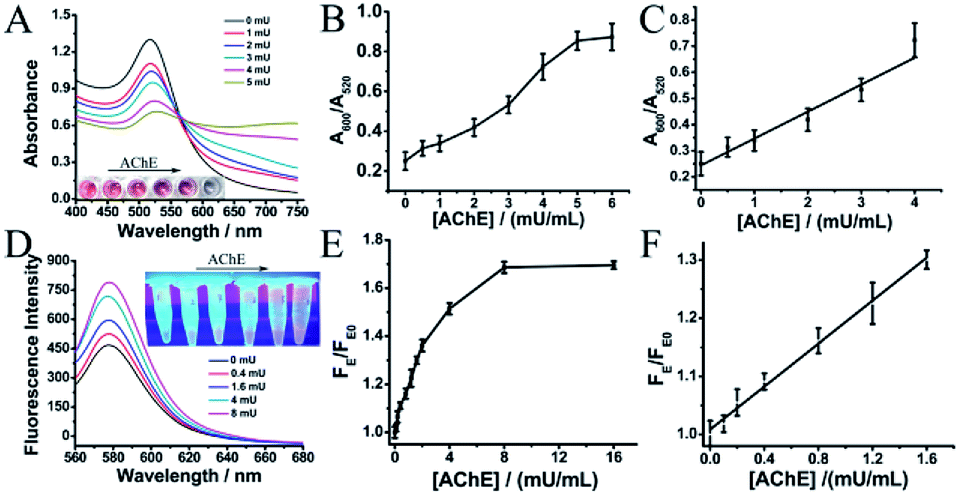 | ||
| Fig. 3 The sensitivity of this assay for AChE activity by colorimetric and fluorescent methods. (A) Absorbance spectra of RhB-p-SC6A-AuNPs that were incubated with different concentrations of AChE in the presence of ATC (20 μM). Inset were the photographs of corresponding solutions. (B) Variation of A600/A520versus the concentration of AChE for the solution of RhB-p-SC6A-AuNPs containing ATC (20 μM). (C) The liner region of (B). (D) The fluorescence emission spectra of RhB from RhB-p-SC6A-AuNPs by incubating with various concentrations of AChE in the presence of ATC (20 μM). Inset were the fluorescent images. (E) Calibration curve corresponding to FE/FE0 against the concentration of AChE from fluorescent assay. (F) The liner region of (E). FE and FE0 were the fluorescence intensities of RhB-p-SC6A-AuNPs containing ATC (20 μM) at 578 nm in the presence and absence of AChE, respectively. | ||
It is worth noting that, at low AChE concentrations (0–5.0 mU mL−1), the plot of A600/A520 (the ratio of absorbance at 600 nm and 520 nm) versus the concentrations of AChE revealed a nearly linear relationship. The limit of detection of this assay was evaluated to be 0.46 mU mL−1, which, to our knowledge, was much lower than most of the previous reported optical methods.22,23 The high sensitivity of our assay was raised from the specific host–guest interactions between the quaternary ammonium group on thiocholine and the p-SC6A molecules attached on different AuNP surfaces. The lowest detectable concentration of AChE was further determined via the fluorescence recovery of RhB. As shown in Fig. 3E, the emission intensity enhancement rate (F/F0) was fast at low AChE concentrations and became slower when the concentration was greater than 2 mU. The detection limit can be as low as 0.16 mU mL−1via the fluorescence recovery of RhB, which was comparable to that of recently reported assays for AChE.17–19
Selectivity of the assay for AChE detection
To evaluate the specificity of this assay for AChE, we next measured the interference from other biothiols, amino acids, anions, cations or proteins especially those that were found abundantly in human body. With thiol group, biothiols, such as cysteine (Cys) and glutathione (GSH), could readily attach on the surfaces of AuNPs via Au–S bonds, which were quite similar to thiocholine. However, these biothiols even at high concentrations could not recovery the fluorescence of the dye because of the relative high binding affinity of p-SC6A to RhB (Fig. S6†). Furthermore, owing to the lacking of the positively charged quaternary ammonium group which could interact with p-SC6A on the surface of AuNPs, they were also unable to induce the aggregation of AuNPs (Fig. 4A). Several other enzymes, proteins or amino acids such as bovine serum albumin (BSA), chymotrypsin, glucose oxidase, arginine, glutamic acid, tyrosine and threonine were also employed to evaluate the selectivity of the sensor for AChE. As shown in Fig. S7† and 4B, for other amino acids or proteins with a concentration up to 100 times higher than that of AChE, the A600/A520 was almost unchanged compared with the control group, indicating that our assay displayed a high selectivity for AChE.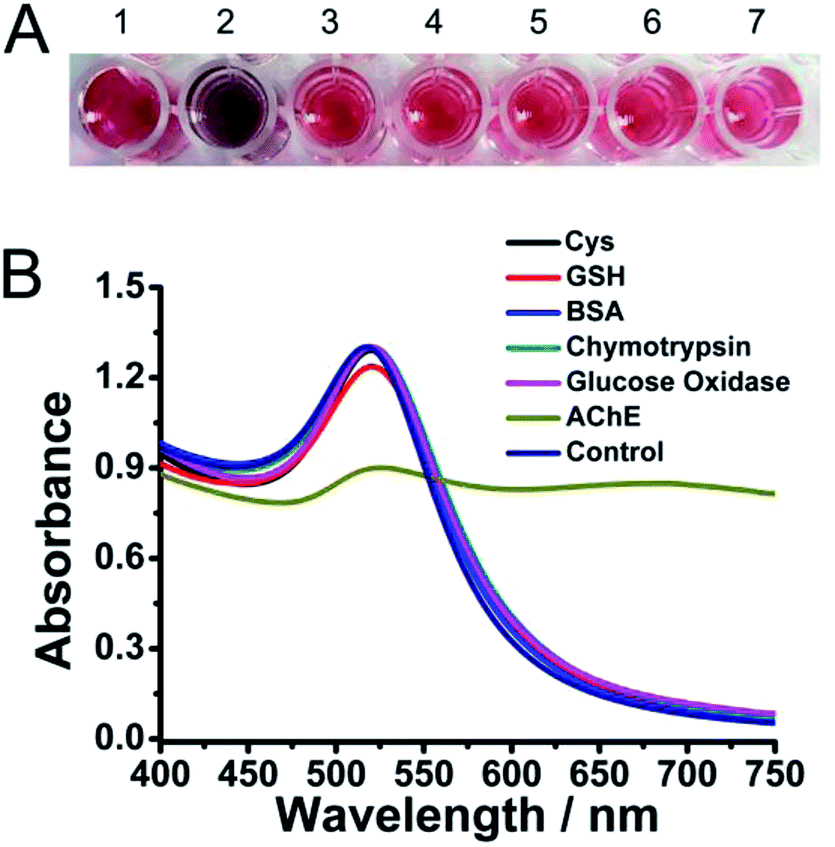 | ||
| Fig. 4 Selectivity of the AChE sensor. (A) The color change of the solution in response to different species including biothiols and proteins that may exist in human body. (1) Control; (2) AChE; (3) Cys; (4) GSH; (5) BSA; (6) chymotrypsin; (7) glucose Oxidase. (B) Absorption curves of the solutions in (A). The final concentration of each biothiol was 0.1 mM and the enzymes was 1 U mL−1. | ||
Evaluation for inhibitor assay
Encouraged by the sensitivity and specificity of this assay, we next evaluated whether RhB-p-SC6A-AuNPs could be used to screen AChE inhibitors. As indicated in Fig. 5, pretreated AChE with tacrine,30,31 a well-known cholinesterase inhibitor, the aggregation of AuNPs was inhibited. The degree of AuNP aggregation was dependent on the concentration of tacrine. With the increase of tacrine concentrations, the colour of the solution changed from violet to wine red, corresponding to a decrease in A600/A520. The maximum inhibition ratio of tacrine was 89.63% with the IC50 value of 37.8 μM (Fig. 5B), which was in accordance with the previous reports.30,31 Similarly, the further fluorescence recovery of RhB was blocked with the increased concentration of tacrine, which was caused by the reduced amount of thiocholine fluorescence recovery of RhB (Fig. 5C). The IC50 value of tacrine obtained from the fluorescence method was 34.01 μM (Fig. 5D), which was quite similar with that from the colorimetric assay. These results indicated that the two methods used to quantitate the inhibition of AChE in our assay showed no significant change in IC50 value. Our assay can be applied to screen AChE inhibitors and evaluate the inhibition efficiency. | ||
| Fig. 5 The sensitivity of this assay for screening AChE inhibitors. (A) Absorbance spectra of the dispersion upon analyzing various concentrations of tacrine. (B) Calibration curve corresponding to inhibition ratio against the concentration of tacrine from colorimetric assay. (C) The fluorescence emission spectra of the dispersion upon analyzing various concentrations of tacrine. (D) Calibration curve corresponding to inhibition ratio against the concentration of tacrine from fluorescent assay. | ||
Analysis of CSF samples
It was also necessary to determine whether our assay can be directly applied for monitoring AChE in real CSF samples. As shown in Fig. 6, addition of untreated CSF into the mixture of ATC and RhB-p-SC6A-AuNPs both induced the aggregation of AuNPs and recovered the fluorescence of the system. Furthermore, similar with the pure AChE samples, pretreated with different concentrations of tacrine, the CSF samples led to different degrees of AuNPs aggregation (Fig. 6). All these results revealed the practicality of using our method to determinate AChE levels and screen AChE inhibitors in real CSF samples, indicating its possibility for monitoring the disease progression and drug treatment effects for AD.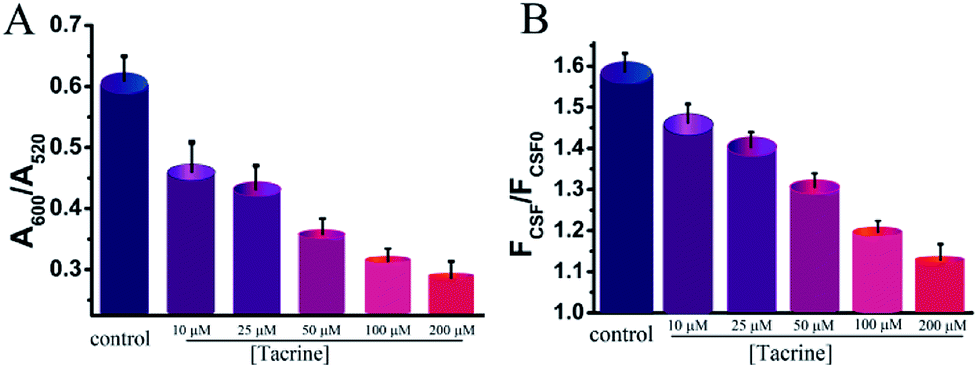 | ||
| Fig. 6 Inhibition of CSF AChE activity by tacrine. (A) Absorption responses of the assay for CSF AChE activity pretreated with different concentrations of tacrine. (B) Fluorescence responses of the assay for the samples in (A). | ||
Conclusions
In conclusion, based on the competitive host–guest interaction between SC6A-AuNPs and RhB/quaternary ammonium group, a highly sensitive and selective assay for AChE detection was successfully established. With the dual signal reporters, our system can differentiate well between AChE and other proteins with a detection limit as low as 0.16 mU mL−1. Furthermore, the present method was also successfully applied to determinate AChE levels and screen AChE inhibitors in real CSF samples, which was significantly important for monitoring the disease progression and drug treatment effects for AD. Crucially, when change RhB to AChE inhibitor, our system can also be used as ACh or choline responsive-drug release system. Given its simplicity and easy operation, this method may extend to high-throughput screening of AChE inhibitors and be highly useful in a wide range of applications such as drug discovery, bioanalysis, and targeted drug delivery system.Conflicts of interest
There are no conflicts to declare.Acknowledgements
The authors thank the financial supports from by the Youth Top-notch Talents Supporting Plan of Hebei Province (BJ2018007) and the Natural Science Foundation of Hebei Province (Grant No. H2017206214, H2016206280, H2016206096 and H2017206281).Notes and references
- M. E. Hasselmo, Curr. Opin. Neurobiol., 2006, 16, 710–715 CrossRef CAS.
- S. Gais and J. Born, Proc. Natl. Acad. Sci. U. S. A., 2004, 101, 2140–2144 CrossRef CAS.
- F. Mangialasche, A. Solomon, B. Winblad, P. Mecocci and M. Kivipelto, Lancet Neurol., 2010, 9, 702–716 CrossRef CAS.
- P. Davidsson, K. Blennow, N. Andreasen, B. Eriksson, L. Minthon and C. Hesse, Neurosci. Lett., 2001, 300, 157–160 CrossRef CAS.
- N. C. Inestrosa, A. Alvarez, C. A. Pérez, R. D. Moreno, M. Vicente, C. Linker, O. I. Casanueva, C. Soto and J. Garrido, Neuron, 1996, 16, 881–891 CrossRef CAS.
- G. V. De Ferrari, M. A. Canales, I. Shin, L. M. Weiner, I. Silman and N. C. Inestrosa, Biochemistry, 2001, 40, 10447–10457 CrossRef CAS.
- M. G. Cottingham, M. S. Hollinshead and D. J. T. Vaux, Biochemistry, 2002, 41, 13539–13547 CrossRef CAS.
- J. Hou, Z. Tian, H. Xie, Q. Tian and S. Ai, Sens. Actuators, B, 2016, 232, 477–483 CrossRef CAS.
- G. L. Ellman, K. D. Courtney, V. Andres and R. M. Featherstone, Biochem. Pharmacol., 1961, 7, 88–90 CrossRef CAS.
- S. Hou, Z. Ou, Q. Chen and B. Wu, Biosens. Bioelectron., 2012, 33, 44–49 CrossRef CAS.
- P. Valeri, Y. Xiao and W. Itamar, Nano Lett., 2005, 5, 649–653 CrossRef.
- Q. Liu, Y. Yang, H. Li, R. Zhu, Q. Shao, S. Yang and J. Xu, Biosens. Bioelectron., 2015, 64, 147–153 CrossRef CAS.
- L. Zhang, M. Chen, Y. Jiang, M. Chen, Y. Ding and Q. Liu, Sens. Actuators, B, 2017, 239, 28–35 CrossRef CAS.
- M. Chen, Y. Ding, Y. Gao, X. Zhu, P. Wang, Z. Shi and Q. Liu, RSC Adv., 2017, 7, 25220–25228 RSC.
- A. Schena and K. Johnsson, Angew. Chem., 2014, 126, 1326–1329 CrossRef.
- J. Chang, H. Li, T. Hou and F. Li, Biosens. Bioelectron., 2016, 86, 971–977 CrossRef CAS.
- X. Yan, Y. Song, X. Wu, C. Zhu, X. Su, D. Du and Y. Lin, Nanoscale, 2017, 9, 2317–2323 RSC.
- P. Ni, Y. Sun, H. Dai, W. Lu, S. Jiang, Y. Wang, Z. Li and Z. Li, Sens. Actuators, B, 2017, 240, 1314–1320 CrossRef CAS.
- Y. Panraksa, W. Siangproh, T. Khampieng, O. Chailapakul and A. Apilux, Talanta, 2018, 178, 1017–1023 CrossRef CAS.
- H. D. Cancar, S. Soylemez, Y. Akpinar, M. Kesik, S. Göker, G. Gunbas, M. Volkan and L. Toppare, ACS Appl. Mater. Interfaces, 2016, 8, 8058–8067 CrossRef.
- L. Saa, R. Grinyte, A. Sánchez-Iglesias, L. M. Liz-Marzán and V. Pavlov, ACS Appl. Mater. Interfaces, 2016, 8, 11139–11146 CrossRef CAS.
- M. Wang, X. Gu, G. Zhang, D. Zhang and D. Zhu, Langmuir, 2009, 25, 2504–2507 CrossRef CAS.
- D. Liu, W. Chen, Y. Tian, S. He, W. Zheng, J. Sun, Z. Wang and X. Jiang, Adv. Healthcare Mater., 2012, 1, 90–95 CrossRef CAS.
- Q. Yao, B. Lü, C. Ji, Y. Cai and M. Yin, ACS Appl. Mater. Interfaces, 2017, 9, 36320–36326 CrossRef CAS.
- M. C. Yeung and V. W. Yam, Chem. Soc. Rev., 2015, 44, 4192–4202 RSC.
- X. Zhou, X. Su, P. Pathak, R. Vik, B. Vinciguerra, L. Isaacs and J. Jayawickramarajah, J. Am. Chem. Soc., 2017, 139, 13916–13921 CrossRef CAS.
- H. Huang, X. Yang, K. Wang, Q. Wang, Q. Guo, J. Huang, J. Liu, X. Guo, W. Li and L. He, Talanta, 2015, 144, 529–534 CrossRef CAS.
- D. Guo, V. D. Uzunova, X. Su, Y. Liu and W. M. Nau, Chem. Sci., 2011, 2, 1722–1734 RSC.
- X. Wang, K. Koh and H. Chen, Sens. Actuators, B, 2017, 251, 869–876 CrossRef CAS.
- P. R. Carlier, D. Du, Y. Han, J. Liu and Y. Pang, Bioorg. Med. Chem. Lett., 1999, 9, 2335–2338 CrossRef CAS.
- M. I. Rodríguez-Franco, M. I. Fernández-Bachiller, C. Pérez, B. Hernández-Ledesma and B. Bartolomé, J. Med. Chem., 2006, 49, 459–462 CrossRef.
Footnote |
| † Electronic supplementary information (ESI) available. See DOI: 10.1039/c8ra06165c |
| This journal is © The Royal Society of Chemistry 2018 |