DOI:
10.1039/C8RA06361C
(Paper)
RSC Adv., 2018,
8, 33542-33550
Effects of hydrotalcite on rigid polyurethane foam composites containing a fire retarding agent: compressive stress, combustion resistance, sound absorption, and electromagnetic shielding effectiveness
Received
28th July 2018
, Accepted 29th August 2018
First published on 1st October 2018
Abstract
Polyether polyol, isocyanate, and a flame retardant (10 wt%), hydrotalcite (0, 1, 3, 5, 7, and 9 wt%) are used to form a rigid PU foam, while a nylon nonwoven fabric (400 g m−2) and a polyester aluminum foil are combined to serve as the panel. The rigid PU foam and the panel are then combined to form the rigid foam composites. The cell structure, compressive stress, combustion resistance, thermal stability, sound absorption, and electromagnetic shielding effectiveness of the rigid foam composites are evaluated, examining the effects of using hydrotalcite. When the hydrotalcite is 5 wt%, the rigid foam composites have an optimal density of 0.168 g cm−3, an average cell size of 0.2858 mm, a maximum compressive stress of 479.95 kpa, an optimal LOI of 29, an optimal EMSE of 45 dB, and the maximum thermal stability and sound absorption.
1. Introduction
Polyurethane (PU) foam is one of the most important thermoset polymers, and a type of polymeric material consisting of a chain with repeating units that have a characteristic urethane group. PU foam is commonly composed of isocyanates and polyols.1 Compared to other insulating materials, rigid PU foams have higher thermal stability, dimensional stability, and thermal conductivity, and thus have been widely used as an insulating material in the building and construction industries, civil engineering and machinery fields.2,3 The structure of polyol, isocyanate and the NCO/OH molar ratio determine the properties of rigid PU foams.4 However, PU foams also have disadvantages, such as being porous, having an open-cell structure, low density, and peculiar chemical structure, which make them highly flammable and limit their applications.5 The combustion of PU foams produces toxic smoke composed of HCN and CO, which can cause potential hazards to health. Inhaling smoke is the major cause of death during fires.6,7 Hence, the development of flame retardant materials inevitably arouses remarkable attention and is highly demanded by specific industries, such as the construction field. As a result, it is significant for PU foam to be flame retardant. Using fire retarding agents is one measure to provide polymers with combustion resistance. Fire retarding agents can be divided into reactive and additive types,8 and the former of which is the most effective and economical method to render PU foams with combustion resistance and safe assurance. In addition, common fire retarding agents contain compounds of halogen, phosphorus, and nitrogen element, but halogen-based fire retarding agents have been banned because it is toxic to inflict hazard to the environment and human health.9,10 By contrast, intumescent and phosphorus fire retarding agents do not produce toxic smokes and are thus popular substitutes.11,12
Regarding the application of nano inorganics in polymers, PU foam nanocomposites have aroused considerable attention due to the greater mechanical, thermal and flame retardant properties in comparison to neat PU foam,13 and are better synthesized with phosphorus, nitrogen and silicon containing compounds, nano-sized silicate layered compounds, and anionic clays.14 PU foam nanocomposites are considered eco-friendly flame retardant as they release non-combustible and non-toxic compounds, which can dilute the generated combustible compounds during the combustion.15 Hydrotalcite is a stratiform double hydroxide with a chemical formula of [M1−x2+Mx3+(OH)2]x+(Ax/nn−)·mH2O, as a mixed valence of bivalence metallic ions (Ca2+, Mg2+, Mn2+, Fe2+, Zn2+) and trivalence metallic ions (Al3+, Fe3+, and Ni3+) at an x range between 0.20 and 0.33.16 Ascribed to the co-existence of anions, crystal water, and OH− along the stratiform space, LDH has flame retardant property and releases non-combustible gases, which commonly are CO2 and H2O, and can serve as the combustible compound diluter. Moreover, LDH releases hydroxyl groups and interlayer water to cool parts of combusted materials.17
Gómez-Fernández et al. modified hydroxide with two different phosphorus containing anions, and found that the foam of LDH-HDEHP had significantly lower heat release rate on the second stage of degradation.18 They also studied the effects of different types of layered double hydroxides on flexible polyurethane foams. The test results showed that hydroxide delayed the thermal degradation of flexible PU foams and decreased the total heat release and heat release capacity.19 Moreover, Sun et al. investigated isocyanate-based polyimide foams (PIFs) with different dosages of liquid tri (1-chloro-2-propyl) phosphate (TCPP) and micro-sized hydrotalcites (LDHs) particles alone, as well as different mixing ratios of TCPP to LDHs. They found that the fire resistance of the isocyanate-based PIFs prepared with 10% of TCPP and 10% of LDHs was obviously enhanced. In particular, the LOI was enhanced by 29.4%, and the peak of heat release rate (PHRR) decreased by 36.1%.20 Additionally, Czupryński et al. indicated that when talc was introduced into the foam composition, softening point and temperatures of the beginning of change in foam mass, decomposition and quick decomposition had been improved.21 However, when investigating the influence of hydrotalcite on the combustion resistance, few studies also examined its influence on the sound absorption of PU foam or produced PU foam with electromagnetic shielding effectiveness (EMSE). Hence, this study proposes sandwich-structured composites made of rigid PU foam, nylon nonwoven fabrics, and PET aluminum foils, and the composites have good combustion resistance, good EMSE, and high thermal insulating properties. This study aims to improve the sound absorption and combustion resistance of hard PU foam while retaining good mechanical properties and fine EMSE.
2. Experimental section
2.1. Materials
Polyether polyol (Zhejiang Mingyu Chemical, China) has an orange shade, hydroxyl number of 20 mg of KOH per g, and a molecular weight of 6000. Isocyanate (Zhejiang Mingyu Chemical, China) is burnt sienna and has a specific weight of 1.25. Fire retarding agent (FR-047, Guang Long Xing, Taiwan) is a 100% organic phosphate mixture. Hydrotalcite (Shandong Yousuo Chemical Technology, China) has an average particle size 6 μm. Nylon nonwoven fabric (HSINNJY Nonwoven, Taiwan) has a specification of 400 g m−2. Polyester aluminum foil (Ginkgo Film Coating Technology, Taiwan) has a thickness of 23 μm and the aluminum coating thickness is between 400 and 450 Å. Waterborne polyurethane (718) is purchased from Shenzhen Ruiqi European Chemicals, China.
2.2. Preparation of composite materials
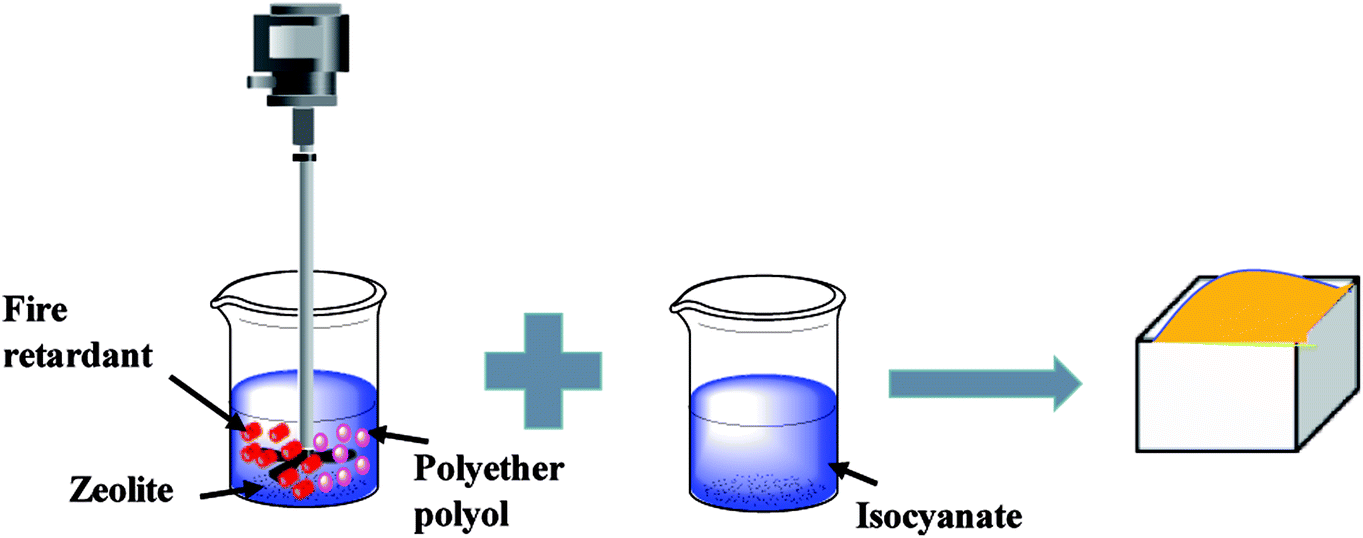
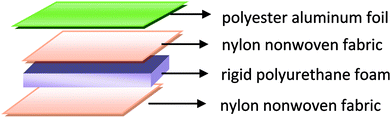
In the first stage, the PET aluminum foils are processed as follows. Waterborne polyurethane is evenly smeared over the polyester (PET) aluminum foil at a room temperature, and then combined with a nylon nonwoven fabric. The laminates are dried at 90 °C in a high-temperature blast oven (Tianjin Tongda Experimental Electric Furnace, China) for five minutes. In the second stage, the PU mixture is formulated. A specified amount of polyether polyol, FR-047 fire retarding agent (10 wt%), and hydrotalcite (0, 1, 3, 5, 7, and 9 wt%) are blended at 1200 rpm min−1 for 15 minutes using a servo electric stirrer (S569T2/A3 DC, Shandong Xianghe Group, China). Isocyanate at the same quantity as polyether polyol is added to the mixture and blended at 1200 rpm min−1 for another 16 seconds. Finally, a PET aluminum foil, the PU mixture, and a nylon nonwoven fabric are made into the composite as follows (Scheme 1). A nylon nonwoven fabric is laid in a mold of 350 mm × 330 mm × 20 mm, after which the mixture is infused and then covered by a PET aluminum foil and then another nylon nonwoven fabric for the one-step molding (Fig. 1). The sandwich-structured rigid foam composite are removed after one hour and serve as the experimental group. The sandwich structure of rigid foam composite is shown in Fig. 2. The blank group used in EMSE test is a pure rigid PU foam without a PET aluminum foil.
 |
| | Fig. 1 Schematic diagram of the composition of rigid foam composite. | |
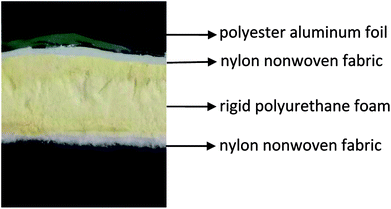 |
| | Fig. 2 Sandwich structure of rigid foam composite. | |
 |
| | Scheme 1 The synthesis of rigid polyurethane foam. | |
2.3. Measurements and characterization
2.3.1. Scanning electron microscopy (SEM). The morphology of the original samples was examined with a scanning electron microscope (TM3030, HITACHI, Japan). All materials were cut into fragments and then sputter-coated with gold for SEM observations. The accelerating voltage was 15 kV and the magnification was set at 60×. The images of surface topography were analyzed by Image-Pro Plus 6.0 to obtain the cell diameter.
2.3.2. Density measurement. The density of samples was measured as specified in GB/T 6343-1995. Samples had a size of 50 mm × 50 mm × 20 mm. The volume of each sample was measured at five spots randomly using a vernier caliper, while the mass of samples were weighed using an electronic balance (Shanghai PuChun Measure Instrument, China) in order to compute the density.
2.3.3. Compressive stress test. The compressive stress of samples was measured at a tensile rate of 5 mm min−1 using a universal testing machine (HT-2402, Hong Ta Instrument, Taiwan) as specified in ASTM D1621-1. Samples had a size of 50 mm × 50 mm × 20 mm. Five samples for each specification were used for the test.
2.3.4. Thermo gravimetric analysis (TGA). The thermogravimetric measurement was conducted with a thermogravimetric analyzer (TG 209F3, NETZSCH, Germany) with dry nitrogen gas at a flow rate of 60 mL min−1. The relative mass loss of the samples was recorded from 50 °C to 800 °C at a heating rate of 10 °Cmin−1.
2.3.5. Limiting oxygen index measurement. The Flame retardance and combustion behaviors was conducted using a ZKHW-205 intelligent oxygen index instrument (Qingdao Zhongke Hengwei Intelligent Technology Co., Ltd., China). The test was measured according to ASTMD2863. Size of the specimens for the measurement was 127 mm × 10 mm × 10 mm.
2.3.6. Morphological observation of char layers. The char layers of the samples after LOI test were investigated by using a scanning electron microscope (TM3030, HITACHI, Japan). All materials were cut into fragments and then sputter-coated with gold for SEM observations. The accelerating voltage was 15 kV and the magnification was set at 40× and 400×.
2.3.7. Sound absorption measurement. The sound absorption of samples was measured at a frequency of 100–4000 Hz using an incorporating twin-microphone impedance tube (Automotive Research & Testing Center, Taiwan) as specified in ASTM E1050-07. The samples had a cylindrical shape with a diameter of 38 mm. The air chamber sizes (the distance between the sample and the bottom of the tube) were 10 mm lengthwise. Three samples for each specification were used for the test. The curve chart was plotted and graphed by the tester.
2.3.8. Electromagnetic shielding effectiveness (EMSE). The EMSE of samples was measured at frequencies between 600 MHz and 3 GHz using an EMSE tester (EM-2107A, TS RF Instrument Co., Ltd., Taiwan) as specified in ASTM D4935. The microcellular foams were cut into cylinder plates with a diameter of 80 mm. The thickness of the samples was 20 mm.
3. Results and discussion
3.1. Effect of hydrotalcite content on cell morphology
Fig. 3 and Table 1 show that the rigid foam composites are composed of close cells and there are no significant collapses. The cell diameter decreases as the hydrotalcite content increases, and has a distribution between 0.2422 and 0.4307 mm. Without hydrotalcite, the composites have the maximum cell size, which is 0.4307 mm. The cell size is 0.3009 mm when hydrotalcite is 1 wt%, and then gradually decreases when hydrotalcite is 3 and 5 wt%. When hydrotalcite is 9 wt%, the cell size is 0.2422 mm which is comparable to that when hydrotalcite is 7 wt%. Small-sized additives act as nucleation agents that accelerate the cell nucleation because they only require small amount of energy to create bubbles. Based on the homogeneous nucleation theory, the formation of bubbles in a liquid is correlated with a change in Gibbs free energy. Solid elements that are added to a mixture, such as nanoparticles, tend to decrease the value of ΔG and thus improve the nucleation.22,23
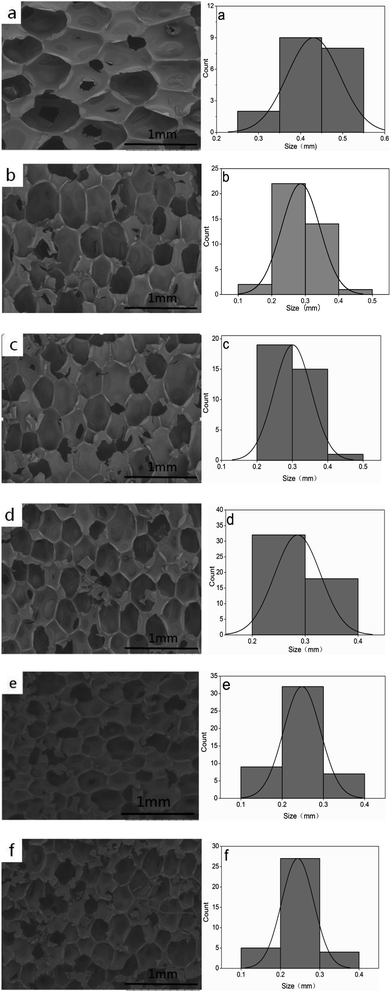 |
| | Fig. 3 The morphology of rigid foam composites as related to (a) 0, (b) 1, (c) 3, (d) 5, (e) 7, and (f) 9 wt% of hydrotalcite. | |
Table 1 The cell diameter of rigid foam composites as related to hydrotalcite content
| Hydrotalcite content (wt%) |
Cell diameter (mm) |
Standard deviation |
| 0 |
0.4307 |
0.060789 |
| 1 |
0.3009 |
0.051808 |
| 3 |
0.2920 |
0.043851 |
| 5 |
0.2858 |
0.043037 |
| 7 |
0.2480 |
0.044335 |
| 9 |
0.2422 |
0.041452 |
3.2. Effect of hydrotalcite content on density and compressive stress of rigid foam composites
Fig. 4 shows the compressive stress–strain curves of rigid foam composites based on the content of hydrotalcite, which contain three phases, including the elastic phase, the platform stage, and the dense stage.22 The compressive stress first increases and then decreases when the hydrotalcite increases. The minimum and maximum compressive strength of 325.11 kpa and 479.95 kpa occur when the hydrotalcite is 0 wt% and 5 wt%, and the latter of which is 47.63% higher. In light of Table 2, the density of rigid foam composites is proportional to the content of hydrotalcite. The mechanical properties of the composites highly depends on the density, and the higher the density, the greater the compressive stress. In addition, a small amount of hydrotalcite provides the system with a relatively higher stiffness. Moreover, hydrotalcite has active hydroxyl groups that respond to MDI to form a cross-linking network absorbed in the matrix, thereby strengthening the compressive stress.24 By contrast, a great amount of hydrotalcite can be partially accumulated in cells and prevent the cells from evenly growing. The cells thus have internal structural defects, which is detrimental to the compressive stress of the rigid foam composites.25
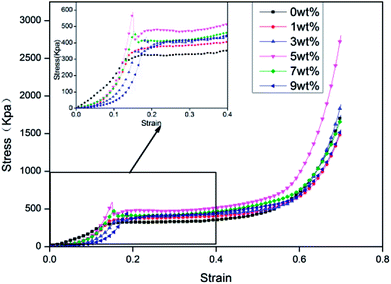 |
| | Fig. 4 The compressive stress–strain curves of rigid foam composites as related to different contents of hydrotalcite. The fire retarding agent is specified as 10 wt%. | |
Table 2 The density of rigid foam composites as related to hydrotalcite content
| Sample (wt%) |
Density (g cm−3) |
Standard deviation |
| 0 |
0.145 |
0.01536 |
| 1 |
0.157 |
0.01375 |
| 3 |
0.162 |
0.01258 |
| 5 |
0.168 |
0.01658 |
| 7 |
0.172 |
0.01439 |
| 9 |
0.175 |
0.02235 |
3.3. Effect of hydrotalcite content on thermal behavior
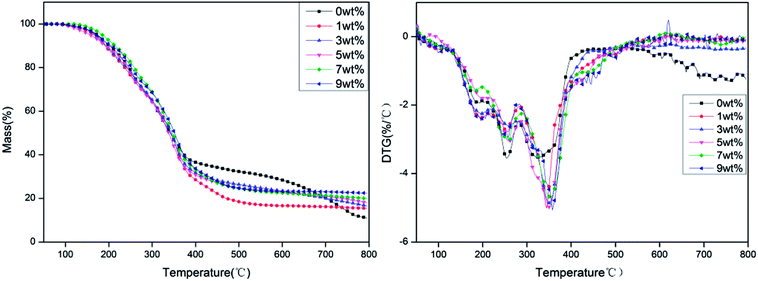
The TG and DTG curves of rigid foam composites with different proportions of hydrotalcite under a nitrogen atmosphere are shown in Fig. 5. Fig. 5 and Table 3 show that the carbon residue increases as a result of a raise in hydrotalcite. The presence of hydrotalcite adversely affects the decomposition of rigid foam composites, which in turn increases the carbon residue. Namely, hydrotalcite is effective in a condensed phase. Regardless of the content of hydrotalcite, the rigid foam composites show peak weight losses at three temperature rages: 170–230 °C, 230–300 °C, and 310–400 °C. The first peak weight loss indicates the evaporation of the fire retarding agent, the second one indicates the decomposition of the urethane bonds that the rigid foams contain, and the third one indicates the thermal depolymerization reaction of polyisocyanates and polyols, which releases some gaseous products.26–28 To sum up, the addition of hydrotalcite heightens the initial decomposition temperature of the rigid foam composites, suggesting that using hydrotalcite improves the thermal stability of rigid foam composites.
 |
| | Fig. 5 TG and DTG curves of rigid foam composites as related to different contents of hydrotalcite under a nitrogen atmosphere. The fire retarding agent is specified as 10 wt%. | |
Table 3 TG and DTG data of rigid foam composites as related to different content of hydrotalcite under a nitrogen atmosphere
| |
T 5 wt% (°C) |
Tmax1 (°C) |
Tmax2 (°C) |
Tmax3 (°C) |
Residue at 800 °C (%) |
| 0 wt% |
153.5 |
193.2 |
251.8 |
322.3 |
11.01 |
| 1 wt% |
158.4 |
198.1 |
256.4 |
344.9 |
15.40 |
| 3 wt% |
162.2 |
198.3 |
259.4 |
349.9 |
16.58 |
| 5 wt% |
164.6 |
198.5 |
259.8 |
349.9 |
18.00 |
| 7 wt% |
166.9 |
192.4 |
260.5 |
352.5 |
19.96 |
| 9 wt% |
167.5 |
198.6 |
256.8 |
357.8 |
22.47 |
Based on the DTG curves, more hydrotalcite delays the decomposition of rigid PU foams at three phases, which is ascribed to the reaction between the fire retarding agent and hydrotalcite. The reaction causes non-reactive gas to dilute the concentration of reactive gas, which subsequently quenches the flammable active elements in the matrix and inhibits the decomposition intensity of the matrix.29 The fire retarding agent decomposes into phosphorus acids that are retained in the rigid PU foams. A sufficient amount of phosphate ester triggers effective catalysis of char formation. Meanwhile, the interaction between the decomposed product of hydrotalcite and the fire retarding agent further forms a more condense protective char layer. Furthermore, DTG chart also shows increasing the hydrotalcite eventually causes a significantly lower rate of weight loss at the third phase, which is due to the decomposition of flame retardant and hydrotalcite. While the fire retarding agent regrades, it releases PO free radicals under a non-oxidative atmosphere,30 yielding the same effect of quenching the inflammable active elements and delaying the decomposition intensity of the matrix.
3.4. Effect of hydrotalcite content on LOI
Fig. 6 shows the LOI curve of rigid foam composites, increasing from 26 to 30.
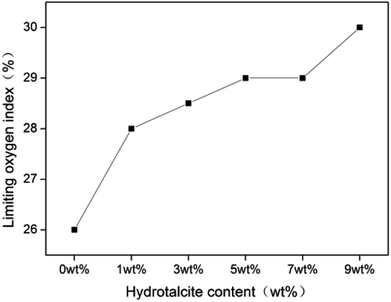 |
| | Fig. 6 LOI curve of rigid foam composites as related to different contents of hydrotalcite. The fire retarding agent is specified as 10 wt%. | |
The addition of 1 wt% of hydrotalcite enhances the LOI to 28, a high combustion resistance, indicating that adding hydrotalcite improves the combustion resistance to a certain extent. The P–O–C of the fire retarding agent break at the beginning of a burning status, and the decomposed product becomes the effective char-forming agent.31 As a result, the swiftly decomposed product produces char that forms a dense char layer, serving as a barrier against heat and O2 and retarding the heat transmission to the interior of the composites.32 Table 2 shows that the char layer is in proportion to the content of hydrotalcite, suggesting that hydrotalcite at a condensed phase effectuates flame retardant function. Additionally, the reaction between hydrotalcite and the fire retarding agent contributes to a denser protective char layer.
3.5. Morphological observation of char layer
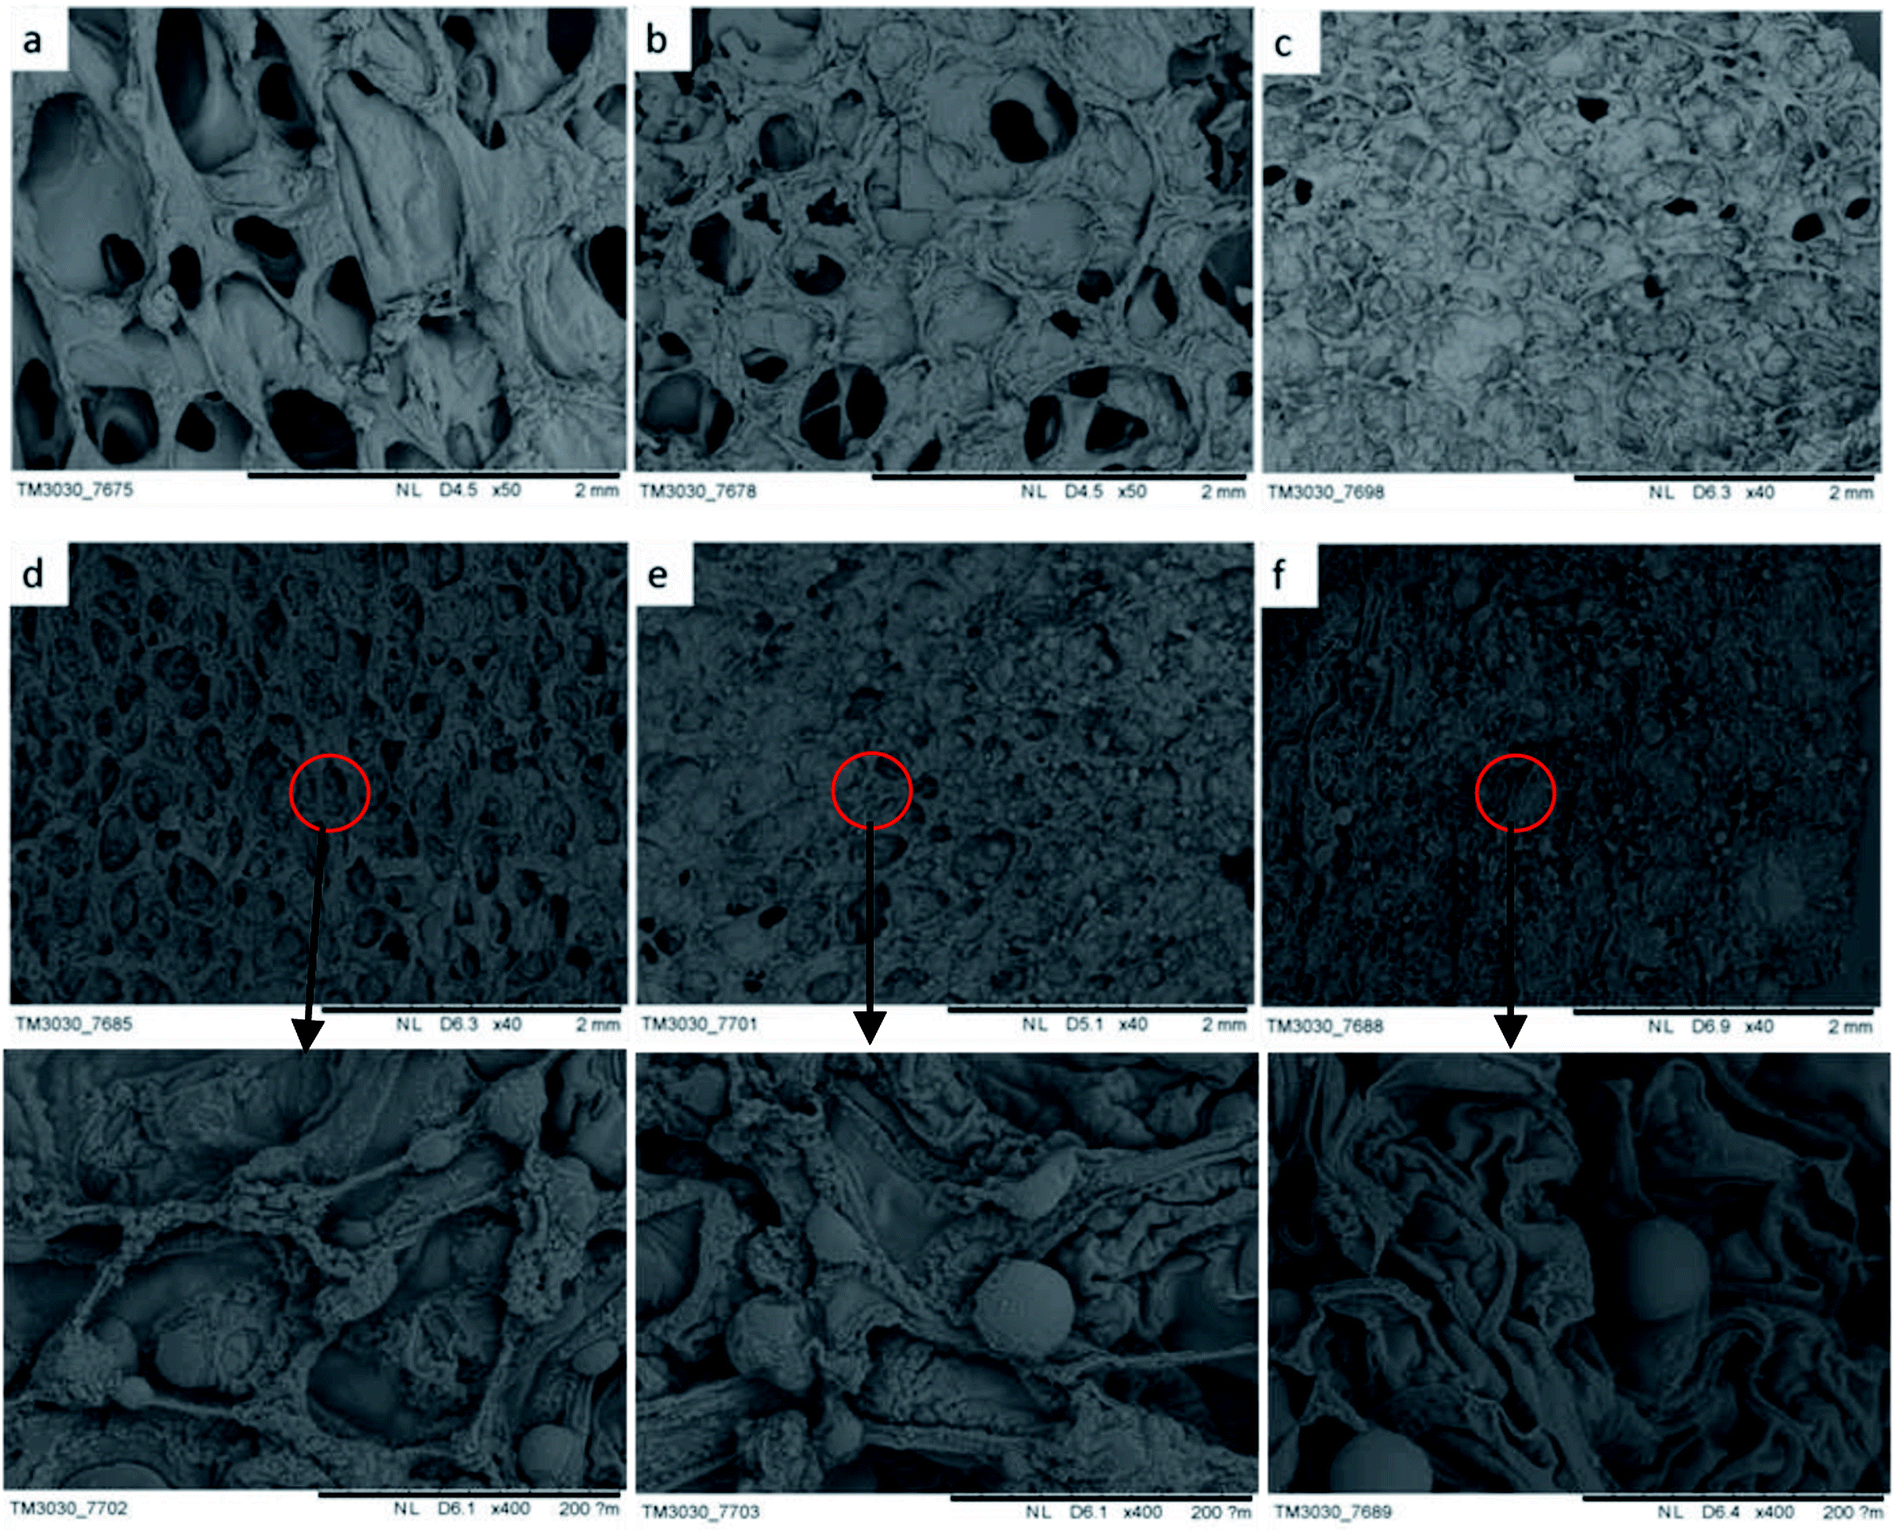
The morphology of char influences the combustion resistance and thermal stability of rigid foam composites when set alight. According to the SEM observation on the residue chars after LOI tests, it better explicates how hydrotalcite improves the combustion resistance of the matrix owing to the special char morphology. As seen in Fig. 7(a) and (b), rigid foam composites forms a loose char layer with a lot of micro holes. Thus, the flame and heat are transferred easily inside the sample and the flammable volatiles can penetrate the char layer into flame zone during combustion, which cannot stop further degradation of the interior. However, the char layer becomes dense to hinder heat and mass transfer between the gas and the condensed phases, which in turn prevents the underlying polymeric substrate from further attack by a heat flux with increased hydrotalcite content.33 As seen in Fig. 7(d–f), the dense carbon protective layer caused by the hydrotalcite and the fire retarding agent during combustion forms an intumescent protection to refrain the transmission of heat and mass from the polymer matrix to the heat source preventing further decomposition.34 Excessive hydrotalcite forms spherical object covering the cells during the combustion, protecting the underneath matrix.
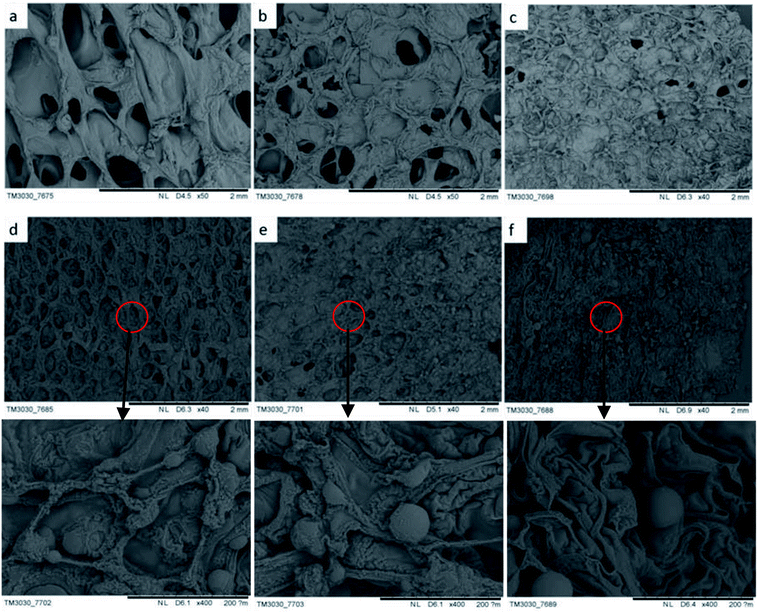 |
| | Fig. 7 SEM images of the char layers of rigid foam composites after the LOI test as related to hydrotalcite content of (a) 0, (b) 1, (c) 3, (d) 5, (e) 7, and (f) 9 wt%. | |
3.6. Effect of hydrotalcite content on sound absorption
Fig. 8 shows that the rigid foam composites have sound absorption characteristic peaks that aggregate between 1200 Hz and 3100 Hz with a maximum sound absorption coefficient of 0.53–0.65. The sound absorption coefficient is 0.65 and 0.6 when the hydrotalcite is 1 wt% and 5 wt%, respectively. The sound absorption coefficient is highly related to the morphological and physical properties of the foam materials. The morphology of foam determines the dissipate measure of acoustic energy caused by the collision between air molecules, chamber, and porous structure. In addition, the physical strength of PU foams also affects the dissipation level of acoustic energy when air molecules collide with foam walls and cause deformation.35–40
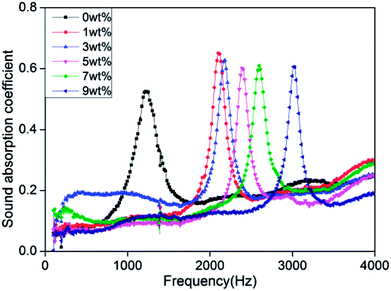 |
| | Fig. 8 Sound absorption performance curve of rigid foam composites as related to different contents of hydrotalcite. The air chamber size is 10 mm lengthwise. The fire retarding agent is specified as 10 wt%. | |
Sound absorption coefficient (α) is defined as the ratio of the non-reflected acoustic energy to the incident energy into the surface of composites, α = (Iincident − Ireflected)/Iincident, where Iincident and Ireflected represent the incident and reflected energy.41 Hydrotalcite is mainly to fill the cell walls, strengthening the cell walls. When the acoustic energy enters the cells, the air molecules collide with the foam walls to debilitate more energy, which subsequently increases the sound absorption coefficient. Hence, sound absorption peak frequency of rigid foam composites depends on a compact structure considerably.42 In addition, the sound absorption peak shifts toward the high frequencies when hydrotalcite increases. High-frequency sound waves have short wavelengths, and small cell size allows short wavelength sound waves to penetrate, thereby dissipating the high-frequency acoustic energy.
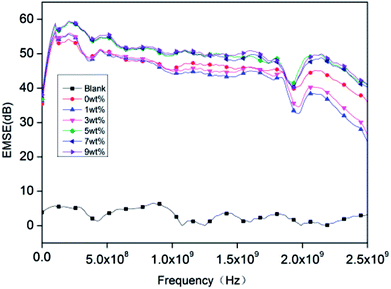
3.7. Effect of PET aluminum foil on EMSE
Fig. 9 shows that the EMSE of rigid PU foam reaches above 45 dB at frequencies of 600 MHz to 2.5 GHz. The blank group is pure rigid PU foam whose EMSE is lower than 10 dB and barely shields the electromagnetic waves. The EMI SE equals to sum of the shielding due to absorption (SEA), shielding due to reflection (SER) and shielding due to the multiple reflection (SEM), i.e., SE = SEA + SER + SEM.43–45| |
SEA(dB) = −10![[thin space (1/6-em)]](https://www.rsc.org/images/entities/char_2009.gif) log(1 − Aeff) = −10log(T/(1 − R)) log(1 − Aeff) = −10log(T/(1 − R))
| (1) |
| | |
SER(dB) = −10log(1 − R)
| (2) |
| | |
SEM(dB) = −20log(1 − 10−SEA/10)
| (3) |
where, R and T are the reflectance and transmittance respectively. The contribution of SEM is negligible if SE is ∼10 dB. The effective absorbance (Aeff) is given by, Aeff =(1 − R − T)/(1 − R), conventionally.46
 |
| | Fig. 9 The EMSE performance of rigid foam composites as related to different contents of hydrotalcite. The fire retarding agent is specified as 10 wt%. The blank group is without a polyester aluminum foil. | |
EMI shielding effectiveness is dependent on several factors which are frequency of the incident electromagnetic field, shield material parameters, shield thickness, distance from source to shield and shielding degradation. The incident electromagnetic wave generates an electric field over the conducting PET aluminum foil surface opposite to applied field as the electron cloud near the surface gets distorted and it passes through the rigid foam composite by changing its time average power. In case of conducting materials (metals), EMI shielding mainly depends on conductivity and thickness. The important parameter for EMI shielding due to absorption is skin depth he distance up to which the intensity of the electromagnetic wave decreases to 1/e of its original strength, along with other parameters.46,47 The rigid foam composites have good conductivity and permeability compared to the blank group, so they have better electromagnetic shielding effect.
The multilayer structure is one of the ways to improve shielding effectiveness, because the presence of layers permits to increase the multi-reflection mechanism which increases the total reflection. This leads to increase the total shielding effectiveness. The shielding effect is affected by the i-layer permeability, conductivity and permittivity. The intrinsic impedance of the i-layer depends on the frequency of the incident wave. The reflection loss presented caused by the mismatch impedance between the PET aluminum film and other layer. This mismatch impedance increases the multi-reflection mechanism. Therefore the presence of multi-reflection increases the total reflection inside the material.48,49 Moreover the rigid foam composites have excellent electrical and dielectric constants compared to the blank group. And the incident electromagnetic waves phase changes and magnitude decreases exponentially. In addition to this, the possibility of incident EM radiation is large and since the incident electromagnetic energy is converted into a dissipative which value decreases exponentially with propagation due to the interfacial electric polarization and dielectric loss of PET aluminum foil. As discussed above, the effective EMI shielding due to absorption is controlled by the EM attenuation constant (α) along with impedance matching (for impedance matching, the complex permittivity and complex permeability should be equal).50,51 Attenuation of electromagnetic wave energy stems from three mechanisms: (1) incident energy is reflected by the surface of the shield because of the impedance discontinuity of the air-metal boundary. This mechanism does not require a particular material thickness, but simply an impedance discontinuity. (2) Energy that does not cross the shield surface, which is not reflected but is attenuated when penetrating through the shield. (3) The energy that reaches the opposite face of the shield encounters another air-metal boundary, and thus some of it is reflected back into the shield.52
4. Conclusions
This study produces rigid foam composites with polyether polyol, isocyanate, a fire retarding agent, hydrotalcite, and a PET aluminum foil of 400 g m−2, and investigating the cell structure, compressive stress, thermal stability, combustion resistance, and EMSE of the composites. The test results show that the more the hydrotalcite, the smaller the cell size. The cells have an even formation when containing 5 wt% of hydrotalcite, and the rigid PU foam has a high density when containing more hydrotalcite. A small amount of hydrotalcite increases the compressive stress, but excessive hydrotalcite adversely affects the compressive stress. Moreover, the addition of hydrotalcite increases the char residue, delays the decomposition temperature, strengthens the thermal stability, and improves the sound absorption. The sound absorption peaks shift toward high frequencies when the composite consists of more hydrotalcite. When 5 wt% of hydrotalcite is used, the rigid foam composites have the optimal LOI of 29, the maximum compressive strength of 479.95 kpa which is 47.63% greater than that of the control group, the sound absorption coefficient of 0.60, and EMSE of 45 dB.
Conflicts of interest
There are no conflicts to declare.
Acknowledgements
This research project was financially supported by the Open Project Program of High-Tech Organic Fibers Key Laboratory of Sichuan Province [grant numbers PLN2016-07]; and National Natural Science Foundation of China [grant numbers 51503145], and the Natural Science Foundation of Fujian (2018J01504, 2018J01505). We would also acknowledgement the Opening Project of Green Dyeing and Finishing Engineering Research Center of Fujian University (2017001A, 2017001B, 2017002B), Natural Science Foundation of Tianjin (18JCQNJC03400) and the Program for Innovative Research Team in University of Tianjin (TD13-5043).
References
- M. M. Hirschler, Polym. Adv. Technol., 2008, 19, 521–529 CrossRef CAS.
- H. W. Engels, H. G. Pirkl, R. R. Albers, W. Albach, J. Krause, A. Hoffmann, H. Casselmann and J. Dormish, Angew. Chem., Int. Ed., 2013, 52, 9422–9441 CrossRef CAS PubMed.
- B. Czupryński, J. Paciorek-Sadowska and J. Liszkowska, J. Appl. Polym. Sci., 2010, 115, 2460–2469 CrossRef.
- A. Naruse, H. Nanno, M. Kurita, H. Inohara and T. Fukami, J. Cell. Plast., 2002, 38, 385–401 CrossRef CAS.
- J. Lefebvre, B. Bastin, M. L. Bras, S. Duquesne, C. Ritter, R. Paleja and F. Poutch, Polym. Test., 2004, 23(3), 281–290 CrossRef CAS.
- A. A. Stec and T. R. Hull, Energy Build., 2011, 43(2), 498–506 CrossRef.
- H. M. Stapleton, S. Klosterhaus, S. Eagle, J. Fuh, J. D. Meeker, A. Blum and T. F. Webster, Environ. Sci. Technol., 2009, 43(19), 7490–7495 CrossRef CAS PubMed.
- R. Yang, W. T. Hu, L. Xu, Y. Song and J. C. Li, Polym. Degrad. Stab., 2015, 122, 102–109 CrossRef CAS.
- M. Jimenez, N. Lesaffre, S. Bellayer, R. Dupretz, M. Vandenbossche, S. Duquesne and S. Bourbigot, RSC Adv., 2015, 5, 63853–63865 RSC.
- X. L. Wang, K. K. Yang and Y. Z. Wang, J. Appl. Polym. Sci., 2001, 82, 276–282 CrossRef CAS.
- J. Green, J. Fire Sci., 1996, 14(6), 426–442 CrossRef CAS.
- J. Green, J. Fire Sci., 1992, 10(6), 470–487 CrossRef CAS.
- M. Modesti, A. Lorenzetti, S. Besco, D. Hrelja, S. Semenzato, R. Bertani and R. A. Michelin, Polym. Degrad. Stab., 2008, 93(12), 2166–2171 CrossRef CAS.
- W. Zatorski, Z. K. Brzozowski and A. Kolbrecki, Polym. Degrad. Stab., 2008, 93(11), 2071–2076 CrossRef CAS.
- D. Yue, O. Oribayo, G. L. Rempel and P. Qinmin, RSC Adv., 2017, 7, 30334–30344 RSC.
- W. Yang, Y. Kim, P. K. Liu, M. Sahimi and T. T. Tsotsis, Chem. Eng. Sci., 2002, 57(15), 2945–2953 CrossRef CAS.
- F. Cavani, F. Trifirò and A. Vaccari, Catal. Today, 1991, 11, 173–301 CrossRef CAS.
- S. Gómez-Fernández, L. Ugarte, C. Peña-Rodriguez, M. Zubitur, M. Á. Corcuera and A. Eceiza, Appl. Clay Sci., 2016, 123, 109–120 CrossRef.
- S. Gómez-Fernández, L. Ugarte, C. Peña-Rodriguez, M. A. Corcuera and A. Eceiza, Polym. Degrad. Stab., 2016, 132, 41–51 CrossRef.
- G. Sun, L. Liu, J. Wang, H. L. Wang, W. P. Wang and S. H. Han, Polym. Degrad. Stab., 2015, 115, 1–15 CrossRef CAS.
- B. Czupryński, J. Paciorek-Sadowska and J. Liszkowska, J. Appl. Polym. Sci., 2010, 115(4), 2460–2469 CrossRef.
- C. Lorusso, V. Vergaro, F. Conciauro, G. Ciccarella and P. M. Congedo, Nanomater. Nanotechnol., 2017, 7, 1–9 Search PubMed.
- L. Shi, Z. M. Li, M. B. Yang, B. Yin, Q. M. Zhou, C. R. Tian and J. H. Wang, Polym.-Plast. Technol. Eng., 2005, 44(7), 1323–1337 CrossRef CAS.
- F. Luo, K. Wu, H. Guo, Q. Zhao, L. Y. Liang and M. G. Lu, J. Therm. Anal. Calorim., 2015, 122(2), 717–723 CrossRef CAS.
- D. V. Pikhurov, A. S. Sakhatskii and V. V. Zuev, Eur. Polym. J., 2017, 99, 403–414 CrossRef.
- F. F. Feng and L. J. Qian, Polym. Compos., 2014, 35(2), 301–309 CrossRef CAS.
- C. Denecker, J. J. Liggat and C. E. Snape, J. Appl. Polym. Sci., 2006, 100(4), 3024–3033 CrossRef CAS.
- L. Shi, Z. M. Li, B. H. Xie, J. H. Wang, C. R. Tian and M. B. Yang, Polym. Int., 2006, 55, 862–871 CrossRef CAS.
- Y. Liu, J. He and R. Yang, Ind. Eng. Chem. Res., 2015, 54(22), 5876–5884 CrossRef CAS.
- S. Y. Liang, P. Hemberger, N. M. Neisius, A. Bodi, H. Grutzmacher, J. L. Grutzmacher and S. Gaan, Chem.–Eur. J., 2015, 21(3), 1073–1080 CrossRef CAS PubMed.
- W. Xu, G. Wang and X. Zheng, Polym. Degrad. Stab., 2015, 111, 142–150 CrossRef CAS.
- K. Mequanint, R. Sanderson and H. Pasch, Polym. Degrad. Stab., 2002, 77(1), 121–128 CrossRef CAS.
- H. Zhu, Z. Peng, Y. Chen, G. Y. Li, L. Wang, Y. Tang, R. Pang, Z. H. Khan and P. Y. Wan, RSC Adv., 2014, 4(98), 55271–55279 RSC.
- W. J. Wang, K. He, Q. X. Dong, N. Zhu, Y. Fan, F. Wang, Y. B. Xia, H. F. Li, J. Wang, Z. Yuan, E. Wang, Z. F. Lai, T. Kong, X. Wang, H. Ma and M. S. Yang, J. Appl. Polym. Sci., 2013, 131(4), 1001–1007 Search PubMed.
- R. Gayathri, R. Vasanthakumari and C. Padmanabhan, Int. J. Eng. Sci., 2013, 4(5), 301–308 Search PubMed.
- O. Doutres, N. Atalla and K. Dong, J. Appl. Phys., 2011, 110, 064901 CrossRef.
- J. G. Gwon, S. K. Kim and J. H. Kim, Mater. Des., 2016, 89, 448–454 CrossRef CAS.
- G. Sung and J. H. Kim, J. Chem. Eng., 2017, 34(4), 1222–1228 CAS.
- J. G. Gwon, S. K. Kim and J. H. Kim, J. Porous Mater., 2016, 23, 465–473 CrossRef CAS.
- C. H. Sung, K. S. Lee, K. S. Lee, S. M. Oh, J. H. Kim, M. S. Kim and H. M. Jeong, Macromol. Res., 2007, 15, 443–448 CrossRef CAS.
- Y. Wang, C. Zhang, L. Ren, M. Ichchou, M. A. Galland and O. Bareille, Polym. Compos., 2013, 34(11), 1847–1855 CrossRef CAS.
- S. G. Mosanenzadeh, H. E. Naguib, C. B. Park and N. Atalla, Polym. Eng. Sci., 2013, 53(9), 1979–1989 CrossRef CAS.
- P. J. Bora, N. Mallik, P. C. Ramamurthy, Kishore and G. Madras, Composites, Part B, 2016, 106, 224–233 CrossRef CAS.
- P. J. Bora, K. J. Vinoy, P. C. Ramamurthy, Kishore and G. Madras, Electron. Mater. Lett., 2016, 12(5), 603–609 CrossRef CAS.
- P. J. Bora, G. Lakhani, P. C. Ramamurthy and G. Madras, RSC Adv., 2016, 6(82), 79058–79065 RSC.
- P. J. Bora, K. J. Vinoy, P. C. Ramamurthy, Kishore and G. Madras, Compos. Commun., 2017, 4, 37–42 CrossRef.
- P. J. Bora, K. J. Vinoy, P. C. Ramamurthy and G. Madras, Mater. Res. Express, 2017, 4(2), 025013 CrossRef.
- J. M. Thomassin, C. Jérôme, T. Pardoen, C. Bailly, I. Huynen and C. Detrembleur, Mater. Sci. Eng., R, 2013, 74(7), 211–232 CrossRef.
- B. Gaoui, A. Hadjadj and M. Kious, J. Mater. Sci.: Mater. Electron., 2016, 28(4), 3924–3930 CrossRef.
- P. J. Bora, M. Porwal, K. J. Vinoy, Kishore, P. C. Ramamurthy and G. Madras, Composites, Part B, 2018, 34, 151–163 CrossRef.
- P. J. Bora, K. J. Vinoy, P. C. Ramamurthy, Kishore and G. Madras, Mater. Res. Express, 2015, 2(3), 036403 CrossRef.
- R. Perumalraj and B. S. Dasaradan, Fibres Text. East. Eur., 2010, 80(3), 74–80 Search PubMed.
|
| This journal is © The Royal Society of Chemistry 2018 |
Click here to see how this site uses Cookies. View our privacy policy here. 
 Open Access Article
 This Open Access Article is licensed under a Creative Commons Attribution-Non Commercial 3.0 Unported Licence
 d,
Bing-Chiuan Shiuh,
Ching-Wen Louacefg and
Jia-Horng Lin*acfghi
d,
Bing-Chiuan Shiuh,
Ching-Wen Louacefg and
Jia-Horng Lin*acfghi