
 Open Access Article
 This Open Access Article is licensed under a Creative Commons Attribution-Non Commercial 3.0 Unported Licence
Force field induced heterogeneous molecular orientation within polyacrylonitrile monofilaments†
Yang Sha a,
Wei Liua,
Mengfan Wangb,
Jianglu Wua and
Weiyu Cao*a
a,
Wei Liua,
Mengfan Wangb,
Jianglu Wua and
Weiyu Cao*a
aState Key Laboratory of Organic-Inorganic Composites, College of Material Science and Engineering, Beijing University of Chemical Technology, Beijing 100029, China. E-mail: caowy@mail.buct.edu.cn
bDepartment of Future Industry-Oriented Basic Science and Materials, Toyota Technological Institute, Tempaku, Nagoya, 461-8511, Japan
First published on 24th September 2018
Abstract
The molecular orientation evolution in the radial direction of PAN precursor fiber is investigated by polarized Raman spectroscopy. Samples with different drawing ratios during the steam stretching process are prepared. The corresponding crystallinity distribution in the cross section is mapped by confocal Raman spectroscopy. Nano-TA is also applied to measure the thermal stability evolution along the radial direction. The results showed that the skin–core difference in terms of molecular orientation became more obvious as drawing ratio increased. The Raman mapping and nano-TA results are also consistent with this trend. Finally, a model is proposed to explain the evolution of chains with increasing drawing ratio.
Introduction
Polyacrylonitrile (PAN) based carbon fibers have been widely used in many industrial applications due to their high specific tensile strength and modulus.1,2 However, there is still a huge gap between realistic and theoretical mechanical properties. During the past few decades, revealing the relationship between microstructures and properties has always been the core subject for the purpose of improving the properties of PAN-based carbon fibers. Skin–core structure is regarded as one of the key factors that influence the resultant mechanical properties of carbon fibers. Therefore, great efforts have been contributed to investigate the mechanisms about the formation and evolution of this heterogeneous radial structure throughout the whole production process.3–6 To our best knowledge, most of these works were focused on the stabilized and carbonized PAN fibers. However, the properties of carbon fibers will be determined by the original precursor fibers' structure which could be inherited to the end. Hence, it is important to clarify the structural distribution within precursor fibers. Bai et al.7 have studied the microstructures of PAN precursor fibers in transverse and longitudinal sections via HRTEM. It was proved that PAN fibers have a two-phase structure that combines ordered and amorphous phases. However, we still have no ideas about the distribution of these microstructures along the radial direction. In our opinion, the so-called ordered and amorphous phases are proposed to be closely related to the molecular orientation which strongly enhances the mechanical properties. Conventionally, X-ray diffraction (XRD),8 selected area electron diffraction (SAED),3,4 IR spectroscopy9 and Raman spectroscopy10 are the most wildly used methods for the investigation of molecular orientation. However, normal X-ray diffraction and IR spectroscopy are only suitable to measure bundles composed of hundreds of aligned fibers because of their relatively larger beam size, preventing from drawing a statistical schematic of the evolution of structure parameters along the radial direction. Besides, although SAED has been successfully used as a semi-quantitative method to indicate the degree of layer orientation in PAN-based carbon fiber, only crystalline phase could be characterized, limiting the investigation. Furthermore, the process of preparing thin samples for SAED is quite time-consuming and complex. In recent years, polarized Raman spectroscopy has become an increasingly popular technique for molecular orientation quantification at submicrometer scale and it has nothing to do with the sample thickness.11,12 In addition, the submicrometer resolution is quite suitable for investigating microstructures evolution along the radial direction of micrometer scale PAN precursor fibers.In this paper, the distribution of molecular orientation in single filament and the influence of force field on the orientation evolution were investigated quantitatively by polarized Raman spectroscopy. The distribution of the crystallinity in cross-section was also measured by Raman mapping method, and the correlation between the crystallinity and orientation was discussed. We further confirmed the distribution by nano-TA technique. On the basis of these results, a schematic model to describe the radial distribution of molecular orientation as a function of force field was proposed.
Theoretical section
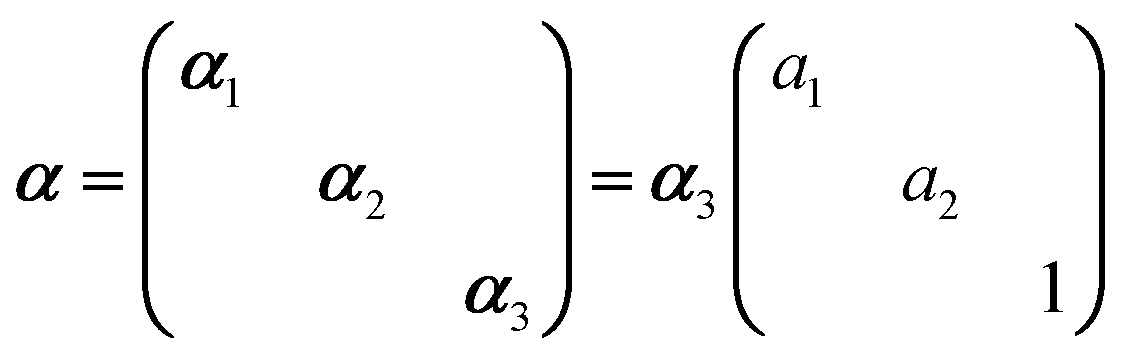
In Raman spectroscopy, the signal intensity for a given vibrational mode depends on the shape and orientation of the polarizability ellipsoid. This can be expressed by a third rank Raman tensor, α, with its principal components, α1, α2 and α3.where a1 = α1/α3 and a2 = α2/α3. Bower13 developed the theory of orientation quantification by establishing a linear relationship between the measured polarized spectral intensities (Is), the principal components of the Raman tensor, and the order parameters (〈P2〉 and 〈P4〉) according to
where I0 depends on instrumental factors such as laser power,
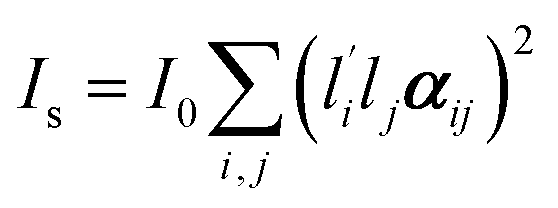
 and lj are the direction cosines of the polarization vector of the incident and scattered beam, respectively, and αij is the components of the Raman tensor expressed in the laboratory frame. For systems with uniaxial symmetry, there are only five independent and nonzero equations that contain the five unknown parameters. The so-called “complete method” involves recording 12 different Raman spectra in three distinct geometries, namely backscattering, right-angle scattering, and either right-angel scattering or backscattering with the sample at 45°.
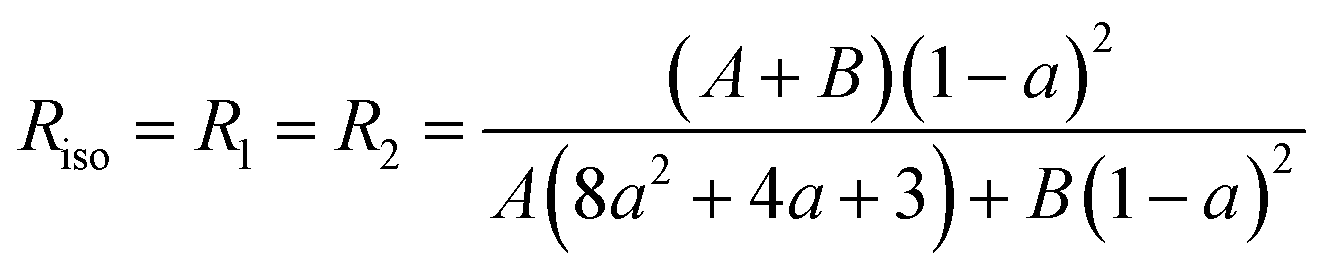
In the recent years, most of Raman orientation studies were performed with the simplified confocal Raman method, only the backscattering geometry is accessible. Therefore, a limited set of two parallel-polarized (zz and xx) and two cross-polarized (zx and xz) spectra can be measured. In this notation, the first letter corresponds to the polarization of incident beam and the second letter corresponds to the polarization of the scattered beam. Rousseau et al.14 quantified 〈P2〉 and 〈P4〉 by some approximations. Common constants can be eliminated though spectra intensity ratios R1 and R2.
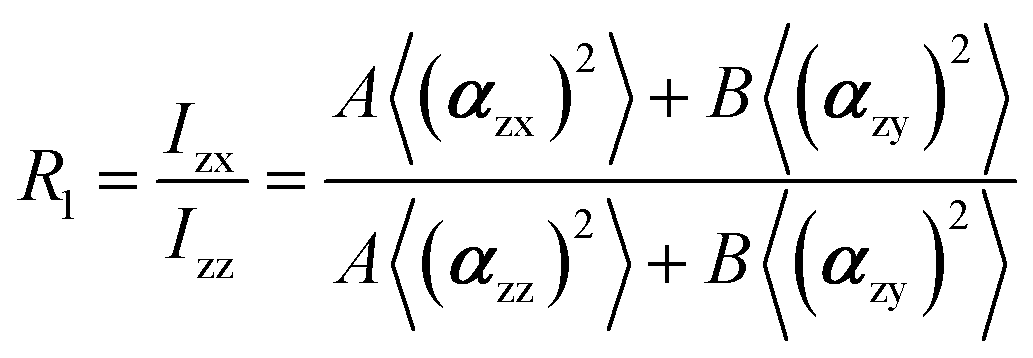
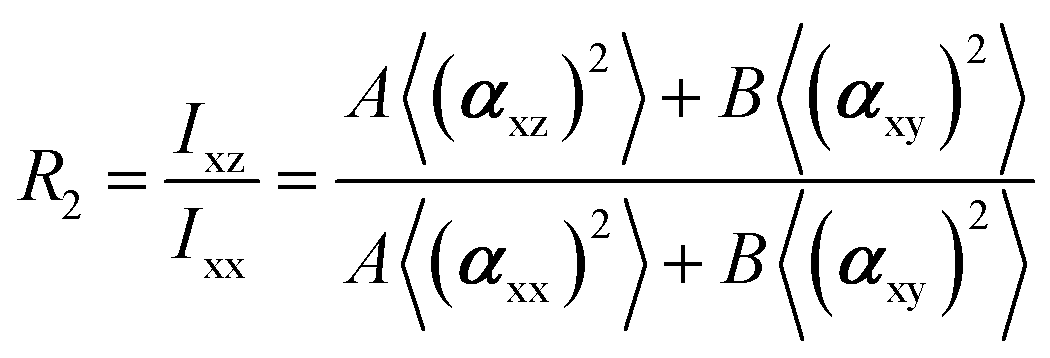
The A and B constants were introduced by Turrell15 to take into account incident and scattered beam in the focal plane when using a high numerical aperture (NA) objective in confocal Raman microscopy. They can be determined for each objective according to equations:
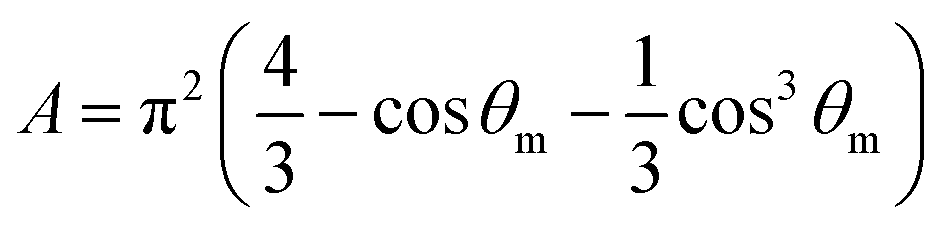
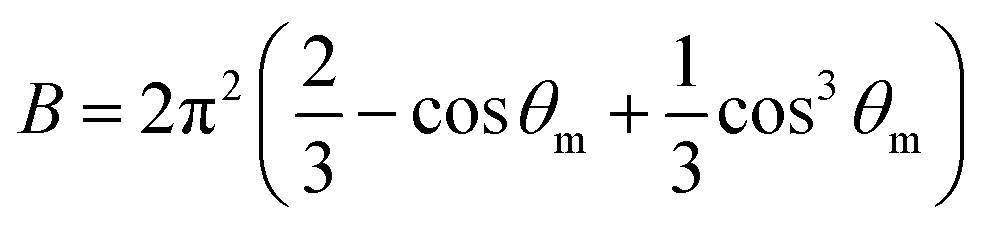
The angle θm is related to the numerical aperture of the microscope objective, NA, and the refractive index of the sample, n, by
n![[thin space (1/6-em)]](https://www.rsc.org/images/entities/char_2009.gif) sinθm = NA sinθm = NA |
The two ratios, R1 and R2, are related to the αij elements of the tensor. For a Raman tensor with a cylindrical symmetry, a1 = a2 = a, the unknown numbers are reduced from five to four.16 The four equations describing the 〈(αij)2〉 as above can be described as following:
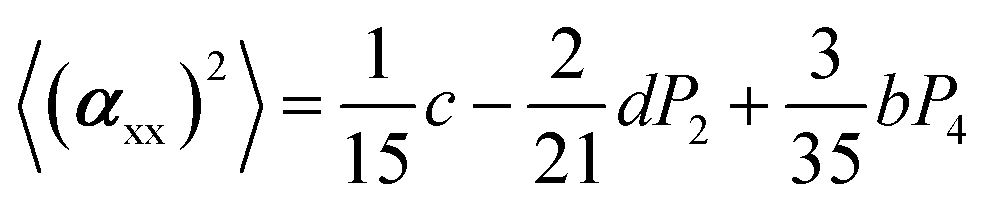
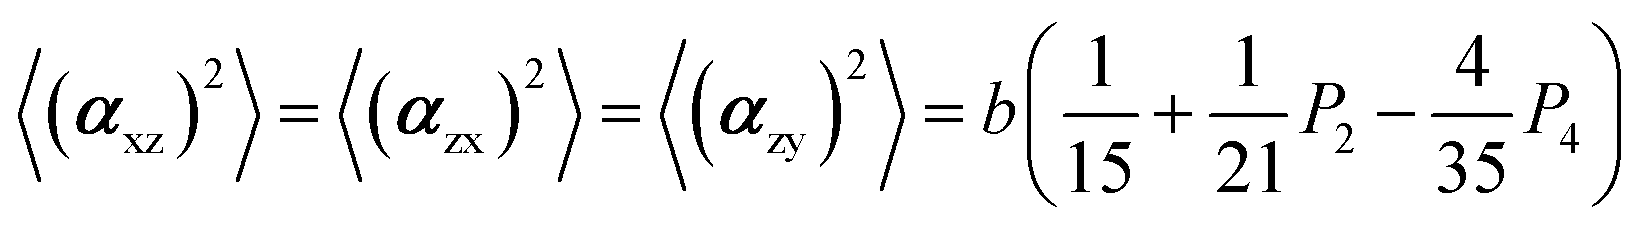
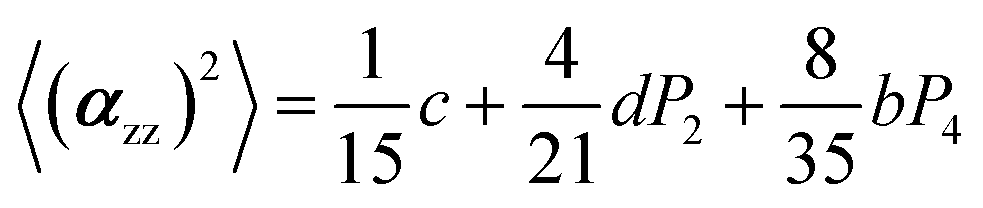
where
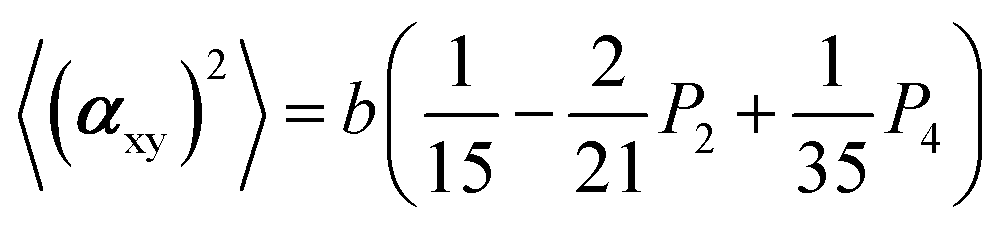
| b = α32(1 − a)2 |
| c = α32(3 + 4a + 8a2) |
| d = α32(3 + a − 4a2) |
At this stage, there are only three unknown numbers in these equations, namely P2, P4 and a. The a parameter can be determined independently by a completely isotropic sample (P2 = P4 = 0 and R1 = R2) from the depolarization ratio, Riso.13 And then, P2 and P4 can be determined from the values R1 and R2 measured experimentally.
Experimental details
Sample preparation
PAN precursor fibers were prepared by wet spinning. The 20 wt% spinning solution was prepared by copolymerizing acrylonitrile and itaconic acid in dimethyl sulfoxide (DMSO) solvent using 2,2′-azobisisobutyronitrile (AIBN) as initiator at 60 °C. The solution was extruded through a spinneret and drawn in coagulation bath and water steam. In the present study, the drawing ratios in the water steam were changed to obtain PAN precursor fiber samples. PAN precursor fibers were named as DX, where X stood for the drawing ratio during the water steam drawing process. Six different precursor fibers (named as D1, D2, D3, D4, D5 and D6, respectively) were prepared in this study.The procedure to prepare samples for radial structural investigation is as following. First, a fiber tow is attached straightly on the bottom of the model to ensure that the fiber axis is parallel and close to the epoxy block surface and then embedded in epoxy resin. To acquire the longitudinal and transverse section, the surface perpendicular and parallel to the fiber axis were mechanically grinded and polished by polishing machine, respectively (Struers Inc.).
Characterization
To determine the A and B constants, the refractive indices should be measured. In this study, the refractive indices of sample D1–D6 and isotropic film were measured by Becke's line method using a polarized microscope (OLYMPUS BX51) under monochromatic light (Na light) at 20 °C and a mixture system of paraffins and bromobenzene for the refractive index range 1.469–1.557. The refractive indices are shown in Table 1 as following.| Sample | Isotropic | D1 | D2 | D3 | D4 | D5 | D6 |
|---|---|---|---|---|---|---|---|
| Refractive index | 1.499 | 1.557 | 1.532 | 1.529 | 1.525 | 1.520 | 1.517 |
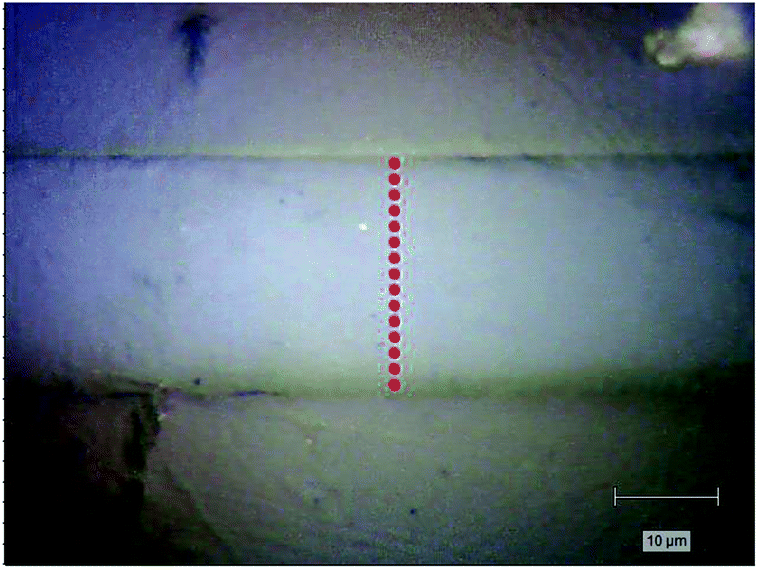
Raman spectra were recorded in the back-scattering configuration using the 785 nm He–Ne laser of a LabRam HR800 spectrometer (Jobin Yvon Horiba, Japan) coupled with an Olympus BX 41 microscope. The use of long-wavelength laser was particularly important for polymer samples to avoid high fluorescence background. In all measurements, the laser beam was focused with a 100× objective (0.9 NA Olympus) to acquire a submicrometer scale beam size. A half wave plate and a polarizer were used to change the polarization of incident laser beam and the scattered beam, parallel (z) and perpendicular (x) to the fiber axis, respectively. Therefore, a total of four polarized Raman spectra can be obtained and identified as Ixx, Ixz, Izz, Izx (first and second letters of subscripts referring to the incident and scattered polarization, respectively). A scrambler was placed before the 600 groove per mm holographic grating to minimize the laser's polarization dependence. The average exposure time for each spectrum collecting was fixed at 10 s, and 3 times averaged. The unnormalized intensities were obtained by measuring the maximum of the peaks corrected by a linear baseline in the range of 2000–2500 cm−1. To obtain molecular orientation related to fiber axis along the radial direction quantitatively, we performed polarized Raman spectroscopy measurements in the longitudinal section of precursor fiber as illustrated in Fig. 1. For quantitative comparison, the transverse section of each sample was equally divided into 14 parts. Hence, there were 15 points on each fiber's longitudinal section.
 | ||
| Fig. 1 A diagram for polarized Raman measurement. | ||
Raman mapping was performed under pinhole model with a 100× objective by using the 785 nm He–Ne laser of confocal Raman spectroscopy (RM2000, Renishaw, UK).
Wide-angle X-ray diffraction (WAXD) measurements were performed on an X-ray diffraction analyzer (Rigaku, Ultima IV) and operated at 40 kV and 40 mA with Ni-filtered Cu Kα radiation.
EPMA was conducted by (JXA-8200 JOEL, Japan) to measure the distribution of sulfur. The filament was embedded by epoxy resin and then polished to obtain a flat cross section. The cross section of the sample was perpendicular to the measurement direction. The measurement was conducted under mapping model at an accelerating voltage of 10 kV.
A nano-TA add-on (Anasys Instruments) was used to conduct nanoscale local thermal analysis measurements using a temperature ramp of 50 °C s−1 from 25 °C to the penetration temperature. An AN-2 silicon thermal probe was used (spring constant: 8.0 Nm−1, resonance frequency: 59 kHz). AFM amplitude images can also be obtained. The temperature was calibrated through three semi-crystalline polymers with known melting point at 60 °C (polycaprolactone), 116 °C (polyethylene) and 238 °C (polyethylene terephthalate).
Results and discussion
The molecular orientation in PAN precursor fiber was quantified by analyzing the Raman intensity of the 2243 cm−1 band, which is assigned to the symmetric –C![[triple bond, length as m-dash]](https://www.rsc.org/images/entities/char_e002.gif) N stretching vibration. The principal axis of the Raman tensor of –CN is with a tilt angle of 70° with respect to the main chain.17 Fig. 2(a) presents typical polarized Raman spectra of one point required for quantifying molecular orientation, parallel-polarized (xx and zz) and cross-polarized (xz and zx) spectra in the 2000–2500 cm−1 spectral region. The intensity of the parallel-polarized spectra (xx and zz) is different, indicating that molecular orientation is anisotropic. The polarized Raman intensity perpendicular to the fiber axis is higher than the parallel one (Izz > Ixx), indicating a global orientation of the PAN chains along the fiber axis since the Raman tensor associated with the vibrational mode is nearly perpendicular to the polymer main chain. The orientation parameter 〈P2〉 is required to be calculated to quantify the molecular orientation strictly. 〈P2〉 takes limiting values of −0.5 for a totally perpendicular orientation relative to fiber axis and 1 for a perfect alignment of chains along the fiber axis.14 The orientation function 〈P2〉 of this point is 0.22 after adjustment for the 70° tilt angle of the 2242 cm−1 band.
N stretching vibration. The principal axis of the Raman tensor of –CN is with a tilt angle of 70° with respect to the main chain.17 Fig. 2(a) presents typical polarized Raman spectra of one point required for quantifying molecular orientation, parallel-polarized (xx and zz) and cross-polarized (xz and zx) spectra in the 2000–2500 cm−1 spectral region. The intensity of the parallel-polarized spectra (xx and zz) is different, indicating that molecular orientation is anisotropic. The polarized Raman intensity perpendicular to the fiber axis is higher than the parallel one (Izz > Ixx), indicating a global orientation of the PAN chains along the fiber axis since the Raman tensor associated with the vibrational mode is nearly perpendicular to the polymer main chain. The orientation parameter 〈P2〉 is required to be calculated to quantify the molecular orientation strictly. 〈P2〉 takes limiting values of −0.5 for a totally perpendicular orientation relative to fiber axis and 1 for a perfect alignment of chains along the fiber axis.14 The orientation function 〈P2〉 of this point is 0.22 after adjustment for the 70° tilt angle of the 2242 cm−1 band.
 | ||
| Fig. 2 (a)Typical polarized Raman spectra for one representative point in individual PAN fiber in the 2000–2500 cm−1 region; (b) 〈P2〉 values evolution along the radial direction; (c) the evolution of quadratic coefficient a as a function of drawing ratio. | ||
To compare fibers with different diameters, the fiber diameter was normalized and divided into fourteen parts equally and fifteen points were measured in every monofilament. Fig. 2(b) shows the 〈P2〉 evolution in the radial direction of monofilaments obtained under different drawing ratios. Compared with other samples, sample D1 which was not drawn has the smallest 〈P2〉 values. According to our knowledge, stretching force is the main factor to induce molecular orientation during fiber formation process. As drawing ratio increases, the force fiber experienced should be higher and then the degree of molecular orientation is higher. However, an obvious skin–core difference in terms of 〈P2〉 values can be seen in sample D1. The influence of stretching process on sample D1 can be ignored, because the force exerted on sample D1 is small and the residence time of D1 in this stage is short. Therefore, the skin–core characteristic structure should be attributed to the wet-spinning process. During which, the viscous PAN solution was extruded through small holes of a spinneret and then immersed in coagulation bath. The concentration of solvent (DMSO) in PAN streamlets was higher than that in the coagulation bath, while the concentration of nonsolvent (H2O) in the streamlets was lower than that in the coagulation bath. Under the function of two kinds of concentration differences, interdiffusion of solvent and non-solvent, heat conduction, phase equilibrium movement happened between PAN streamlets and surrounding coagulation bath. Which led to the precipitation of PAN and the formation of nascent fiber. Ge et al.18 reported that the DMSO concentration had a gradient distribution along the radial direction during wet-spinning process. The DMSO concentration in the outer layer decreased rapidly due to the differential concentration, which led to PAN precipitation and forming a dense skin part. Then the skin part will hinder the diffusion of DMSO from the core part of the filament. The core part is nearly PAN solution. Therefore, skin part is relatively harder and stronger than core part, namely, skin part has a higher modulus. Although the jet stretch ratio is normally minus, the filaments still undergo tension in the wet-spinning process. It is because the filaments will shrink in the fiber axis direction due to extrudate swelling of spinning dope near the spinneret. As a result of the huge difference of mechanical properties between skin and core parts, more stress will be exerted on the skin part. Which will lead to better orientation of solid skin in filaments. Hence, D1 exhibits a skin–core structure in terms of 〈P2〉 value.
Furthermore, the 〈P2〉 values show an upward tendency as the drawing ratio increases. However, the orientation of skin part increases more profoundly than the core part with the increase of drawing ratio. Therefore, the skin–core structure of fibers which underwent high drawing ratios is more obvious. To describe the skin–core difference quantitatively, quadratic polynomial fit was conducted. The quadratic coefficient a which implies the opening size of quadratic function can be used to describe the skin–core difference directly. Bigger the a value, smaller the opening size and more obvious the skin–core difference. Fig. 2(c) shows the evolution of a value as a function of drawing ratio. Increasing the drawing ratio clearly leads to an increase of a value before the drawing ratio reaches four. After that, the a value is almost constant. Which indicates that the skin–core structure is increasingly obvious before the drawing ratio is increased to four. Then, less changes will happen with the further increase of drawing ratio.
The application of Raman spectroscopy to assess polymer crystallinity has also been explored during the past few decades.19–21 However, there are few articles about the estimation of PAN percent crystallinity through Raman spectroscopy. This is because PAN cannot be melted, and it is difficult to obtain PAN samples with various crystallinities by heating at variable temperatures. While we can research the relationship between the band feature (such as position, width and intensity) and crystallinity qualitatively. In this study, the Raman spectra of –CN of five membrane samples with different crystallinities are present in Fig. 3(a). In order to create a clear indication of the changes caused by different crystallinities, the background has been substrate and the spectra baselines are offset. The absolute intensity was found to decrease with increasing crystallinity. Therefore, the band at 2243 cm−1 is an amorphous-dependent band as described before.22 Namely, the higher the absolute intensity of the band, the lower the crystallinity. Based on this conclusion, in order to reveal the crystallinity distribution in the monofilament, the absolute intensity distribution of the band at 2243 cm−1 in the cross section of monofilament was mapped by using confocal Raman spectroscopy under pinhole model. As shown in Fig. 3(b), the overall intensity decreases and skin–core difference in terms of absolute intensity is more and more obvious as the drawing ratio increases. Which indicates that the crystallinity of the whole fiber increases and crystallinity difference between skin and core part is broadening with increasing drawing ratio. The results are in good accordance with polarized Raman results.
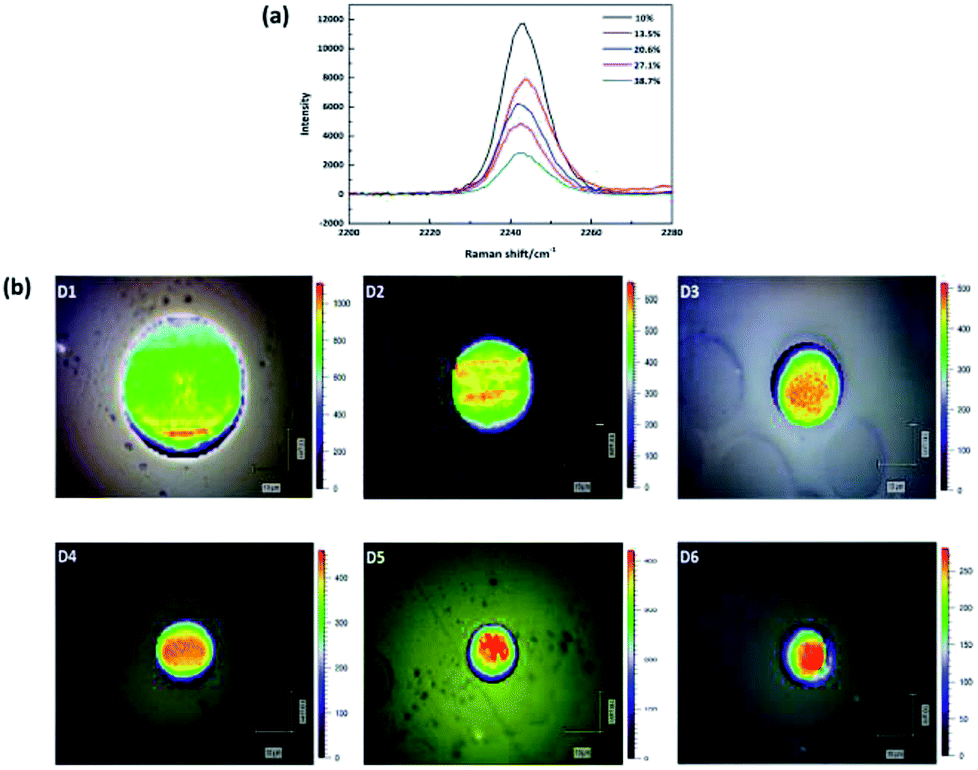 | ||
| Fig. 3 (a) Raman spectra of five membranes with different crystallinities. (b) Raman absolute intensity of –CN group mapping in the cross section of filaments D1–D6. | ||
The crystallinity of polymers is also intimately related to the thermal properties such as characteristic transition temperatures and thermal stability of polymers. Traditional methods such as differential scanning calorimetry (DSC), thermogravimetric analysis (TGA), thermomechanical analysis (TMA) and dynamic mechanical analysis (DMA) are well-established techniques for the measurements of thermomechanical properties of polymers. However, the limitation of these methods is that only averaged response of samples can be given and cannot realize nano-scale characterization. In this study, nano-TA, which is a nano-scale thermal analysis technique based on atomic force microscopy with a heated tip, was applied to investigate the nanoscale thermal properties evolution along the radial direction of monofilament. When the tip is in contact with the sample, the heat of tip will result in a local expansion followed by softening when the temperature reaches the decomposition point.23,24 These changes will be monitored through the vertical movement of the tip measured by laser deflection. Fig. 4(a) and (b) show the AFM height images combined with typical nano-TA measurements, revealing the decomposition temperatures distribution in the cross section of sample D1. The AFM images and nano-TA data of other samples are shown in ESI.† To avoid mutual interference between points, five points were measured across the diameter as shown in Fig. 4(a). According to our knowledge, samples with higher crystallinity have better thermal stability. Therefore, the decomposition temperature can reflect the crystallinity indirectly. As shown in Fig. 4(c), the decomposition temperature distribution varies from sample to sample. The same trend as 〈P2〉 value distribution and Raman mapping results can be observed. Samples which experienced higher drawing ratios have higher decomposition temperatures and the skin–core difference in terms of decomposition temperature is more obvious.
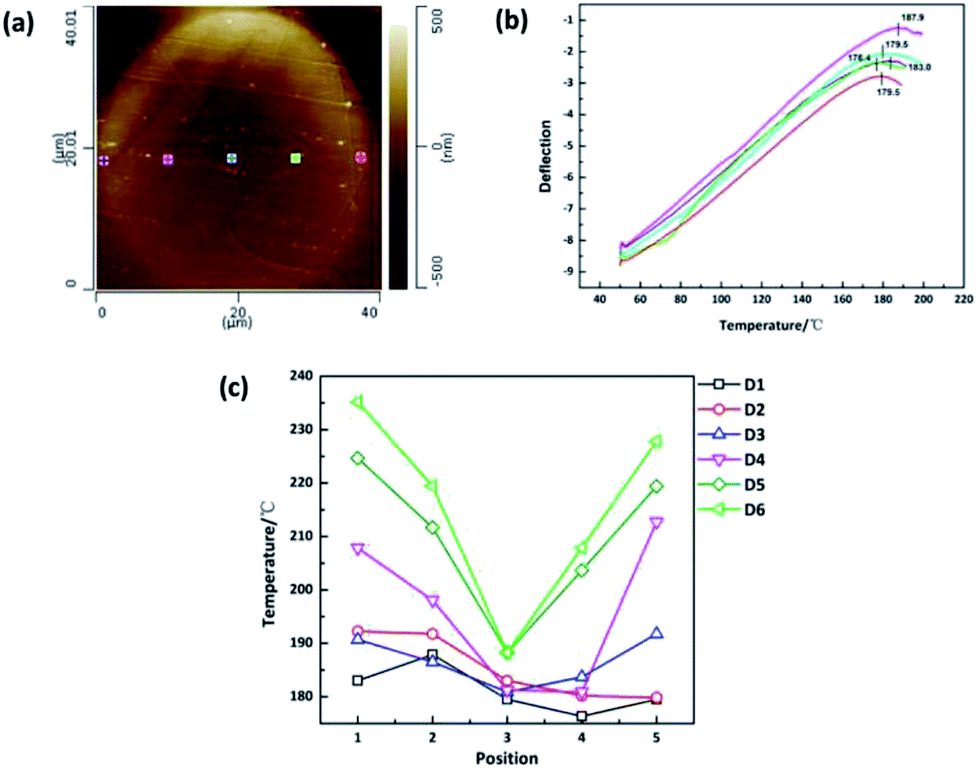 | ||
| Fig. 4 (a) AFM height mapping of the cross section of sample D1. (b) Nano-TA measurement of sample D1. (c) Decomposition temperature distribution of sample D1–D6. | ||
Fig. 5(a) shows the distribution of residual DMSO solvent in the cross section of monofilament obtained after coagulation process based on the sulfur mapping results of EPMA. It is clear that the concentration of solvent in the central region is higher. Therefore, the core part is softer and easier to deform than the skin part because of the plasticization of solvent. Since the skin–core structure of monofilaments could be presented by a parallel mechanical model, an overall schematic for the aggregation state of the molecular chains is drawn in Fig. 5(c) to describe the evolution of molecular orientation depending on stretching. Fibers are composed of oriented chains in the skin (blue) and relatively disordered chains in the core (yellow). With the drawing ratio increasing, the fiber diameter reduced and molecular orientation of skin part was improved more obviously than that of core part. The mechanism for the evolution of heterogeneous skin–core structure of PAN fibers was proposed as following. First of all, because of the extremely rapid solidification rate at the surface of the PAN fiber during coagulation process, a dense skin layer was formed and acted as a semi-permeable barrier, limiting the diffusion of the residual solvent in the core. Therefore, PAN filaments composed of oriented chains in the skin layer and relatively disordered chains in the core region (D1). This is consisted with the experimental results. After that, PAN fibers experienced steam stretching process, during which more stress will be exerted on the skin part because skin part has a higher modulus than core part. As a result, the difference of molecular orientation between skin and core part was more obvious (D3). When the external stretching force field was enhanced, the stretching force fibers experienced was higher and the stress gap between the skin part and core part was broadening. Therefore, polymer chains in the skin part were more highly stretched than that in the core part, although the overall orientation was improved as well (D6). In addition to the heterogeneous distribution of stress, polymer chains in the core part have higher mobility and are easier to relax to more stable and disordered state as a function of the residual solvent in the core part. Due to these two factors mentioned above, the orientation of PAN chains in the skin part was improved more obviously than that of core part.
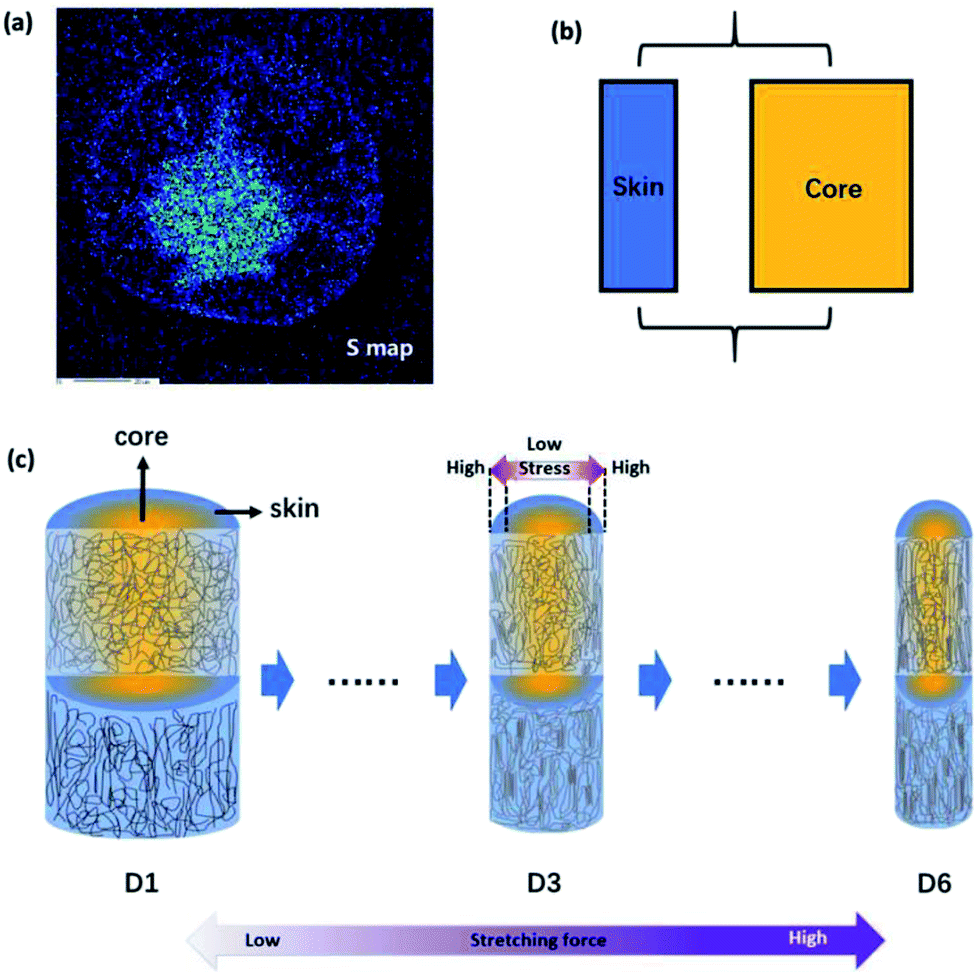 | ||
| Fig. 5 (a) The sulfur element distribution mapping in the cross section of filament obtained after coagulation process. (b) The parallel mechanical model of PAN fiber. (c) Formation mechanism for the evolution of the skin–core structure of PAN precursor fibers collected under different drawing ratios. | ||
Conclusions
In conclusion, this study shows that the skin–core structure of PAN nascent fibers would be obvious when large drawing ratio is exerted on fibers in the steam stretching process. This is because the residual solvent in the core part leads to different mechanical properties and different molecular mobility between skin and core part. Therefore, appropriate drawing ratio should be exerted at this stage or thorough interdiffusion process should be conducted before stretching for PAN precursor fibers obtained by wet spinning process.Conflicts of interest
There are no conflicts to declare.Acknowledgements
Financial support from the Beforehand Research Foundation Key Program (6140922010102) is gratefully acknowledged.Notes and references
- E. Frank, L. M. Steudle, D. Ingildeev, J. M. Spoerl and M. R. Buchmeiser, Angew. Chem., Int. Ed., 2014, 53, 5262 CrossRef PubMed.
- Y. D. Liu and S. Kumar, Polym. Rev., 2012, 52, 234 CrossRef.
- X. S. Guo, Y. X. Cheng, Z. Fan, Z. H. Feng, L. L. He, R. G. Liu and J. Xu, Carbon, 2016, 109, 444 CrossRef.
- G. Zhou, Y. Liu, L. He, Q. Guo and H. Ye, Carbon, 2011, 49, 2883 CrossRef.
- S. Nunna, C. Creighton, B. L. Fox, M. Naebe, M. Maghe, M. J. Tobin, K. Bambery, J. Vongsvivut and N. Hameed, J. Mater. Chem. A, 2017, 5, 7372 RSC.
- S. Nunna, M. Naebe, N. Hameed, B. L. Fox and C. Creighton, Polym. Degrad. Stab., 2017, 136, 20 CrossRef.
- Y.-J. Bai, C.-G. Wang, N. Lun, Y.-X. Wang, M.-J. Yu and B. Zhu, Carbon, 2006, 44, 1773 CrossRef.
- X. D. Liu and W. Ruland, Macromolecules, 1993, 26, 3030 CrossRef.
- C. L. Lai, G. J. Zhong, Z. R. Yue, G. Chen, L. F. Zhang, A. Vakili, Y. Wang, L. Zhu, J. Liu and H. Fong, Polymer, 2011, 52, 519 CrossRef.
- L. M. Bellan and H. G. Craighead, Polymer, 2008, 49, 3125 CrossRef.
- M. Richard-Lacroix and C. Pellerin, Macromolecules, 2012, 45, 1946 CrossRef.
- M. Richard-Lacroix and C. Pellerin, Macromolecules, 2013, 46, 9473 CrossRef.
- D. I. Bower, J. Polym. Sci., Polym. Phys. Ed., 1972, 10, 2135 Search PubMed.
- M.-E. Rousseau, T. Lefèvre, L. Beaulieu, T. Asakura and M. Pézolet, Biomacromolecules, 2004, 5, 2247 CrossRef PubMed.
- T. George, J. Raman Spectrosc., 1984, 15, 103 CrossRef.
- S. Frisk, R. M. Ikeda, D. B. Chase and J. F. Rabolt, Appl. Spectrosc., 2004, 58, 279 CrossRef PubMed.
- Z. Bashir, A. R. Tipping and S. P. Church, Polym. Int., 1994, 33, 9 CrossRef.
- H. Ge, H. Liu, J. Chen and C. Wang, J. Appl. Polym. Sci., 2008, 108, 947 CrossRef.
- A. Z. Samuel, B. H. Lai, S. T. Lan, M. Ando, C. L. Wang and H. o. Hamaguchi, Anal. Chem., 2017, 89, 3043 CrossRef PubMed.
- A. Z. Samuel, M. Zhou, M. Ando, R. Mueller, T. Liebert, T. Heinze and H. o. Hamaguchi, Anal. Chem., 2016, 88, 4644 CrossRef PubMed.
- G. R. Strobl and W. Hagedorn, J. Polym. Sci., Polym. Phys. Ed., 1978, 16, 1181 CrossRef.
- M. Tanaka and R. J. Young, J. Macromol. Sci., Part B: Phys., 2005, 44, 967 CrossRef.
- T. Tai, O. Karácsony, V. Bocharova, G. J. Van Berkel and V. Kertesz, Anal. Chem., 2016, 88, 2864 CrossRef PubMed.
- M. P. Nikiforov, S. Gam, S. Jesse, R. J. Composto and S. V. Kalinin, Macromolecules, 2010, 43, 6724 CrossRef.
Footnote |
| † Electronic supplementary information (ESI) available. See DOI: 10.1039/c8ra06310a |
| This journal is © The Royal Society of Chemistry 2018 |