
 Open Access Article
 This Open Access Article is licensed under a Creative Commons Attribution-Non Commercial 3.0 Unported Licence
Hydroxyethyl substituted linear polyethylenimine for safe and efficient delivery of siRNA therapeutics
Sushilkumar Patil,
Rohan Lalani,
Priyanka Bhatt,
Imran Vhora,
Vivek Patel,
Hinal Patel and
Ambikanandan Misra *
*
Faculty of Pharmacy, The Maharaja Sayajirao University of Baroda, Kalabhavan Campus, Vadodara-390001, Gujarat, India. E-mail: misraan@hotmail.com
First published on 16th October 2018
Abstract
Linear polyethylenimine (LPEI) has been well reported as a carrier for siRNA delivery. However, its applications are limited due to its highly ionized state at physiologic pH and the resultant charge mediated toxicity. The presence of ionizable secondary amines in LPE are responsible for its unique characteristics such as pH dependent solubility and positive charge. Therefore, modification of LPEI was carried out to obtain hydroxyethyl substituted LPEI with the degree of substitution ranging from 15% to 45%. The impact of modification on the physicochemical parameters of the polymer, i.e. buffer capacity, solubility, biocompatibility and stability, was evaluated. Surprisingly, despite the loss of ionizable amines, the substitution improved solubility, and even overcame the pH dependent solubility of LPEI. In addition, the conversion of secondary amines to less basic tertiary amines after substitution improved the buffer capacity, in the endosomal pH range, required for efficient endosomal escape. It also reduced erythrocyte aggregation, hemolytic potential and in vitro cytotoxicity. The in vitro studies showed enhanced cell uptake and mRNA knockdown efficiency. Thus, the proposed modification shows a simple approach to overcome the limitation of LPEI for siRNA delivery.
1. Introduction
Antisense-mediated gene inhibition compounds have evolved as a most elegant class of therapeutics. These include small interfering RNA (siRNA), short hairpin RNA (shRNA) and bifunctional shRNA. The progress made in human genome mapping and an improved understanding of signal transduction have broadened their application horizon. It takes a powerful molecular process to modulate gene expression by inducing the endogenous RNAi machinery to direct mRNA degradation.1 Notably, siRNA provides the advantages of a wide choice of targets, easy synthesis, extended period of target suppression, high target selectivity over non-targets giving a better therapeutic index and significantly improved quality of therapy compared to small molecule inhibitors.2However, in spite of showing tremendous therapeutic potential, RNAi-based therapeutics are far from clinical usability. The first clinical trial was started in 2004 and many more thereafter, however, majority of these trials, with few exceptions, could last for phase I or early phase II stages only.3 A key challenge for their successful clinical application is the efficient and safe delivery of siRNA into target cells against milieu of extracellular and intracellular barriers. The extracellular barrier includes hydrolytic instability, nuclease degradation; hydrophilicity and negative charge restricting its cytoplasmic entry by diffusion. Further, the intracellular barriers such as endosomal degradation and intracellular trafficking also co-exist to preclude easy entry.2 A potential solution to overcome these problem has been provided by viral/non-viral gene delivery vectors.
Non-viral vectors are safe and less immunogenic than viral vectors. Further, non-viral vectors composed of cationic polymers are preferred over lipid based carrier when greater stability is desired in physiological environment.4 Cationic polymers contain several amine groups in their backbone which interact with negatively charged siRNA leading to spontaneous formation of nanosized complexes. Among these cationic polymers, PEI, especially branched PEI (bPEI), is well-known as good transfection reagent due to its intrinsic proton sponge property.5 However, due to high toxicity and lack of biodegradability, it has no clinical applications. In contrast, linear PEI (LPEI) is less toxic but it displays low transfection capacity.6
The high transfection efficiency of bPEI has been attributed to the unique ratio of 1![[thin space (1/6-em)]](https://www.rsc.org/images/entities/char_2009.gif) °:2°:3° amines of 1:2:1 imparting it a typical ionization behavior. However, LPEI, being composed of only secondary amines, fails to behave similar to bPEI, as most of amines get protonated in pH range of 8.2 to 9.5.7,8 Several modifications of LPEI have been tried for improved transfection efficiency, however most of them involved tedious and multistep synthesis.6,9–13 Therefore, we attempted a simple modification of LPEI to influence its ionization behavior, hydrophilicity and consequently the biological properties such as cell uptake and transfection efficiency.
°:2°:3° amines of 1:2:1 imparting it a typical ionization behavior. However, LPEI, being composed of only secondary amines, fails to behave similar to bPEI, as most of amines get protonated in pH range of 8.2 to 9.5.7,8 Several modifications of LPEI have been tried for improved transfection efficiency, however most of them involved tedious and multistep synthesis.6,9–13 Therefore, we attempted a simple modification of LPEI to influence its ionization behavior, hydrophilicity and consequently the biological properties such as cell uptake and transfection efficiency.
2. Experimental
2.1. Materials
LPEI (22 kDa), was gift from polychemistry, USA. Lipofectamine® 2000 (L2K) was purchased from Invitrogen Life Technologies (New York, USA). 2-Bromoethanol was purchased from Sigma Aldrich, Bangalore. siRNA targeting human epithelial sodium channel (ENaC) with antisense strand sequence of was purchased from Eurofins MWG Operons Ltd (Germany). Carboxyfluorescene FAM labelled negative control siRNA (FAM-NC-siRNA) and non-target control siRNA (NTC control) with antisense strand sequence
  was gift sample from GenePharma (Shanghai, China). The cell culture reagents such as: 4′,6-diamidino-2-phenylindole (DAPI), 3-(4,5-dimethylthiazol-2-yl)-2,5-diphenyl tetrazolium bromide, Eagle's minimal essential medium (EMEM), Fetal bovine serum (FBS), Antibiotic antimycotic solution (100×) were purchased from Himedia (Mumbai, India).
2.2. Preparation of LPEI
LPEI was modified to achieve different degrees of substitution (DS) on LPEI backbone to obtain hydroxyethyl substituted LPEI (HELPEI). Briefly, 500 mg of LPEI was dissolved in ethanol in a round bottom flask. 2-Bromoethanol was added to it at varying molar ratios to amine content in LPEI. Then 3.2 g potassium carbonate was added as proton abstractor. The RBF was placed on a preheated oil bath and refluxed for 48 h and increamental quantity of 1.6 g K2CO3 was added at 12 and 24 h. After completion the reaction mixture was centrifuged and supernatant was collected and evaporated under vacuum (400 mmHg) on rotary evaporator at room temperature. The residue obtained was reconstituted in double distilled water and dialyzed against double distilled water to remove salts and any other low molecular impurities. The retentate of the dialysis were lyophilized to obtain dry residue of HELPEI.2.3. Characterization
For structural characterization, 1H NMR spectra of HELPEI were recorded on Bruker Avance II 400 NMR spectrometer at 400 MHz. For this, LPEI and HELPEI were dissolved in D2O and 1H NMR spectroscopy was performed with a 5 mm probe. All the reactions were set at mole to mole basis to get desired DS, and it was confirmed by 1H NMR. The degree of substitution (DS) was determined by peak integration using the following relation: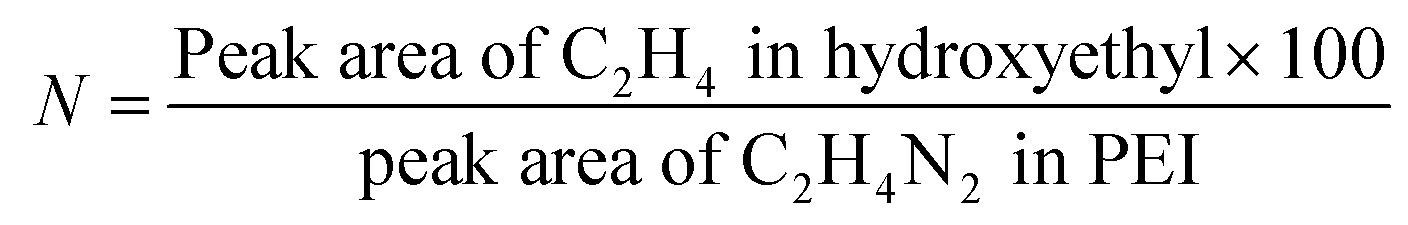
The peak integration at chemical shifts of δ 2.3 to 2.9 were considered for C2H4 in ethylene backbone, and δ 3.25 to 3.61 for C2H4 in hydroxyethyl substituent.
Further, the effect of substitution on solubility of HELPEI was evaluated. Briefly, PEI were dissolved in 0.1 N HCl (1 mg mL−1), the pH of solution was titrated from 5.0 to 12.0 by using 0.1 M NaOH solution. The transmittance of solution at 600 nm as a function of pH value was recorded on a UV-visible spectrophotometer (Shimadzu, Japan).
2.4. Proton sponge effect
The buffer capacity of the LPEI and HELPEI from pH 10 to 3.5 was determined by acid–base titration as reported in literature.14 Briefly, 10 mg of polymer was dissolved in 150 mM NaCl solution. The solutions were adjusted to an initial pH of 10.0 using 1 N NaOH and then titrated with 0.1 N HCl and pH was recorded using a pH meter. Buffer capacity was defined as the percentage of amine groups protonated from pH 7.4 to 5.1, and was calculated using following equation:wherein, ΔV is the volume of HCl required to bring the pH from 7.4 to 5.1, and N mol is total moles of protonable amines in given amount of polymer.15 Additionally, the ratio of protons consumed in intervals of 7.4–5.1 to 10–7.4 was calculated as secondary indicator of effect of DS on basicity of amines.

2.5. Preparation of polyplex
Since complexation efficiency of LPEI is function of charge density and pH, all the polyplex were prepared in nuclease free water adjusted to 7.4 pH using 20 mM sodium acetate. The required amount of polymer stock solution (10 mg mL−1) was diluted with sodium acetate buffer and then mixed with siRNA at varying n/p ratio. The mixture was gently vortexed for 2 min and incubated for 40 min at 25 °C.2.6. Gel retardation assay
Agarose gel electrophoresis was used to study the complexation of LPEI and HELPEI with siRNA at different n/p ratio. Briefly, all the incubated polyplexes (20 μL) were mixed with 6× DNA gel loading buffer (Himedia, India) and loaded onto 4% agarose gel containing 0.5 μg mL−1 ethidium bromide and electrophoresed at 50 V in Tris-borate EDTA buffer pH adjusted to 7.4. Electrophoresed gel was visualized under UV trans-illuminator using Gel Doc System (Bio-Rad Lab., USA). The n/p ratio required for complete retardation of siRNA were determined for each polymer. The complexation efficiency was determined by centrifugal assay previously reported.16,17 Briefly, siRNA polyplexes were centrifuged at 25000 rpm for 45 min at 4 °C. The aqueous supernatant after centrifugation was separated and analyzed for siRNA content using NanoDrop UV spectrophotometer (Thermo scientific, USA).
2.7. Size and zeta potential
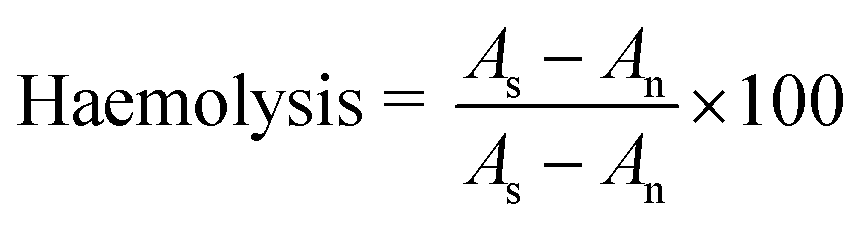
The hydrodynamic size of the polyplexes was determined by using dynamic light scattering using Zetasizer, Nano ZS series (Malvern Instruments, Germany). The prepared polyplexes were diluted appropriately with nuclease free water pH 7.4 and measurements made at 25 °C. Similarly zeta potential was measured by applying Smoluchowski's equation in the zeta sizer software.2.8. Biocompatibility assessment
where, As is the absorbance of supernatant, An and Ap is the absorbance of negative and positive control, respectively.
2.9. Stability challenge studies
2.10. Transmission electron microscopy (TEM)
TEM was performed to study the morphology of particles. Briefly, a sample drop was placed onto 300 # carbon coated copper grid. Using filter paper, the surface water from the grid was removed by tapping. After 5 min, grid was inserted into microscope using a sample probe and observed at 200 kV accelerating voltage with suitable magnification (25× to 75000×).2.11. Cell uptake
:glycerin solution (50:50) was used for mounting coverslips and confocal microscopy was performed using confocal microscope (LSM 710, Carl-Zeiss Inc., USA).2.12. In vitro gene silencing
In a 24 well plate, CFBE41o- cells were seeded (105 cells per well) and incubated for 24 h. After 80% confluency, cells were treated at three different concentrations of ENaCα siRNA i.e. 25 nM, 50 nM and 100 nM prepared as polyplex formulations. Untreated cells were used as negative control while L2K was used as positive control. The gene expression was reported relative to untreated control. NC-siRNA as HELPEI-35-siRNA polyplexes was used to confirm the specificity. After incubation for 48 h, total RNA was isolated using TRIzol reagent and reverse transcription into cDNA was carried out using RNA to cDNA conversion kit. mRNA level was quantified using Step One Real Time PCR using SYBR Green Mastermix, forward and reverse primers (primers for ENaCα: F-5′-CCTGGAATCAACAACGGTCT, R-5′-AGGGTTTCCTTCCTCATGCT producing PCR product of 188 bp; primers for GAPDH: F-5′-ATCCCATCACCATCTTCCAGG, R-5′-CAAATGAGCCCCAGCCTTCT producing PCR product of 122 bp) and 2 ng of cDNA in a total reaction volume of 15 μL. The mRNA expression was normalized against housekeeping gene glyceraldehyde-3-phosphate dehydrogenase (GAPDH).2.13. Statistical analysis
Experiments were performed in triplicate and data are expressed as the mean ± standard deviation (SD), unless otherwise stated. The statistical significance testing was performed using a Student's t-test with p < 0.05.3. Result and discussion
3.1. Characterization
The structural modification led to changes in chemical shifts values of proton. 1H NMR spectrum showed that in case of LPEI, protons of C2H4 in ethylene backbone showed peaks at chemical shift (δ) values of 2.3 to 2.9 while the protons of C2H4 in hydroxyethyl substituent show downfield shift in range of δ 3.25 to 3.61 due to de-shielding effect of –OH group (Fig. 1). Based on the chemical shift, integrations were performed in the scanned NMR spectra of HELPEIs and DS was determined as shown in Table 1.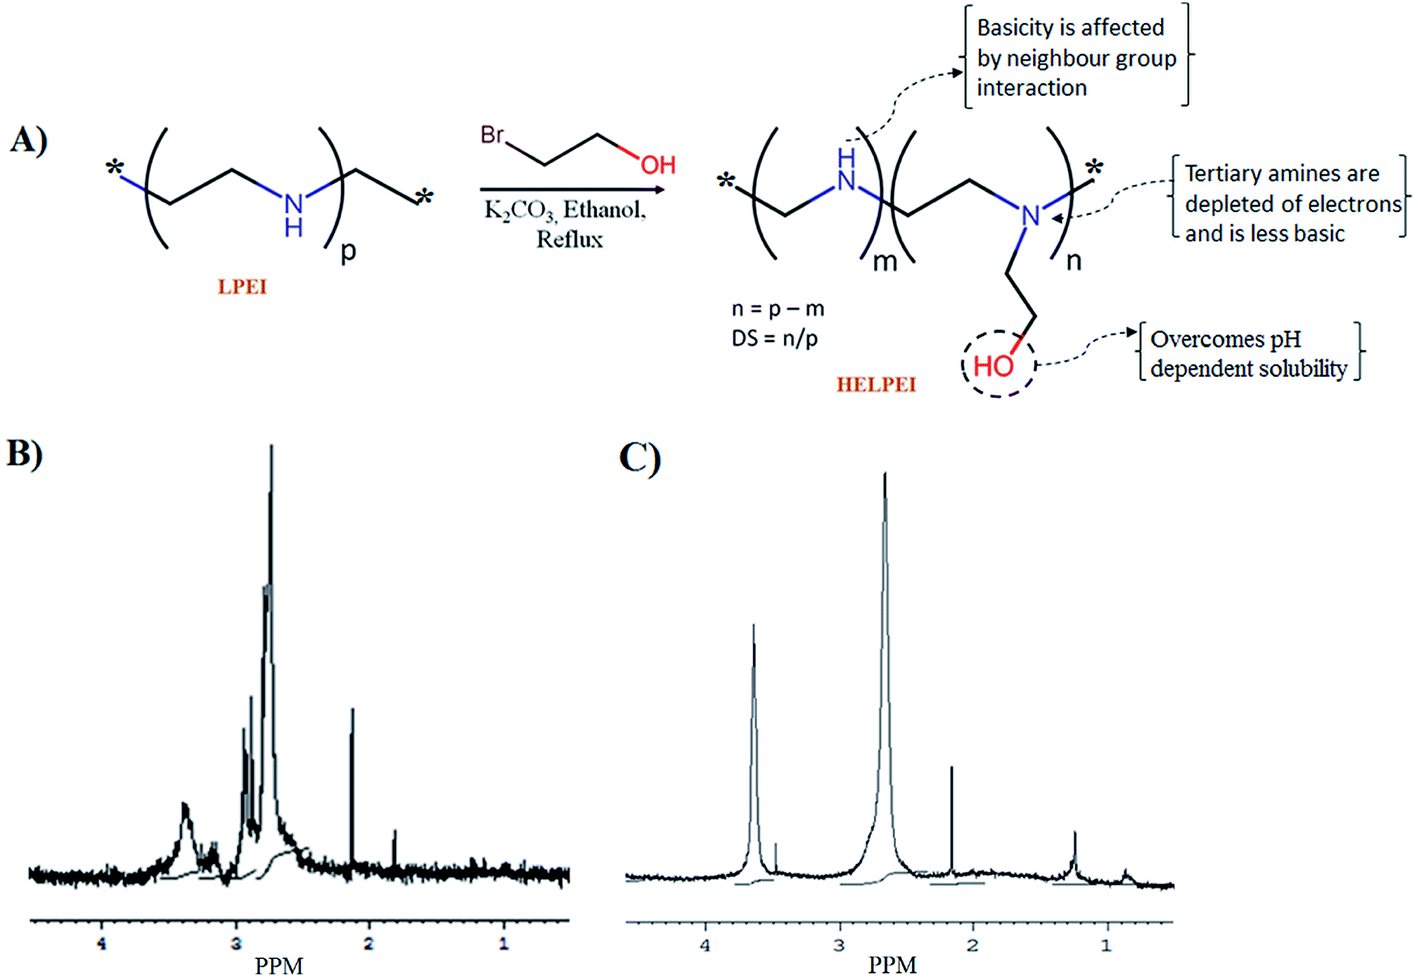 | ||
| Fig. 1 (A) General scheme for preparation of HELPEIs with illustration of hypothesis (B) 1H NMR spectrum of LPEI; (C) 1H NMR spectrum of HELPEI-45. | ||
| Polymer | Actual DS | Molecular weight (Da) | Ratio of HCla | Buffering capacity (%) |
|---|---|---|---|---|
| a Ratio of HCl consumed in pH interval of 7.4–5.1 to 10–7.4. | ||||
| LPEI | 0 | 22000 |
0.31 ± 0.022 | 10.32 ± 0.22 |
| HELPEI-15 | 11.75 | 24645 |
0.34 ± 0.018 | 13.53 ± 0.35 |
| HELPEI-25 | 22.18 | 26993 |
0.39 ± 0.029 | 15.33 ± 0.22 |
| HELPEI-35 | 33.38 | 29514 |
0.44 ± 0.038 | 17.31 ± 0.34 |
| HELPEI-45 | 43.26 | 31738 |
0.50 ± 0.028 | 18.28 ± 0.27 |
| bPEI-25 kDa | — | — | 0.38 ± 0.034 | 17.85 ± 0.25 |
Further, modification of LPEI led to significant effects on solubility of the polymer. LPEI is insoluble in water at temperatures below 55 °C, with resultant pH of around 9.2. The pH solubility profile of LPEI and HELPEI was studied from pH 6.0 to 11.0 at room temperature. Fig. 2A and B shows the results of solubility studies using turbidimetry. The transmittance values at 600 nm showed that, at pH above 8.0 there is tremendous drops in transmittance of LPEI from >90% to less than 20%. LPEI becomes insoluble when it is less than 20% protonated, which occurs at pH values > 9.0. Surprisingly, despite of loss of ionisable amines due to substitution, all HELPEIs with DS of 25% and above showed >94% transmittance at all pH values. This indicates that hydroxyethyl substitution is also capable of introducing hydrophilicity to HELPEIs and overcomes the pH dependent solubility, due to which even at pH > 9.0 where amines are un-ionized, HELPEIs remain soluble.
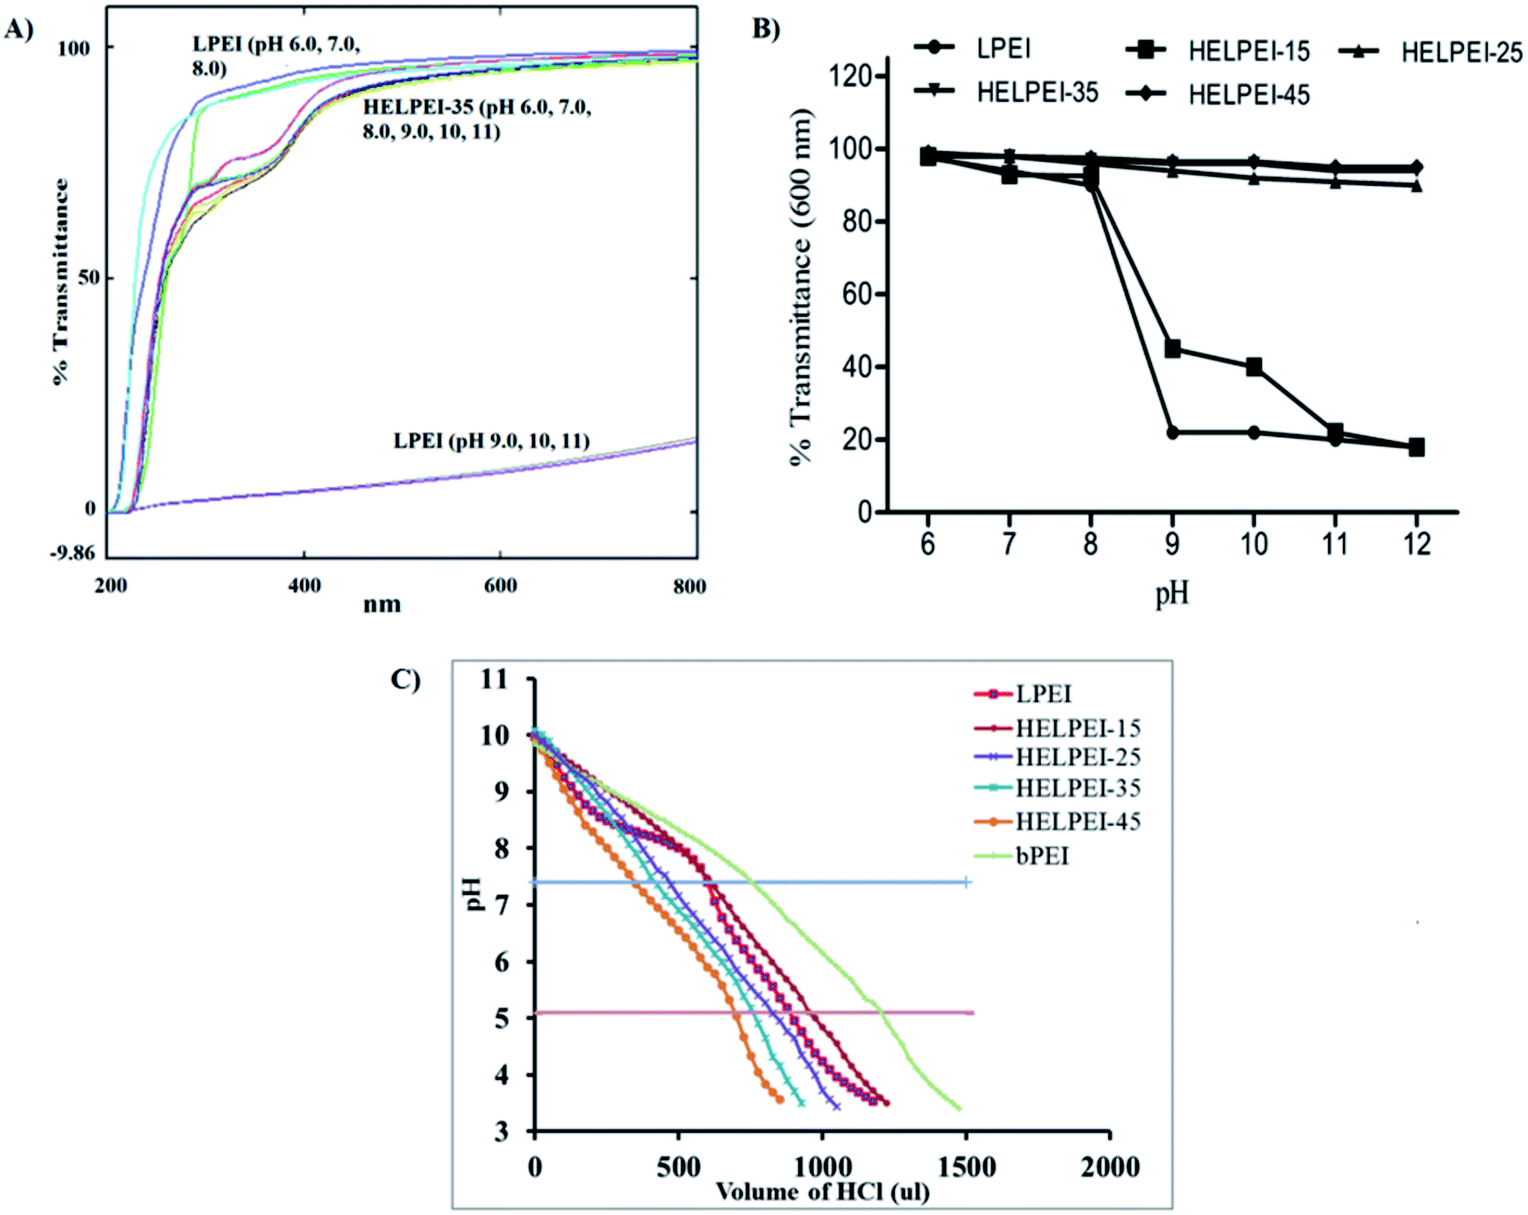 | ||
| Fig. 2 (A) Overlay of UV-transmittance spectra of LPEI, at pH 6, 7, 8 (top three), and pH 9.0 to 11 (at bottom) and HELPEI-35, at pH 6.0 to 11. (B) Summary plot of transmittance of LPEI and HELPEI at different pH. (C) Acid–base titration of LEPI and HELPEI with 0.1 N HCl. | ||
3.2. Proton sponge effect
Buffer capacity is one of the most essential traits sought in a gene vector, which plays role in destabilization of endosome and releases the polyplexes from endosomes. Previous studies with PEGylated PEI reported that grafting of PEG to PEI have resulted in reduction in buffer capacity due to shielding effect of PEG.21 The pKa of LPEI is influenced by presence of salt due to screening of electrostatic potential around LPEI chain (shifting of pKa to higher values), therefore titrations were performed in 150 mM NaCl solution.The secondary amines of LPEI are basic in nature with pKa in range of 9.0. Hydroxyethyl substitution could lead to significant deviation in protonation behavior. It converts secondary amines to tertiary amines, which are depleted of electron density and thereby have reduced basicity. The order of basicity of amines in aqueous media is as follows: primary amine > secondary amine > tertiary amine. In addition, all the secondary amines of LPEI are not protonated at same pH, as titratable sites are close together, i.e. only two methylene units separating nitrogen, protonation state of a site electrostatically affects the protonation of nearby sites. The analogy can be made from ethylenediamine, which requires a significantly lower pH (pK2 of 7.08) for protonation of second amine to occur after the first amine group (pK1 of 9.89) has been protonated. Finally, as chain becomes increasingly substituted, the next-nearest-neighbor interactions leads to further deviation in protonation behavior.8
To assess the quantitative effect of modification of LPEI on protonation behavior, the titration curve was divided into different regions. The region 10 to 7.4 indicates the approximate amount of protonated amines at physiologic pH. Fig. 2 shows that LPEI curve was inclined in this region and therefore becomes most cationic at physiologic pH. While all HELPEIs curves were steep in this region due to reduced protonation in this region. Further, the comparison of ratio of protons consumed in pH range of 7.4–5.1 (endosomal pH) to the protons consumed in pH range of 10–7.4, showed an increasing trend with increasing DS. Finally, the buffer capacity calculations (Table 1) show that, the buffer capacity of LPEI was lowest i.e. 10.32, which increased with increasing DS and it crossed buffer capacity of bPEI (the standard used in proton sponge assays).
3.3. Gel retardation assay
For LPEI the optimized n/p ratio for complete retardation was 4. This is because, LPEI being at least 55% of the amines protonated at 7.4 pH, leads to strong electrostatic interaction.22 The n/p ratio for complete retardation for HELPEI-15, HELPEI-25, HELPEI-35, and HELPEI-45 were 5, 6, 8, and 15, respectively (Fig. 3). This implies that with increase in DS the binding affinity of HELPEI to siRNA is reduced. The effect could be attributed to suppression of ionization and reduced charge density. Literature has reported that after substitution with PEG molecules there is a drastic reduction in binding efficiency due to shielding of charges.23,24 This may eventually lead to higher intake of non-biodegradable polymer to deliver the desired dose of siRNA. In contrast, the substitution with low molecular weight hydroxylethyl group could be advantageous as it does not lead to such drastic reduction in binding affinity.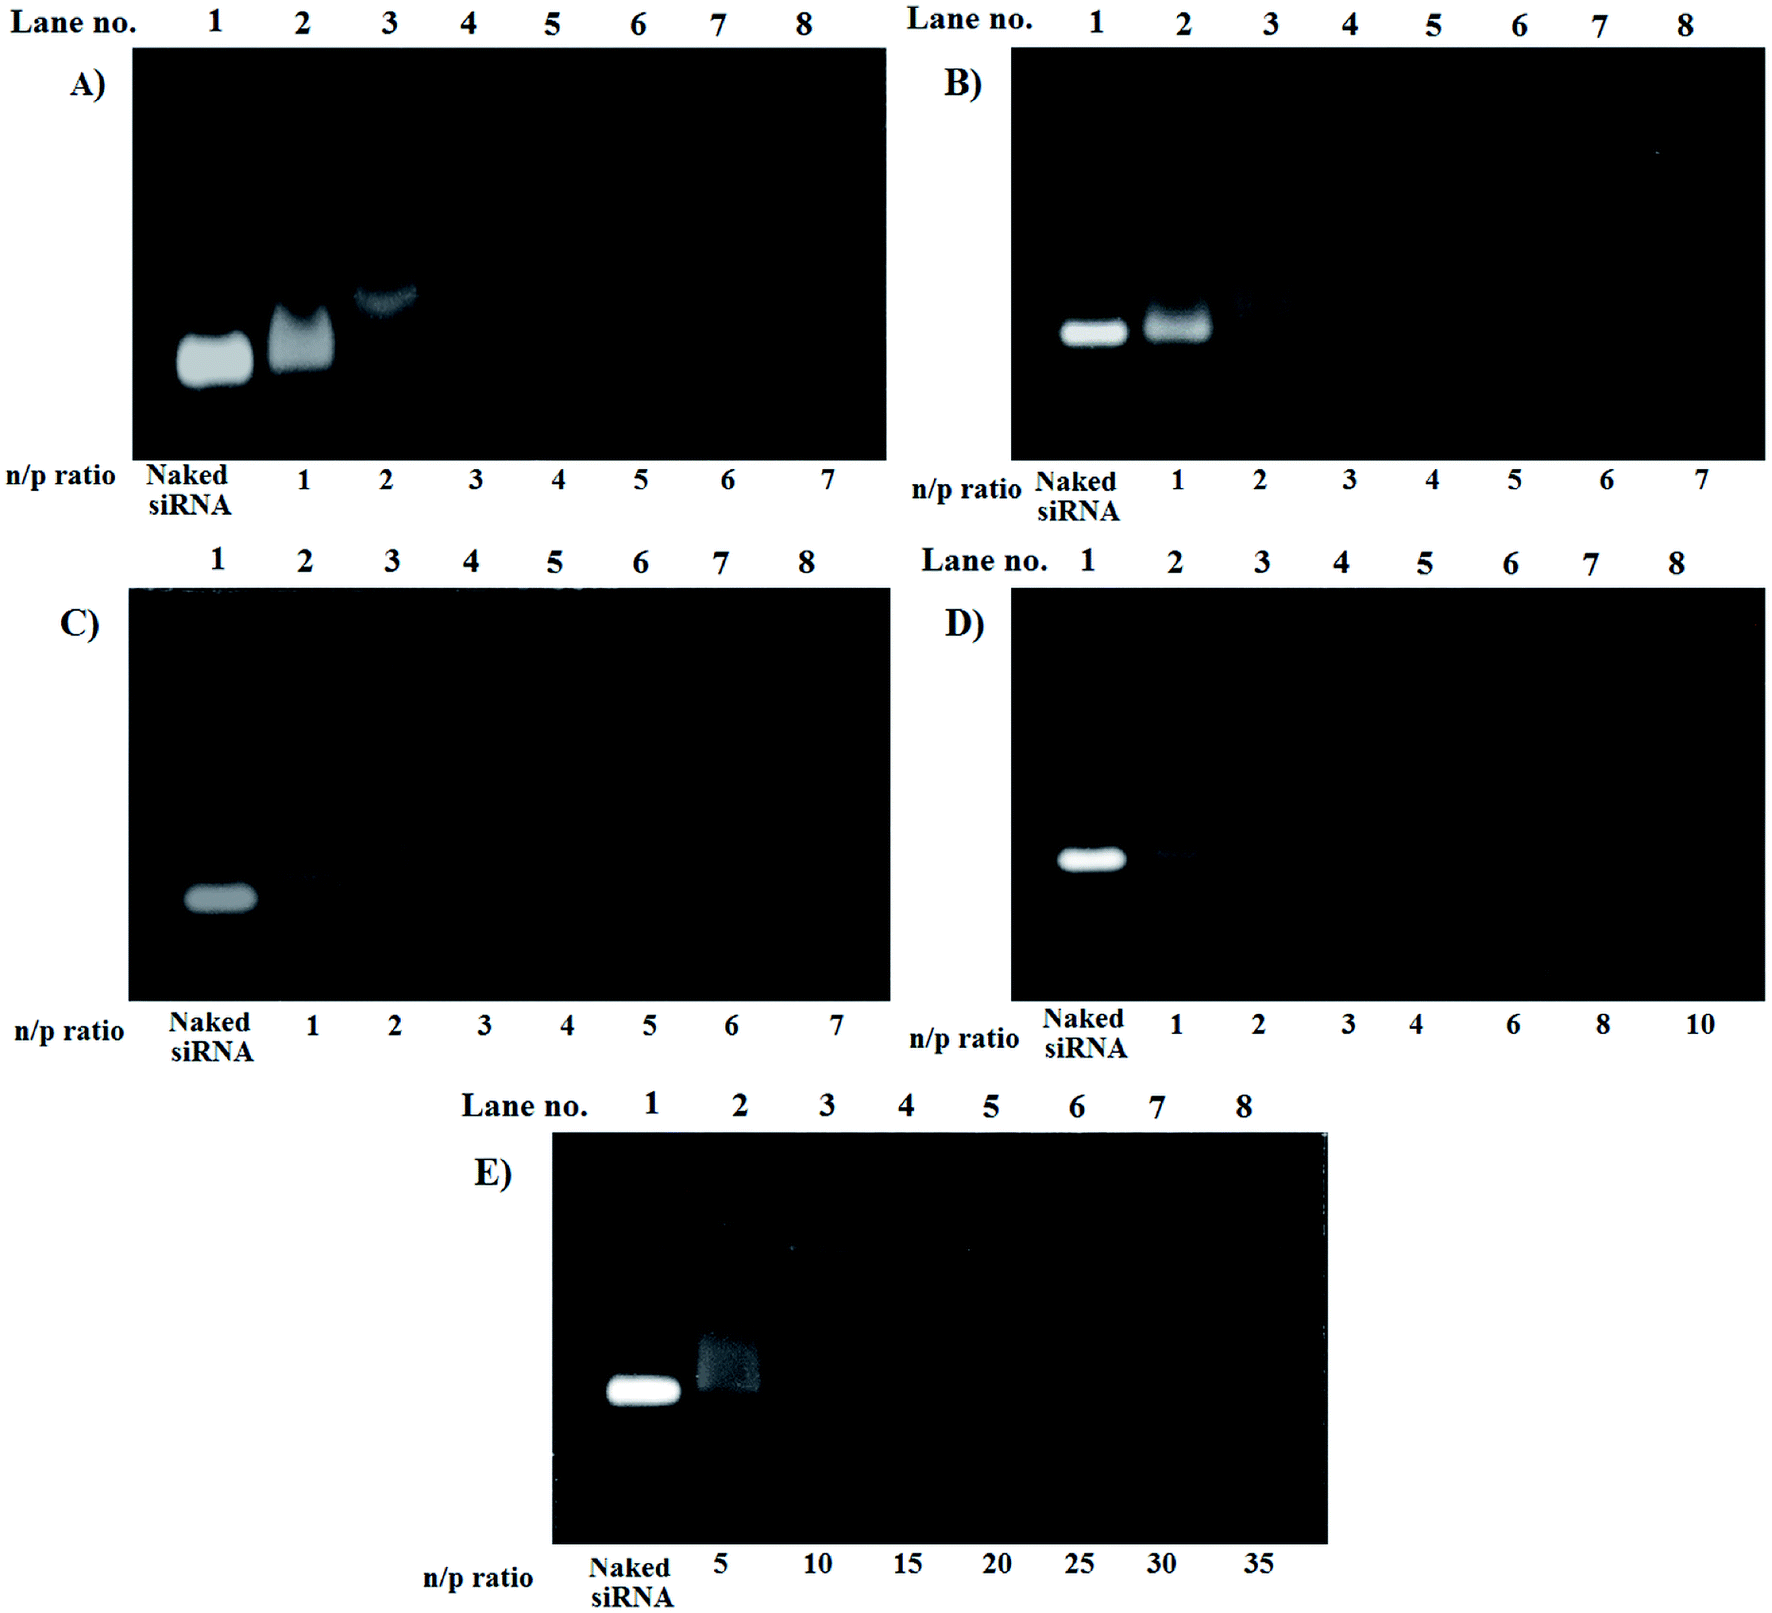 | ||
| Fig. 3 Gel electrophoresis images for gel retardation assay of polyplexes of (A) LPEI, (B) HELPEI-15, (C) HELPEI-25, (D) HELPEI-35 and (E) HELPEI-45. | ||
However, as the DS is increased from 35% to 45% there was an anomalous increase in n/p required for complete retardation. This indicates that the charge reduction was non linear with DS beyond certain point. This deviation could be attributed to the fact as chain becomes increasingly susbtituted, the cumulative build-up of neighbour interactions leads to significant supression of basicity of nitrogens.8 Thus to deliver same dose of siRNA, higher quantity HELPEI-45 would be required.
3.4. Size and zeta potential
The size of polyplexes formed from HELPEIs with lower DS were comparatively smaller than with higher DS at the given n/p ratio, showing that there is decrease in the affinity of polymer with higher DS. However, as the n/p was increased the sizes for all were <200 nm, as desired. The results of zeta potential showed that polyplexes were able to maintain the positive charge after complexation with anionic siRNA molecules. However, as DS increased the zeta potential was found to decrease. The decrease in zeta potential could be the result of reduced ionization of the amines on the polymeric backbone at measurement pH of 7.4. As expected the increase in n/p values led to increase in zeta potential. The effect of n/p ratio on particle size, PDI and zeta potential is shown in Table 2.| Formulation | n/p ratio | Particle size (nm) | Mean PDI | Zeta potential (mV) |
|---|---|---|---|---|
| LPEI | 4 | 168.7 ± 4.5 | 0.219 ± 0.013 | 26.2 ± 1.54 |
| 6 | 129.8 ± 2.3 | 0.147 ± 0.009 | 29.4 ± 1.61 | |
| HELPEI-15 | 5 | 185.3 ± 3.8 | 0.215 ± 0.018 | 25.8 ± 2.50 |
| 7 | 135.2 ± 3.2 | 0.152 ± 0.014 | 28.1 ± 1.68 | |
| HELPEI-25 | 6 | 213.5 ± 4.6 | 0.237 ± 0.017 | 24.1 ± 1.84 |
| 8 | 138.8 ± 2.5 | 0.171 ± 0.012 | 26.6 ± 1.55 | |
| HELPEI-35 | 8 | 248.9 ± 4.7 | 0.259 ± 0.025 | 18.3 ± 2.79 |
| 10 | 156.5 ± 5.6 | 0.175 ± 0.015 | 21.2 ± 1.70 | |
| HELPEI-45 | 15 | 311.2 ± 6.2 | 0.287 ± 0.028 | 17.3 ± 2.81 |
| 17 | 195.7 ± 4.4 | 0.213 ± 0.019 | 17.5 ± 2.87 |
3.5. Complexation efficiency
The amount of siRNA in free form is prone to degradation by nucleases and hydrolytic conditions present in extracellular milieu.25 Therefore, it was necessary that the optimized n/p ratio contains maximum amount of siRNA in bound form to the vector. The polyplexes were characterized for complexation efficiency by centrifugal assay. Table 3 shows that both the LPEI and HELPEIs were able to condense more than 95% of siRNA at their optimized n/p ratios.| Formulation | Optimized n/p ratio | Complexation efficiency (%) |
|---|---|---|
| LPEI | 6 | 97.29 ± 1.36 |
| HELPEI-15 | 7 | 98.54 ± 2.04 |
| HELPEI-25 | 8 | 97.37 ± 1.29 |
| HELPEI-35 | 10 | 97.09 ± 2.44 |
| HELPEI-45 | 17 | 95.48 ± 2.62 |
3.6. Biocompatibility study
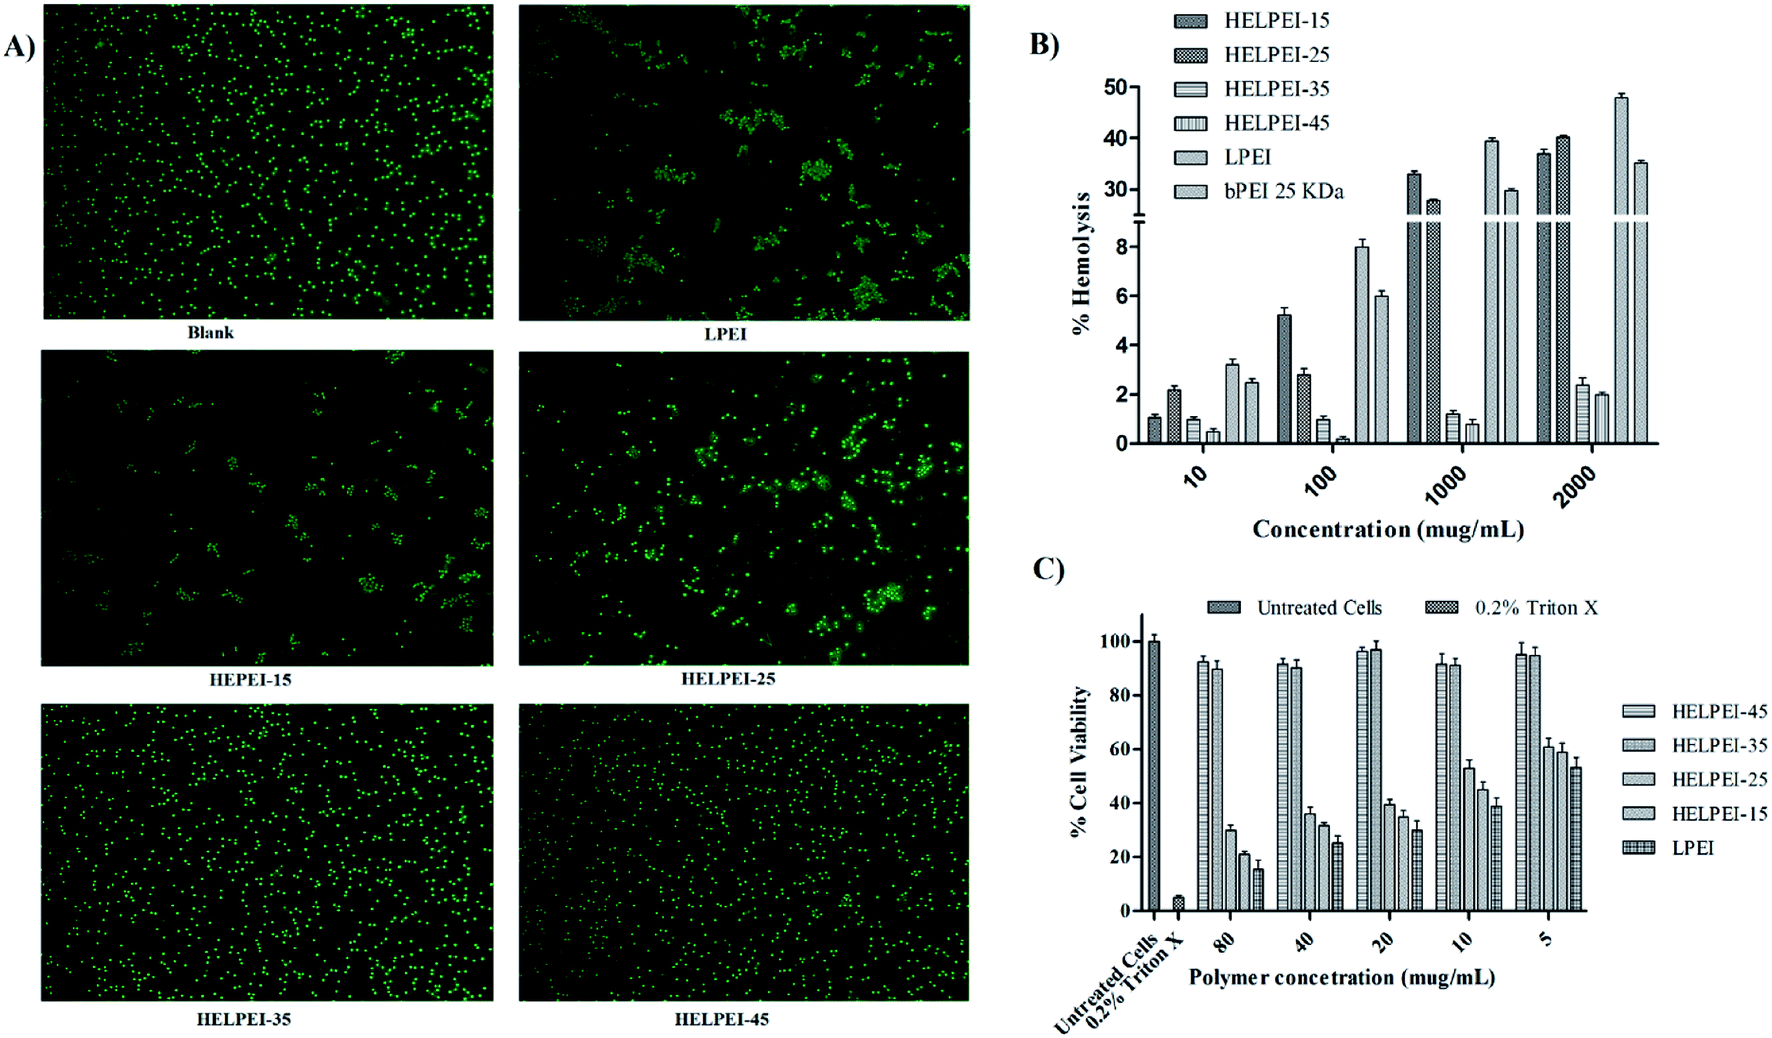 | ||
| Fig. 4 (A) Results of erythrocyte aggregation study; (B) hemolytic potential of different HELPEIs at different concentrations; (C) cytotoxic potential of polymers at different concentrations. | ||
In case of HELPEIs, it was observed that the cytotoxicity decreased with increase in DS. This was attributed to cumulative effect of decrease in the charge density at physiologic pH of 7.4, alteration in structural and conformational property, as well as increased hydrophilicity. At DS of 15% and 25% there was significant toxicity (p < 0.05). However, after further increase in DS, HELPEI-35 and HELPEI-45 showed significant improvement in cell viability, almost ∼90% and more at all concentrations, compared to other polymers (p < 0.05). Therefore, based on biocompatibility studies, HELPEI-35 and HELPEI-45 were concluded as desired safe vectors and were considered for further characterization.
3.7. Stability challenge studies
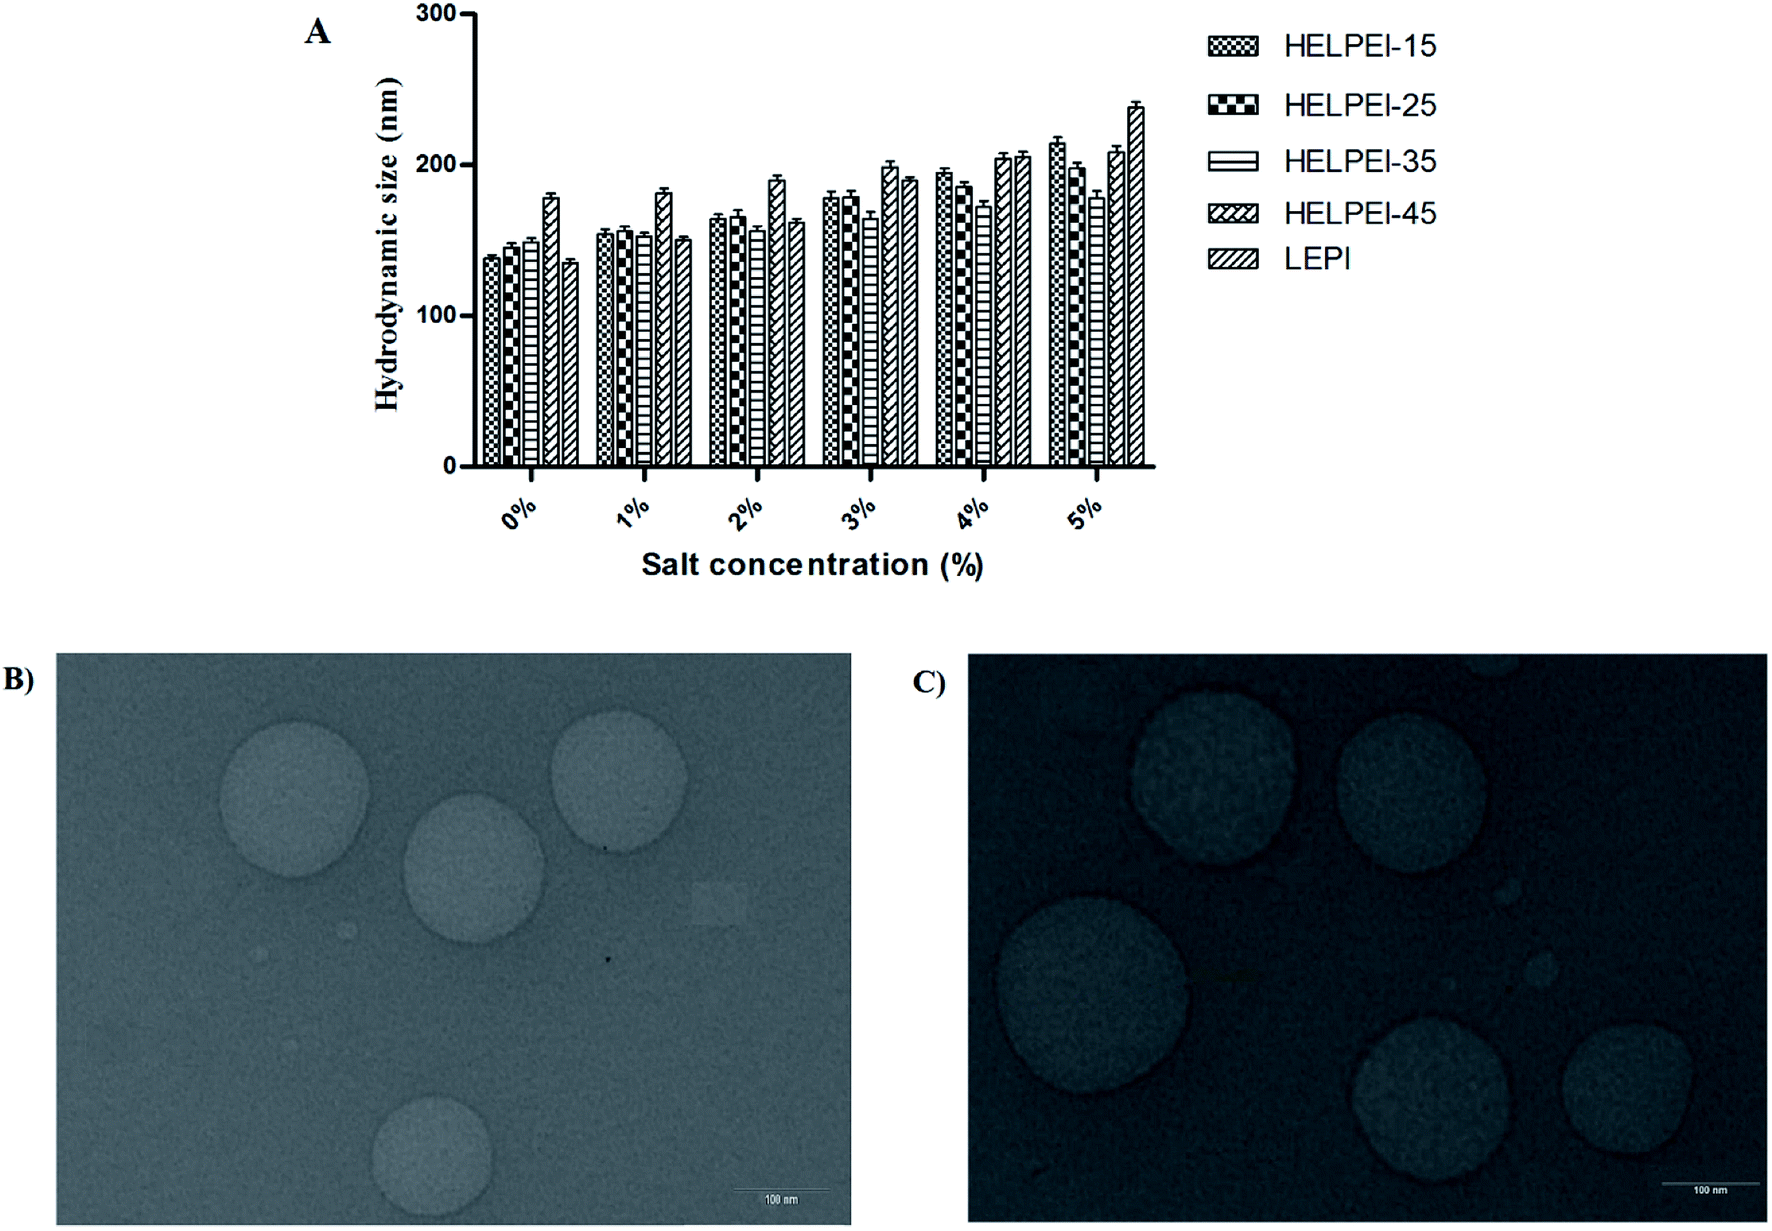 | ||
| Fig. 5 (A) Electrolyte induced flocculation. (B) TEM image of HELPEI-35 polyplex; (C) TEM image of HELPEI-45 polyplex. | ||
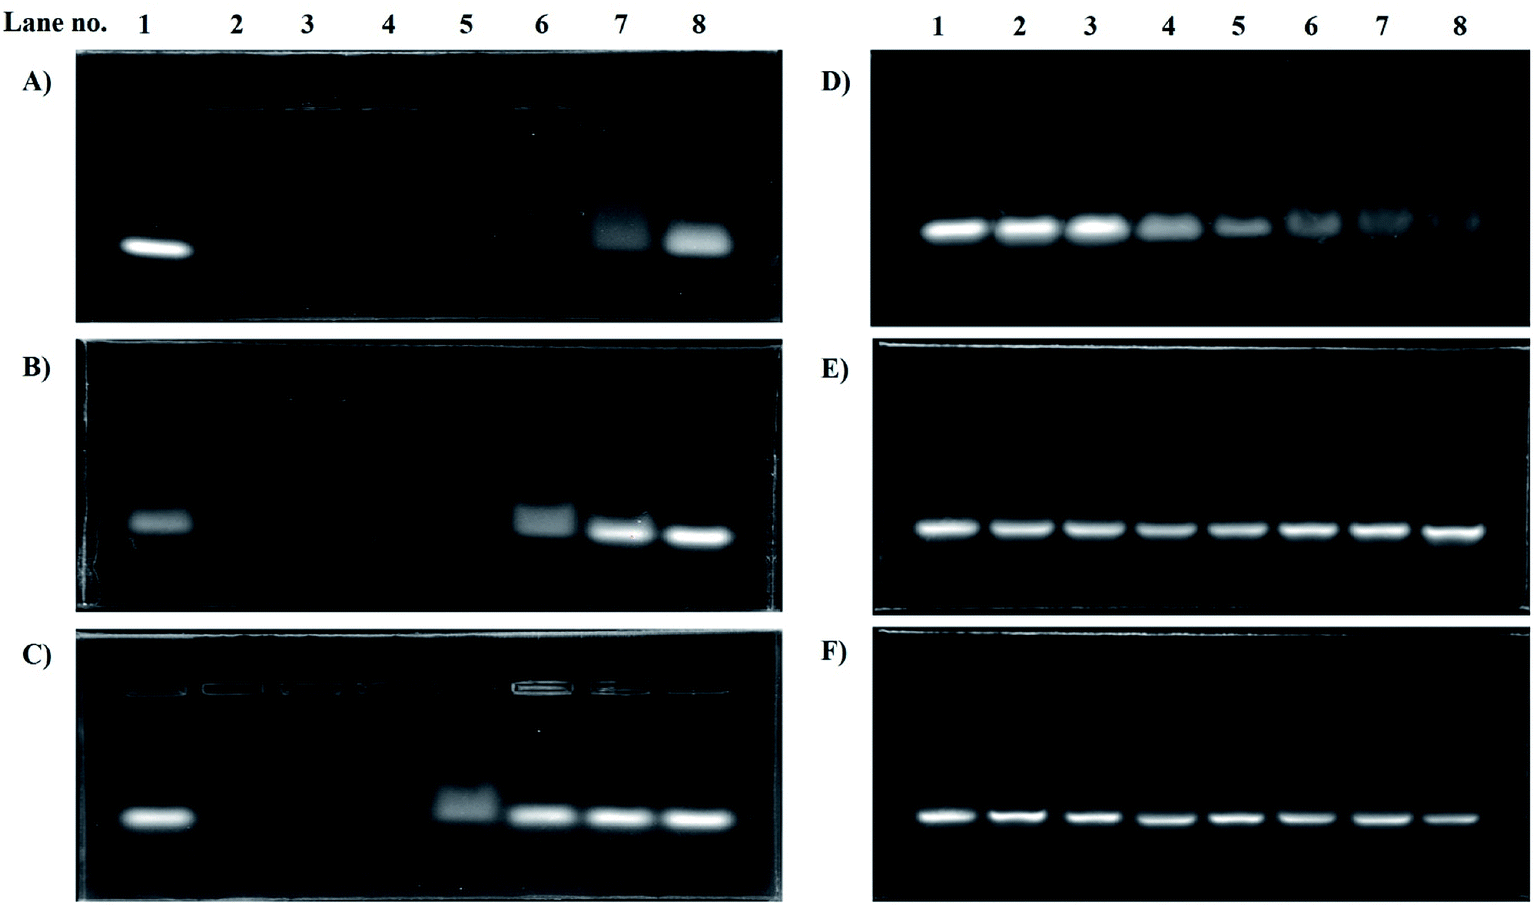 | ||
| Fig. 6 (A–C) Resistance to heparin displacement assay of polyplexes of (A) LPEI; (B) HELPEI-35; (C) HELPEI-45 heparin/siRNA w/w ratio: lane1: naked siRNA, lane 2: 0.25, lane 3: 0.5, lane 4: 1.0, lane 5: 1.5, lane 6: 2, lane 7: 3, lane 8: 4). (D–F) Serum stability study showing siRNA released at time points: (D) naked siRNA at time lane 1 = 0 h, lane 2 = 0.5 h, lane 3 = 1.0 h, lane 4 = 2.0 h, lane 5 = 3.0 h, lane 6 = 4.0 h, lane 7 = 5.0 h, lane 8 = 6.0 h; (E and F) HELPEI-35 and HELPEI-65 respectively at times: lane 1 = 0 h, lane 2 = 1.0 h, lane 3 = 2.0 h, lane 4 = 4.0 h, lane 5 = 8.0 h, lane 6 = 16 h, lane 7 = 24 h. | ||
3.8. TEM
Fig. 5B shows the morphology of the HELPEI-35 and HELPEI-45 polyplexes as observed through TEM. The TEM images showed that polyplexes were spherical and compact. They were discrete with no visible evidence of aggregation, proving the homogenous state of system. The images support the light scattering data; however, the size was relatively smaller than that observed in DLS measurement. The effect might be result of recording of hydrodynamic radius of the particles in DLS which is more than the actual size.3.9. Cell uptake
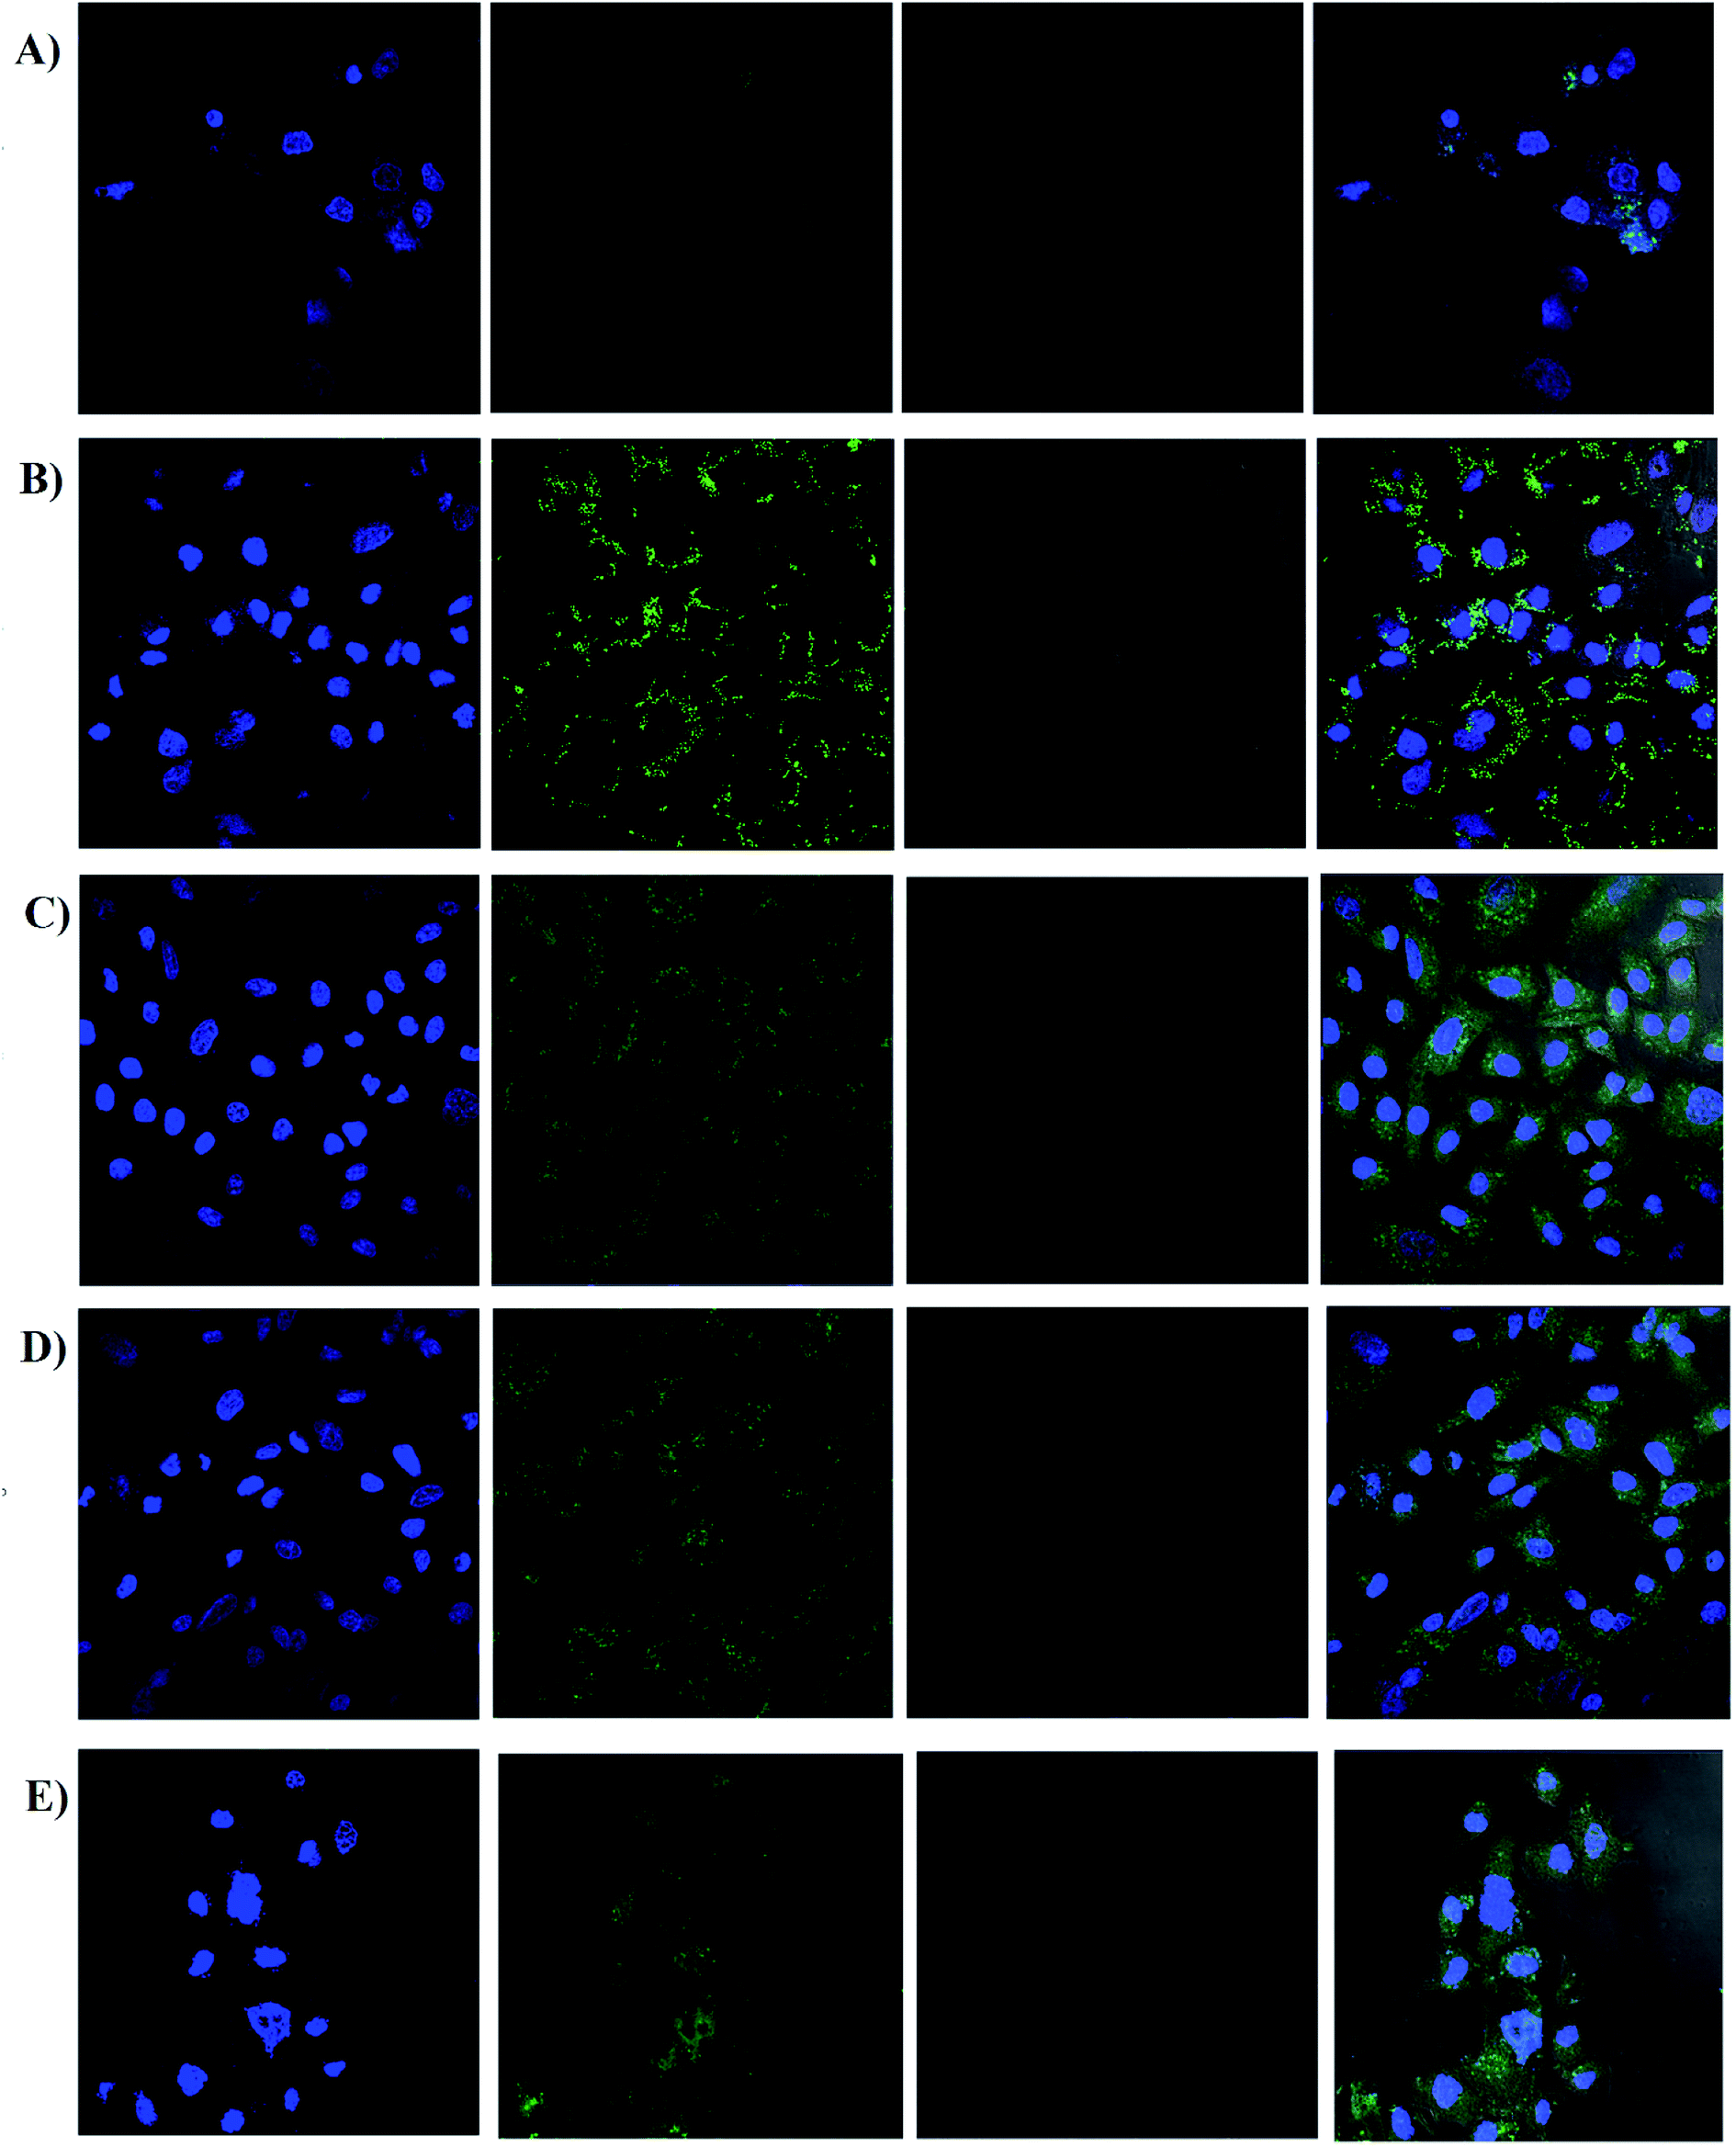 | ||
| Fig. 7 Cell uptake of screened formulations by confocal microscopy; (A) naked siRNA, (B) LPEI polyplexes, (C) HELPEI-35 polyplexes, (D) HELPEI-45 polyplexes, (E) L2K lipoplexes. | ||
On the other hand, LPEI, being cationic charged, forms polyplexes with siRNA and protects it from degradation. However, LPEIs association with the cells had a typical pattern, in which fluorescence was observed around cell membrane high-lighting the periphery of cell. The literature reports also show similar observations in case of LPEI.23,36 In contrast, polyplexes of HELPEI-35 and HELPEI-45 showed considerable uptake compared to naked siRNA. The fluorescence was throughout the cytoplasm rather than at the cell periphery, which indicates good cytoplasmic intake of siRNA. Literature reports that, PEGylated carriers interfere with cell interaction due to presence of large hydration shell leading to lower cell uptake.37 However, the small length hydrophilic groups used in present case did not interfere with cell surface interaction.
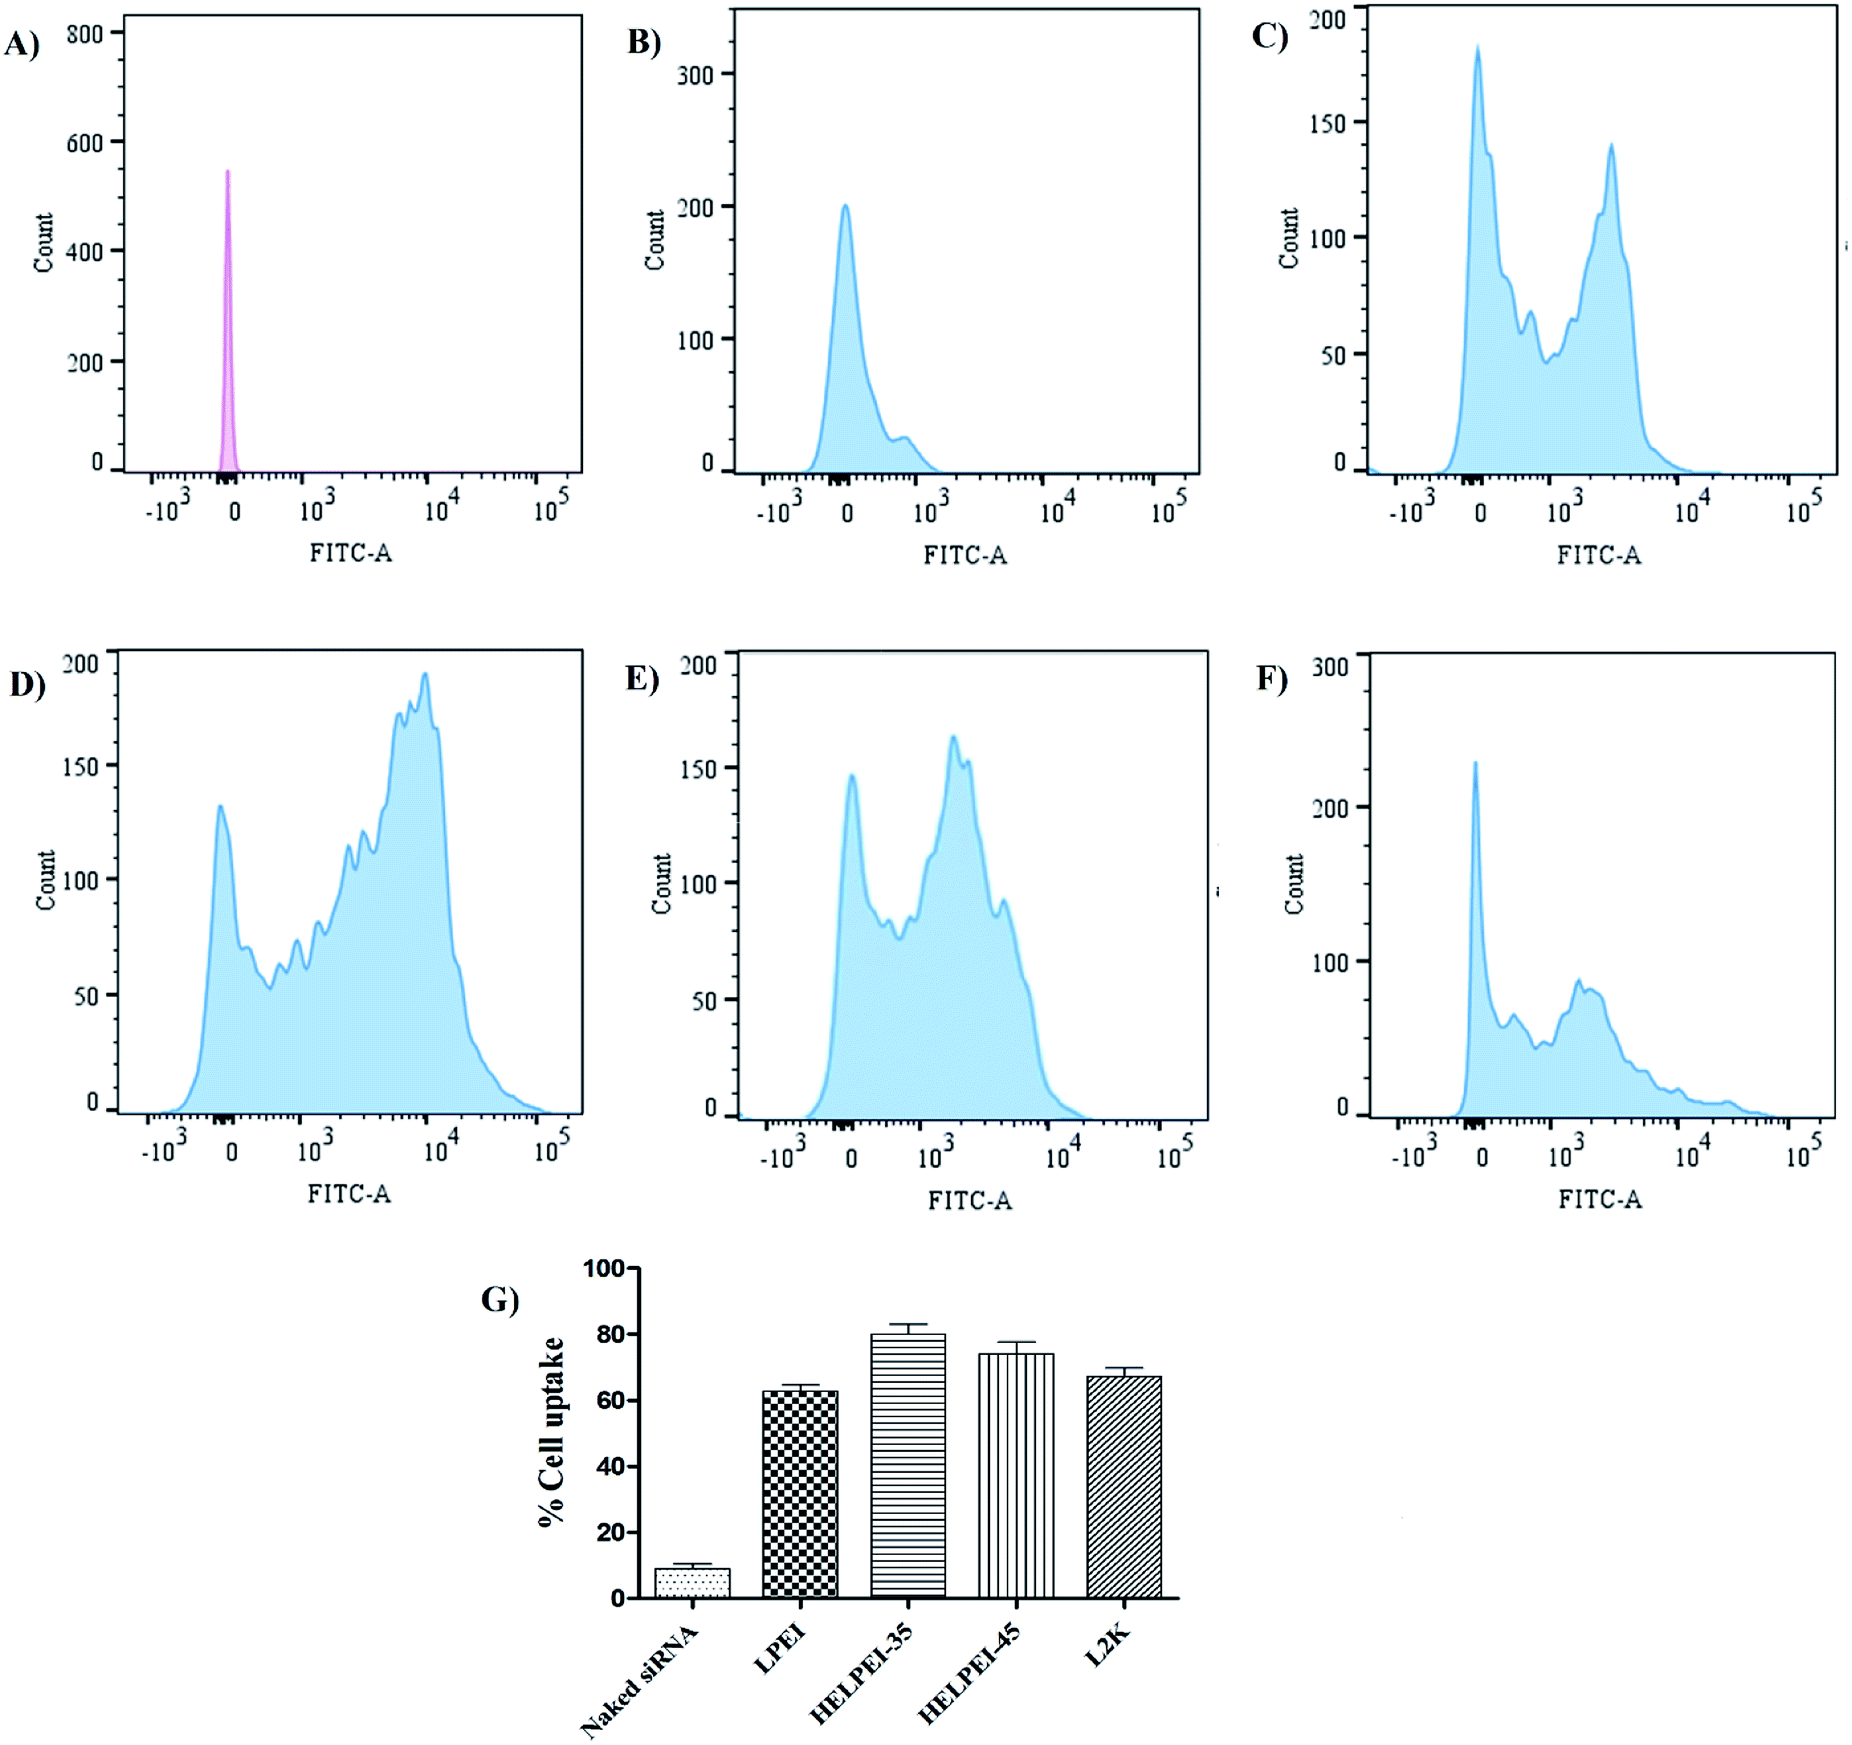 | ||
| Fig. 8 Histograms of FACS analysis, (A) unstained control, (B) naked siRNA, (C) LPEI polyplexes, (D) HELPEI-35 polyplexes, (E) HELPEI-45 polyplexes, (F) L2K lipoplexes and (G) % cell uptake observed in FACS. | ||
Comparison of HEPEI-35 and HELPEI-45 polyplexes showed that cell uptake in case of HELPEI-35 was higher than that of HELPEI-45 (p < 0.05). This means that increased DS beyond certain point does not lead to increase in cell uptake, which may be due to poor cell interaction as a result of significant suppression of ionization. The developed biocompatible HELPEI-35 and HELPEI-45 showed a significant improvement (p < 0.05) in cell uptake compared to LPEI. Thus, based on FACS data the order of cell uptake of analyzed formulations could be stated as: HELPEI-35 > HEPEI-45 > L2K > LPEI > naked siRNA.
3.10. RT-PCR
To study the gene knockdown real time PCR was used. The cells were transfected with siRNA concentration at 25 nM, 50 nM and 100 nM. To confirm that gene silencing was due to siRNA only and not due to any off-target effect or non-specific inhibitions, we also included polyplexes of HELPEI-35-NC-siRNA, which showed negligible gene knockdown compared to the control. As shown in Fig. 9, highest knockdown was observed at 100 nM siRNA. At this level, naked siRNA showed 89.03 ± 3.38% gene expression. At the same concentration HELPEI-35 and HELPEI-45 polyplexes showed 33.32 ± 6.39% and 30.54 ± 5.14% gene expression, respectively, which was significantly higher than LPEI. Lipofectamine (L2K), also showed good transfection efficiency (43.34 ± 5.16%).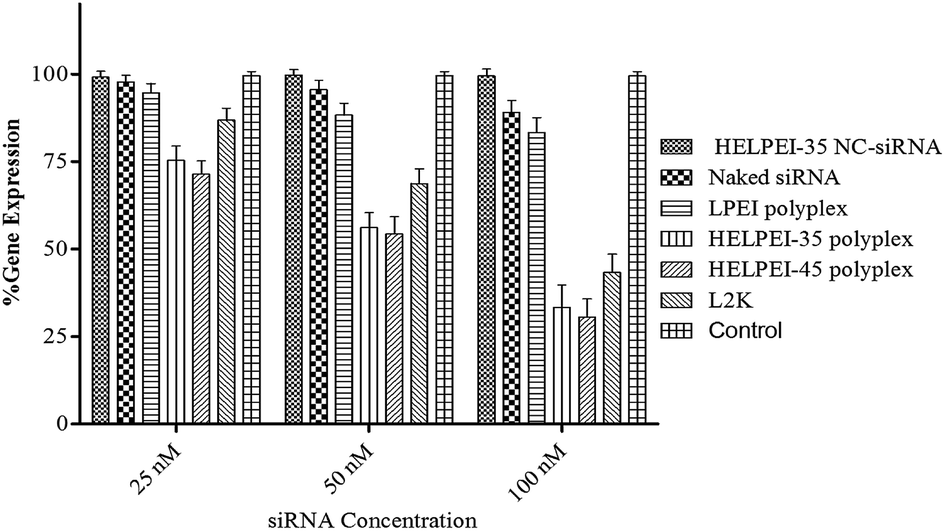 | ||
| Fig. 9 % gene expression in CFBE41o- cells after treatment LPEI based formulations. | ||
Although FACS studies had shown good cell uptake for LPEI, the transfection was not in concordance with it. This can be explained by confocal studies which showed that cellular association of LPEI was preferentially on the membrane with little cytoplasmic appearance. It might be possible that surface associated polyplex were not internalized or unable to escape from endosomes after internalization. Thus, positive surface character may ensure cell attachment, the subsequent endosomal escape and unloading is a limiting factor in gene expression. Similarly, cationic polymers such as poly-L-lysine, poly arginine etc. are less efficient in transfection because of their poor endosomal escape capacity.38
The endosomal escape is essential, otherwise the nucleic acid is readily degraded following drop in pH in endosomal–lysosomal pathway. The superiority of HELPEIs over LPEI could be attributed to higher buffer capacity (Table 1) and greater cytoplasmic uptake as observed in confocal images. Further, though HELPEI-35 and HELPEI-45 polymer were equivalent in buffer capacity, the difference in gene expression between HELPEI-35 and HELPEI-45 polyplexes can be explained based on results of FACS, which showed that, HELPEI-35 polyplexes were more efficient in cell uptake due to greater positive surface charge than HELPEI-45 polyplexes.
4. Conclusion
The study demonstrates the beneficial effect of proposed modification of LPEI on the physicochemical and biological properties of LPEI. Compared to other PEI modification, which require tedious and multistep synthesis, the present study provides a simple alternative. The results showed that hydroxyethyl substitution improved the hydration properties, solubility of LPEI. Further, it changed the ionization behavior due to conversion of secondary amines into tertiary amines and next-nearest-neighbor interactions leading to suppression of ionization. The suppressed ionization led to decreased surface charge at physiologic pH along with a possible change in conformational flexibility leading to reduced hemolytic potential and cytotoxicity. The study also showed that with proper choice of DS, the suppression of ionization can be influenced in way so as to benefit the most important aspect of nucleic acid delivery i.e. proton sponge capacity and endosomal escape. Finally, cell uptake and transfection behavior demonstrated the potential for safe and efficacious delivery of siRNA.Conflicts of interest
There are no conflicts to declare.Acknowledgements
We are grateful to financial support from University Grant Commission (UGC), INDIA, in the form of fellowship. Authors are also thankful to Vikram Sarabhai central instrumentation facility, Maharaja Sayajirao University of Baroda for confocal and FACS studies.References
- N. Schütze, Mol. Cell. Endocrinol., 2004, 213, 115–119 CrossRef PubMed.
- K. A. Whitehead, R. Langer and D. G. Anderson, Nat. Rev. Drug Discovery, 2009, 8, 129–138 CrossRef CAS PubMed.
- H. Y. Xue, S. Liu and H. L. Wong, Nanomedicine, 2014, 9, 295–312 CrossRef CAS PubMed.
- C. I. Contescu, K. Putyera and J. A. Schwarz, Dekker Encyclopedia of Nanoscience and Nanotechnology, CRC Press Taylor & Francis Group, 2009, vol. 1 Search PubMed.
- Y. W. Cho, J. D. Kim and K. Park, J. Pharm. Pharmacol., 2003, 55, 721–734 CrossRef CAS PubMed.
- R. Goyal, S. K. Tripathi, S. Tyagi, A. Sharma, K. R. Ram, D. K. Chowdhuri, Y. Shukla, P. Kumar and K. C. Gupta, Nanomedicine: Nanotechnology, Biology and Medicine, 2012, 8, 167–175 CrossRef CAS PubMed.
- J. Suh, H.-j. Paik and B. K. Hwang, Bioorg. Chem., 1994, 22, 318–327 CrossRef CAS.
- J. D. Ziebarth and Y. Wang, Biomacromolecules, 2010, 11, 29–38 CrossRef CAS PubMed.
- A. Kichler, M. Chillon, C. Leborgne, O. Danos and B. t. Frisch, J. Controlled Release, 2002, 81, 379–388 CrossRef CAS PubMed.
- P. Banerjee, R. Weissleder and A. Bogdanov, Bioconjugate Chem., 2006, 17, 125–131 CrossRef CAS PubMed.
- J. H. Jeong, S. H. Song, D. W. Lim, H. Lee and T. G. Park, J. Controlled Release, 2001, 73, 391–399 CrossRef CAS PubMed.
- J. Dai, S. Zou, Y. Pei, D. Cheng, H. Ai and X. Shuai, Biomaterials, 2011, 32, 1694–1705 CrossRef CAS PubMed.
- H. Koo, G.-w. Jin, H. Kang, Y. Lee, K. Nam, C. Z. Bai and J.-S. Park, Biomaterials, 2010, 31, 988–997 CrossRef CAS PubMed.
- A. von Harpe, H. Petersen, Y. Li and T. Kissel, J. Controlled Release, 2000, 69, 309–322 CrossRef CAS PubMed.
- C. Lin and J. F. Engbersen, Mater. Sci. Eng., Proc. Conf., 2011, 31, 1330–1337 CrossRef CAS.
- H. A. Liu, Y. L. Liu, Z. Z. Ma, J. C. Wang and Q. Zhang, Invest. Ophthalmol. Visual Sci., 2011, 52, 4789–4794 CrossRef CAS PubMed.
- H. Katas and H. O. Alpar, J. Controlled Release, 2006, 115, 216–225 CrossRef CAS PubMed.
- L. Aravindan, K. A. Bicknell, G. Brooks, V. V. Khutoryanskiy and A. C. Williams, Int. J. Pharm., 2009, 378, 201–210 CrossRef CAS PubMed.
- P. Bhatt, R. Lalani, I. Vhora, S. Patil, J. Amrutiya, A. Misra and R. Mashru, Int. J. Pharm., 2018, 536, 95–107 CrossRef CAS PubMed.
- A. Kolate, G. Kore, P. Lesimple, D. Baradia, S. Patil, J. W. Hanrahan and A. Misra, J. Microencapsulation, 2014, 1–14 Search PubMed.
- K. Singarapu, I. Pal and J. D. Ramsey, J. Biomed. Mater. Res., Part A, 2013, 101, 1857–1864 CrossRef PubMed.
- R. Smits, G. Koper and M. Mandel, J. Phys. Chem., 1993, 97, 5745–5751 CrossRef CAS.
- F. W. Huang, H. Y. Wang, C. Li, H. F. Wang, Y. X. Sun, J. Feng, X. Z. Zhang and R. X. Zhuo, Acta Biomater., 2010, 6, 4285–4295 CrossRef CAS PubMed.
- G. P. Tang, J. M. Zeng, S. J. Gao, Y. X. Ma, L. Shi, Y. Li, H. P. Too and S. Wang, Biomaterials, 2003, 24, 2351–2362 CrossRef CAS PubMed.
- S. Patil, P. Bhatt, R. Lalani, J. Amrutiya, I. Vhora, A. Kolte and A. Misra, RSC Adv., 2016, 6, 110951–110963 RSC.
- D. Fischer, Y. Li, B. Ahlemeyer, J. Krieglstein and T. Kissel, Biomaterials, 2003, 24, 1121–1131 CrossRef CAS PubMed.
- A. M. Doody, J. N. Korley, K. P. Dang, P. N. Zawaneh and D. Putnam, J. Controlled Release, 2006, 116, 227–237 CrossRef CAS PubMed.
- I. Sovadinova, E. F. Palermo, R. Huang, L. M. Thoma and K. Kuroda, Biomacromolecules, 2011, 12, 260–268 CrossRef CAS PubMed.
- T. L. Fabry, Blood, 1987, 70, 1572–1576 CAS.
- S. M. Moghimi, P. Symonds, J. C. Murray, A. C. Hunter, G. Debska and A. Szewczyk, Mol. Ther., 2005, 11, 990–995 CrossRef CAS PubMed.
- E. Verwey, Chem. Rev., 1935, 16, 363–415 CrossRef CAS.
- S. N. Siegman, 2014.
- P. Vader, L. J. van der Aa, J. F. Engbersen, G. Storm and R. M. Schiffelers, Pharm. Res., 2012, 29, 352–361 CrossRef CAS PubMed.
- A. A. Foster, C. T. Greco, M. D. Green, T. H. Epps 3rd and M. O. Sullivan, Adv. Healthcare Mater., 2015, 4, 760–770 CrossRef CAS PubMed.
- C. Troiber, D. Edinger, P. Kos, L. Schreiner, R. Klager, A. Herrmann and E. Wagner, Biomaterials, 2013, 34, 1624–1633 CrossRef CAS PubMed.
- L. Wightman, R. Kircheis, V. Rossler, S. Carotta, R. Ruzicka, M. Kursa and E. Wagner, J. Gene Med., 2001, 3, 362–372 CrossRef CAS PubMed.
- S. Fuxin, L. Wasungu, A. Nomden, M. C. Stuart, E. Polushkin, J. B. Engberts and D. Hoekstra, Biochem. J., 2002, 366, 333–341 CrossRef PubMed.
- W. Liang and J. K. Lam, Endosomal escape pathways for non-viral nucleic acid delivery systems, INTECH Open Access Publisher, 2012 Search PubMed.
| This journal is © The Royal Society of Chemistry 2018 |