
 Open Access Article
 This Open Access Article is licensed under a Creative Commons Attribution-Non Commercial 3.0 Unported Licence
Controlling the electrical conductive network formation in nanorod filled polymer nanocomposites by tuning nanorod stiffness†
Yangyang Gao abc,
Ruibin Maabc,
Huan Zhangd,
Jun Liua,
Xiuying Zhao*abc and
Liqun Zhang*abc
abc,
Ruibin Maabc,
Huan Zhangd,
Jun Liua,
Xiuying Zhao*abc and
Liqun Zhang*abc
aKey Laboratory of Beijing City on Preparation and Processing of Novel Polymer Materials, Beijing University of Chemical Technology, 10029, People's Republic of China. E-mail: zhanglq@mail.buct.edu.cn; zhaoxy@mail.buct.edu.cn
bState Key Laboratory of Organic-Inorganic Composites, Beijing University of Chemical Technology, 10029, People's Republic of China
cBeijing Engineering Research Center of Advanced Elastomers, Beijing University of Chemical Technology, 10029, People's Republic of China
dAerospace Research Institute of Materials and Processing Technology, Beijing, 100076, People's Republic of China
First published on 28th August 2018
Abstract
In this work, by employing a coarse-grained molecular dynamics simulation, we have investigated the effect of the nanorod (NR) stiffness on the relationship between the NR microstructure and the conductive probability of NR filled polymer nanocomposites (PNCs) under the quiescent state and under the shear field. The conductive probability of PNCs is gradually enhanced with the increase of NR stiffness in the quiescent state; however, it first increases and then decreases under the shear field. As a result, the largest conductive probability appears at moderate NR stiffness, which results from the competition between the improved effective aspect ratio of the NR and the breakage of the conductive network. Meanwhile, compared with in the quiescent state, under the shear field the decrease or the increase of the conductive probability depends on the NR stiffness. At low NR stiffness, the increase of the effective aspect ratio of NR enhances the conductive probability, while at high NR stiffness, the breakage of the conductive network reduces the conductive probability. For flexible NRs, the conductive probability first increases and then decreases with increasing the shear rate. The maximum effective aspect ratio of NRs appears at the moderate shear rate, which is consistent with the conductive probability. In summary, this work presents some further understanding about how NR stiffness affects the electric conductive properties of PNCs under the shear field.
1. Introduction
Addition of a conductive filler (such as carbon black (CB), carbon nanotubes (CNTs), graphene) into an insulating polymer matrix can markedly improve the electrical properties of polymer nanocomposites (PNCs) by orders of magnitude.1–5 The conductive network is formed if the filler volume fraction reaches the percolation threshold, which can be described by the percolation theory.6 From the application viewpoint, it is very important to reduce the percolation threshold, which can improve the electrical conductivity and reduce cost for manufacturing materials.Currently, some reviews2,7,8 have summarized the methods to tune and control the conductive network, which can help understand the relationship between the experimental parameters and the conductivity. For example, the polymer–filler interaction affects the formation of the conductive network, which further influences the electrical properties.9,10 The dependence of the percolation threshold on the aspect ratio of CNT can be described by a model, which could optimize the CNTs' processing conditions.11 The shear is an important method during the processing of PNCs, which will affect the electrical conductivity. To correctly predict it, it is very important to understand the response of the conductive network under the shear field. Kharchenko et al.12 first reported the destruction of the conductive network under the shear field for the initially partially aggregated CNTs in PP matrix. The shear field can destroy the conductive network, which reduce the electrical properties.13 For the well dispersed CNTs, the insulator–conductor transition happens, which is attributed to the formation of the conductive network induced by the shear field.14 However, it is very difficult to intuitively analyze the variation of the conductive network and electrical properties by experimental methods. Computer simulation and models provide another good choice to study the electrical conductivity behavior. Currently, by adopting the critical path method, the electrical conductivity can be extracted from the critical distance between nanorods (NRs).15–18 By employing the continuum percolation theory, the percolation threshold is reported to depend on the aspect ratio19 and the size polydispersity20,21 of NR. The depletion effect of insulating spheres (not conductive filler) can induce the effective attraction between NRs (conductive filler), which enhance the conductivity of PNCs.22,23 By utilizing Monte Carlo model, it reveals an exponential relationship between the fiber aspect ratio and the percolation threshold.24 In addition, the high size polydisperse increases the percolation threshold, which is approximately inversely upon the weight-averaged aspect ratio.25 The contribution of longer CNTs to the formation of conductive network is through linking the shorter CNTs.26,27 By employing molecular dynamics simulation, nanorods are more effective in forming a percolating network at a lower volume fraction than nanoplates and nanospheres.28 The anisotropy of the electrical property of aligned CNT/polymer composites is mainly affected by the average conductive pathway density of CNTs.29 Under the shear field, the shear-induced CNT orientation reduces the percolation threshold of PNCs along the shear direction.30 Especially, the highest electrical conductivity occurs when the CNTs are partially rather than perfectly aligned.31,32 Interestingly, when the shear rate is beyond a critical value, the conductive network is broken down because of CNT aggregation.33 In addition, both the shear rate and the CNT aspect ratio influence the formation and destruction of the conductive aggregates, which further affect the electrical conductivity.34,35
In fact, fillers are flexible if they have a very large aspect ratio.36,37 The effective aspect ratio of flexible fillers is lower than that of the straight fillers, which will have a considerable effect on the electrical conductivity. It is noted that the effective aspect ratio is defined as the ratio of the end-to-end distance of filler to the diameter of filler (1σ). Current works26,28,38–40 indicate that the flexible fillers tend to increase the percolation threshold. However, the effect of filler stiffness on the conductive behavior of PNCs under the shear field has not been investigated to our knowledge. In this work, by adopting a coarse-grain model, first, the microstructure and the kinetics of the NR in the matrix is characterized for different NR stiffness. Then, the conductive probability of PNCs is calculated under the quiescent state and under the shear field. Here, we mainly considered three kinds of conductive probabilities, namely homogeneous conductive probability Λ, directional conductive probability Λ∥ parallel to the shear field direction, and directional conductive probability Λ⊥ perpendicular to the shear field direction.
2. Simulation details
In this work, a coarse-grained model of NRs filled polymer nanocomposites is adopted. The classic bead-spring model41 is adopted to simulate polymer chains which consist of thirty beads. The total number of polymer beads for each system is fixed at 42![[thin space (1/6-em)]](https://www.rsc.org/images/entities/char_2009.gif) 000. Each NR contains ten beads. Two symbols σ and m are adopted to stand for the diameter and mass of each bead (polymer and NRs), respectively.42,43 Although these chains are rather short compared to real chains, they are already able to display the static and dynamic characteristic behavior of long chains. Each bond in this model corresponds to three to six covalent bonds along the backbone of a real chemical chain when mapping the coarse-grained model to a real polymer.
000. Each NR contains ten beads. Two symbols σ and m are adopted to stand for the diameter and mass of each bead (polymer and NRs), respectively.42,43 Although these chains are rather short compared to real chains, they are already able to display the static and dynamic characteristic behavior of long chains. Each bond in this model corresponds to three to six covalent bonds along the backbone of a real chemical chain when mapping the coarse-grained model to a real polymer.
A stiff finite extensible nonlinear elastic (FENE) potential41 is used to represent the bonded interaction between the adjacent beads including both polymer chains and NRs, which is given by
 | (1) |
 and R0 = 1.5σ, guaranteeing a certain stiffness of the bonds while avoiding high-frequency modes and chain crossing.
The non-bonded interactions between all the beads are described using a truncated and shifted Lennard-Jones (LJ) potential, given by
 | (2) |
The rod-like character of the NR is enforced by a bending potential, given by
| Uangle = Kstiffness(θ − θ0)2 | (3) |
Since it is not our aim to study a specific polymer, the LJ units (distance = σ, mass = m, interaction energy = ε) are set to unit. The reduced units of other quantities (temperature, density, pressure and time) are adopted, defined as: kBT/ε, ρσ3, Pσ3/ε and  respectively. Similar to our previous work,44–46 first, all the polymer chains and NRs are put into a large box. Then we adopted the NPT ensemble to compress the system for 20000τ, where the temperature and pressure are fixed at T* = 1.0 and P* = 0.0 respectively by using the Nose–Hoover temperature thermostat and pressure barostat. Further equilibration under NVT with T* = 1.0 is performed for 50000τ. It is noted that each chain has moved at least 2Rg during the long simulation process. We have checked that polymer chains and NRs have experienced fully relaxed, reaching their equilibrated states for all systems. The equilibrium number density of polymer beads reaches nearly 0.85 corresponding to the density of polymer melts. Such equilibrated structures are then used as starting structures for production runs of the structural and dynamical analysis. During the simulation process, periodic boundary conditions are employed in all three directions. The velocity-Verlet algorithm is applied to integrate the equations of motion with a timestep of δt = 0.001τ, where the time is reduced by LJ unit time (τ). All MD runs are carried out by using the large scale atomic/molecular massively parallel simulator (LAMMPS).47
First, to determine whether the conductive network is formed, a criterion is used to check whether any two NRs are connected. If the gap of two NRs is less than the tunneling distance (TD), they are considered to be connected. TD can stand for the contact conductance between a pair of the NRs.48 High TD indicates the high contact conductance. Here, the tunneling distance is chosen to be 1.0σ from the two aspects (one is the sandwiched polymer chain, another is that the ratio of CNT diameter to the maximum TD is nearly 1.0 in experiment49). It is noted that TD impacts upon the percolation threshold, which scales with the reciprocal TD for long rods. However, it does not affect the trend of the results. In addition, TD is fixed even though it maybe affected by both shear and bending flexibility.
At the beginning of the computational implementation, each NR is assigned a site number and a cluster number.24,50 The site number is equal to the cluster number, ranging from 1 to N, where N is the total number of NRs. Then each NR is checked for connection with others. If two NRs are connected, they will be assigned a common cluster number. Finally, all the NRs with the same cluster number are in the same cluster. As a result, NRs with different cluster numbers are not connected. If the NR network spans one direction continuously from one side to another, the system is conductive in this direction. If the NR network spans the three-dimensional directions continuously, the system is homogeneously conductive in three directions. Last, more than 10000 equilibrated configurations are dumped to perform the data analysis. The time interval between two continuous frames is 10τ. Finally, the number of the configurations, which is conductive in the three-dimensional directions or in one direction, is counted. The conductive probability Λ, directional conductive probability Λ∥ parallel to the shear field direction, and directional conductive probability Λ⊥ perpendicular to the shear direction are used to represent the formation probability of the filler network, which spans the systems in the three-dimensional directions, parallel to the shear direction, and perpendicular to the shear direction, respectively.
3. Results and discussion
3.1 Conductive property of PNCs
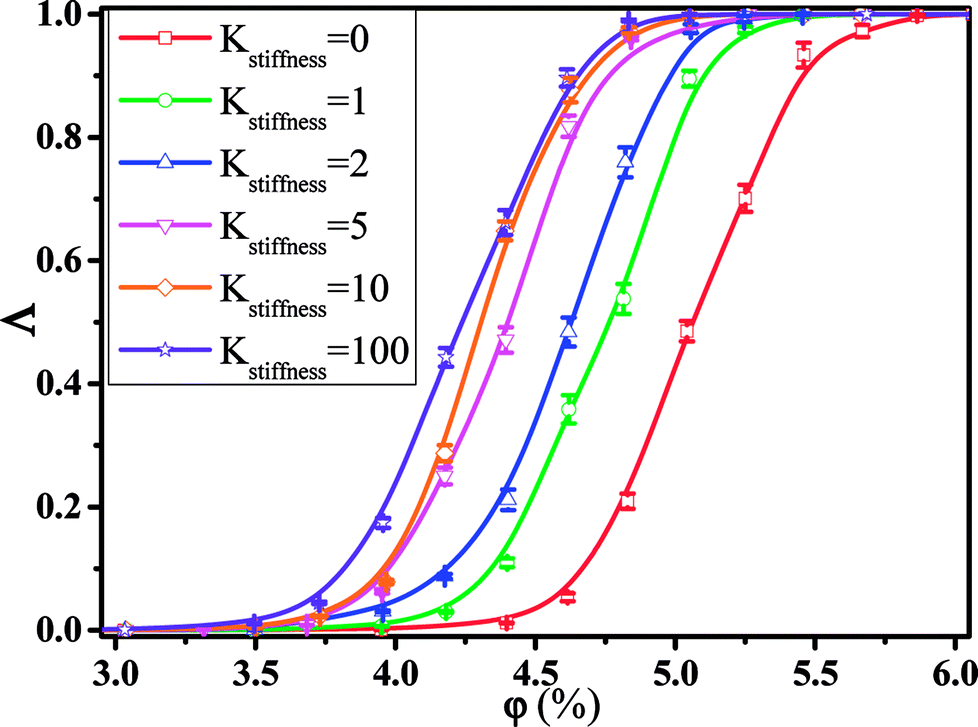 | ||
| Fig. 1 Conductive probability Λ of polymer nanocomposites as a function of the nanorod volume fraction φ for different nanorod stiffness (Kstiffness). (T* = 1.0). | ||
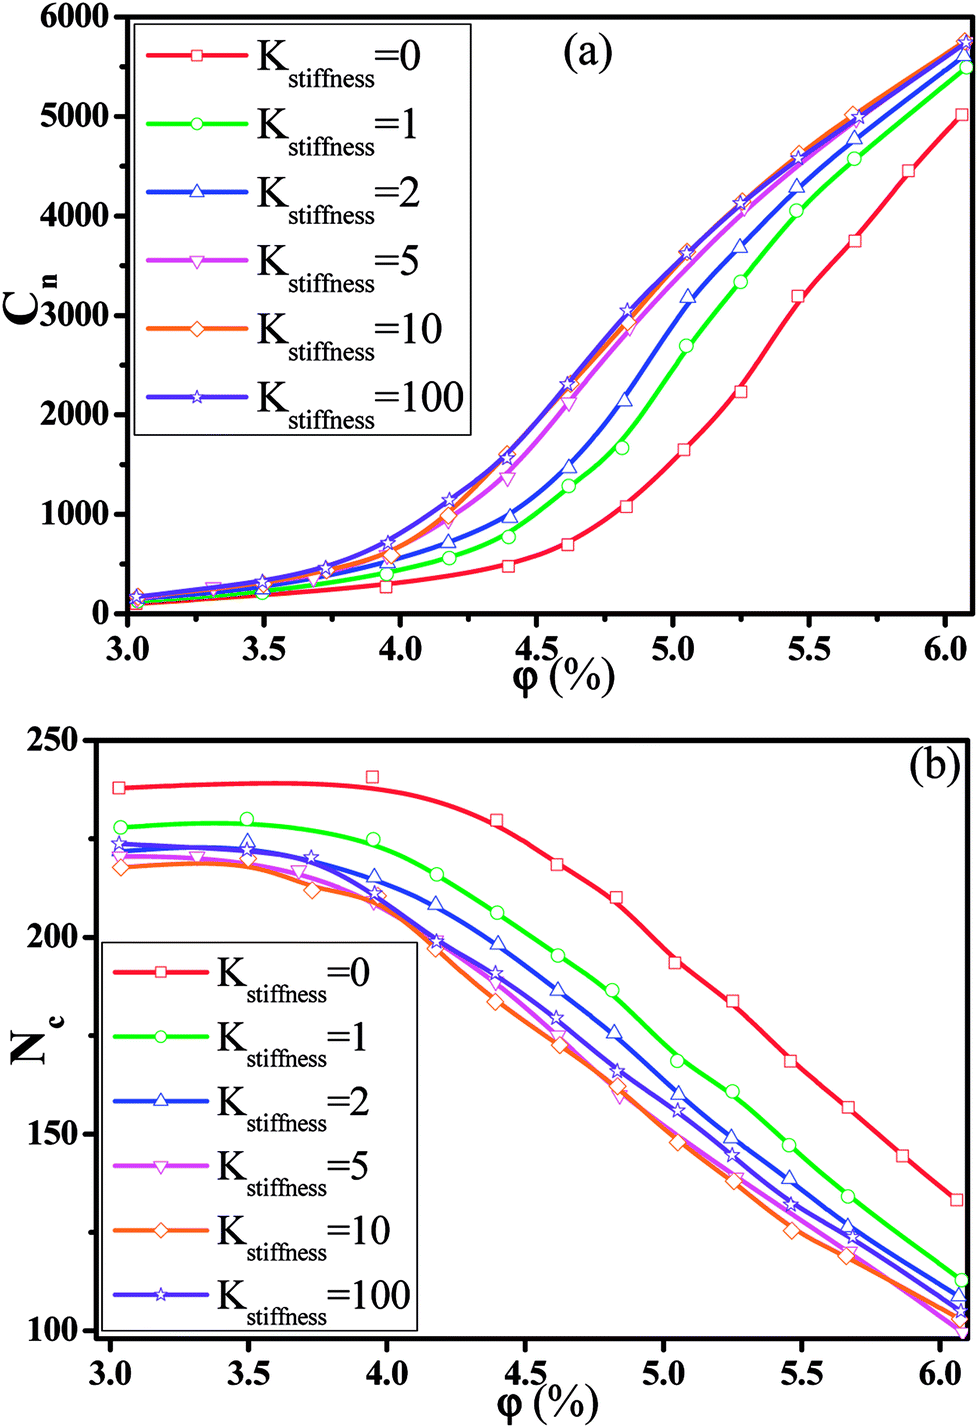 | ||
| Fig. 2 Change of (a) the main cluster size Cn and (b) the total number of clusters Nc as a function of the nanorod volume fraction φ for different nanorod stiffness (Kstiffness). (T* = 1.0). | ||
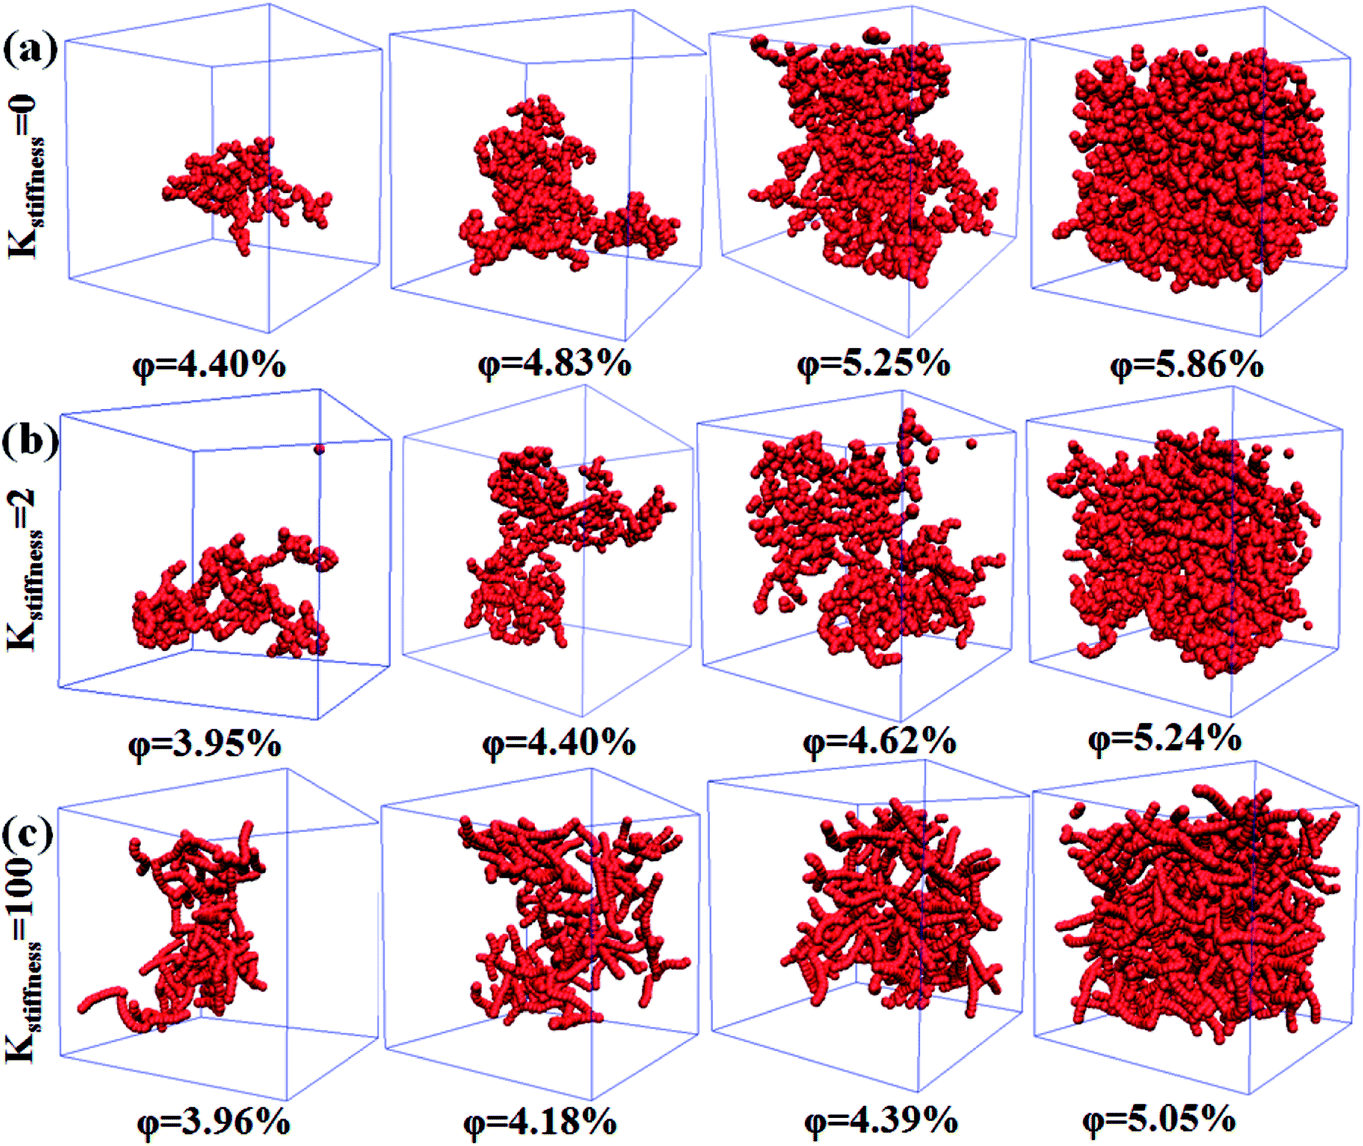 | ||
| Fig. 3 Some typical snapshots of the main cluster with different nanorod stiffness (a) Kstiffness = 0, (b) Kstiffness = 2, and (c) Kstiffness = 100 at four nanorod volume fractions φ. The red spheres denote the nanorods with the main cluster. (T* = 1.0). | ||
First, we investigated the effect of the shear rate ![[small gamma, Greek, dot above]](https://www.rsc.org/images/entities/i_char_e0a2.gif) on the conductive probability of PNCs by fixing the NR Kstiffness equal to 2, where NRs can straighten under the shear field. Change of Λ, Λ∥, and Λ⊥ with different NR volume fractions and shear rates under a stable shear flow is presented in Fig. 4. It is noted that two directional conductive probabilities along the gradient direction and the vorticity direction are averaged as the directional conductive probability perpendicular to the shear direction Λ⊥ because they are very similar. It is interesting to find that Λ first increases and then decreases with increasing , which can be clearly reflected by the change of φc in Fig. 5(a). It is noted that Λ depends on both Λ∥ and Λ⊥. The continuous increase of Λ∥ is generally attributed to the NR orientation along the shear direction. Λ⊥ shows a similar trend with Λ as the increase of even though the difference of Λ⊥ is small for different Kstiffness. To further explore it, first the second-order Legendre polynomials 〈P2〉 is used to denote the NR orientation degree at different shear rates, given by
on the conductive probability of PNCs by fixing the NR Kstiffness equal to 2, where NRs can straighten under the shear field. Change of Λ, Λ∥, and Λ⊥ with different NR volume fractions and shear rates under a stable shear flow is presented in Fig. 4. It is noted that two directional conductive probabilities along the gradient direction and the vorticity direction are averaged as the directional conductive probability perpendicular to the shear direction Λ⊥ because they are very similar. It is interesting to find that Λ first increases and then decreases with increasing , which can be clearly reflected by the change of φc in Fig. 5(a). It is noted that Λ depends on both Λ∥ and Λ⊥. The continuous increase of Λ∥ is generally attributed to the NR orientation along the shear direction. Λ⊥ shows a similar trend with Λ as the increase of even though the difference of Λ⊥ is small for different Kstiffness. To further explore it, first the second-order Legendre polynomials 〈P2〉 is used to denote the NR orientation degree at different shear rates, given by
|
〈P2〉 = (3〈cos2θ2〉 − 1)/2
| (4) |
 where
where  and
and  are the position vector of the first and the last beads of NR in Fig. 5(a). It is interesting to find that
  (which can reflect the effective aspect ratio of NR) first gradually increases and then decreases with . The extremum of φc and
  appears at the same . Last, we characterized the NR dispersion state under the shear field by calculating the inter-nanorod radial distribution function (RDF), which is shown in Fig. S4(a).† The peaks at r = 1σ, 2σ and 3σ gradually increase with , which reflects that more NRs tend to aggregate directly.
 | ||
| Fig. 4 (a) Homogeneous conductive probability Λ, (b) directional conductive probability Λ∥ parallel to the shear direction, and (c) directional conductive probability Λ⊥ perpendicular to the shear direction as a function of the nanorod volume fraction φ for different shear rates . (T* = 1.0, Kstiffness = 2.0). | ||
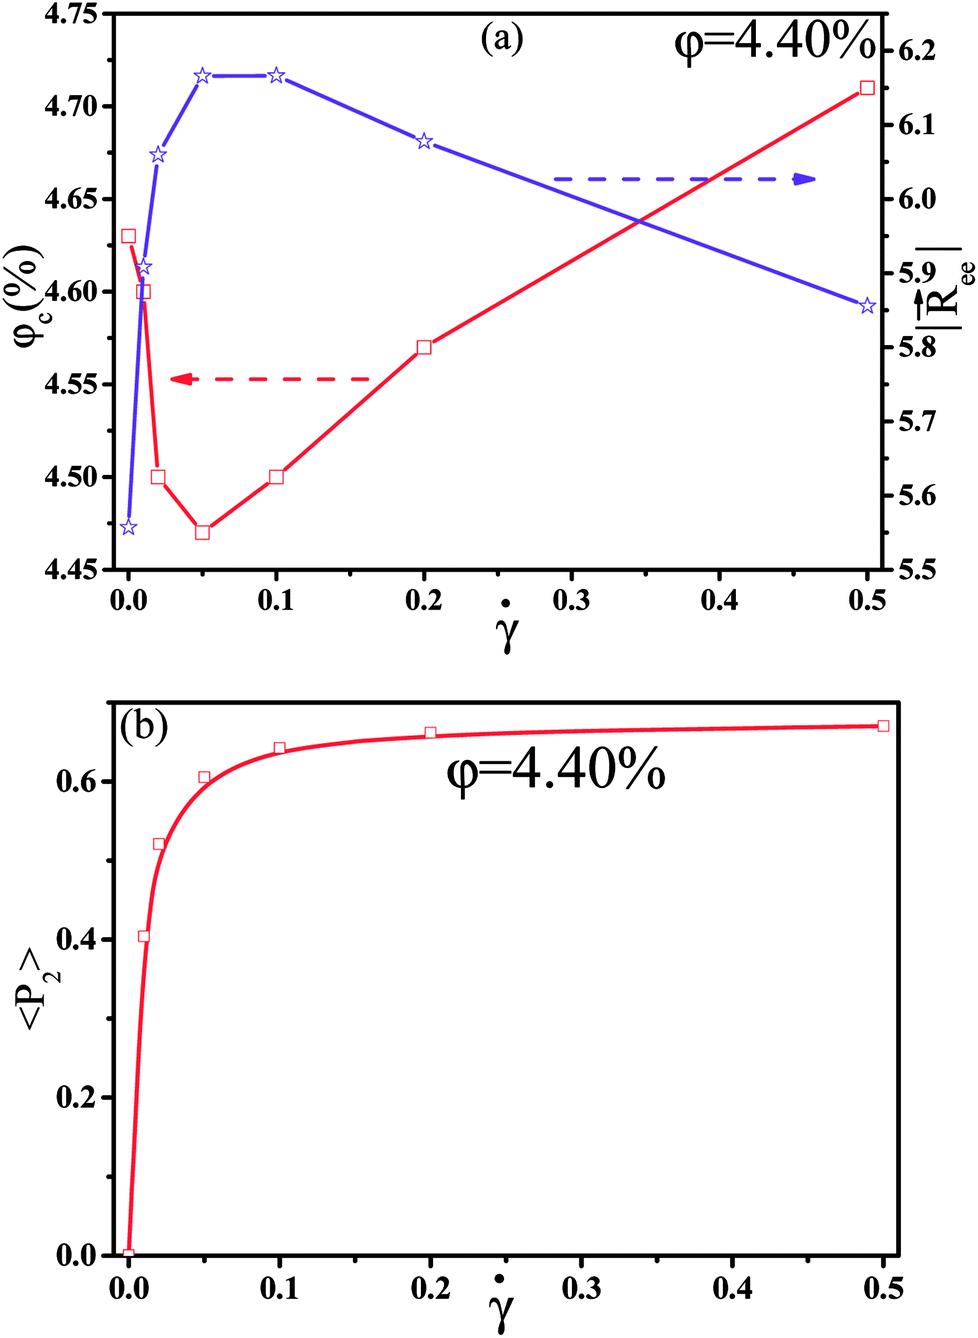 | ||
Fig. 5 (a) The left axis denotes the percolation threshold φc, while the right axis represents the end-to-end distance  of the nanorod with respect to the shear rate . (b) The nanorod orientation 〈P2〉 with respect to the shear rate . (T* = 1.0, φ = 4.40%, Kstiffness = 2). of the nanorod with respect to the shear rate . (b) The nanorod orientation 〈P2〉 with respect to the shear rate . (T* = 1.0, φ = 4.40%, Kstiffness = 2). | ||
According to the results mentioned above, in the quiescent state NRs disperse randomly in the matrix, leading to a uniform conductivity probability along three different directions. Under the shear field, on one hand, NRs begin to orientate along the shear field; on the other hand, more NRs tend to aggregate directly. They are responsible for the increase of Λ∥ with in Fig. 4(b). NRs with low stiffness (Kstiffness = 2) first straighten with ; however, it does not have enough time to further straighten at ≥ 0.1, which leads to the decrease of Ree in Fig. 5(a). As a result, the maximum effective aspect ratio of NRs appears at = 0.05. In general, the NR orientation destroys the inter-nanorod connection perpendicular to the shear direction, which reduces Λ⊥. However, at < 0.1, the increase of Λ⊥ by the improved effective aspect ratio of NRs makes up the decrease of Λ⊥ by the NR orientation, which eventually leads to the weak increase of Λ⊥. At ≥ 0.1, Λ⊥ decreases again because of the reduced effective aspect ratio of NRs in Fig. 5(a). In summary, first Λ strongly depends on Λ⊥, rather than Λ∥. This is because the conductive network parallel to the shear direction is much easier to be formed than that perpendicular to the shear direction. To better understand it, we also calculated the main cluster size Cn to analyze the conductive network in Fig. S4(b).† The results show that Cn first increases and then decreases with , which is consistent with Λ. To observe the NR conductive network, we presented the snapshots of some typical systems (φ = 4.40%) with different in Fig. S5.† It presents that NRs gradually align along the shear direction. Meanwhile, the main cluster is gradually broken down, which is reflected by the decrease in the number of red beads in Fig. S5.† In total, our results show that the original NR conductive network is broken down and a new one is formed. Accompany with it, the effective aspect ratio and the orientation of NRs along the shear direction changes with , which synergistically affects the conductive probability.
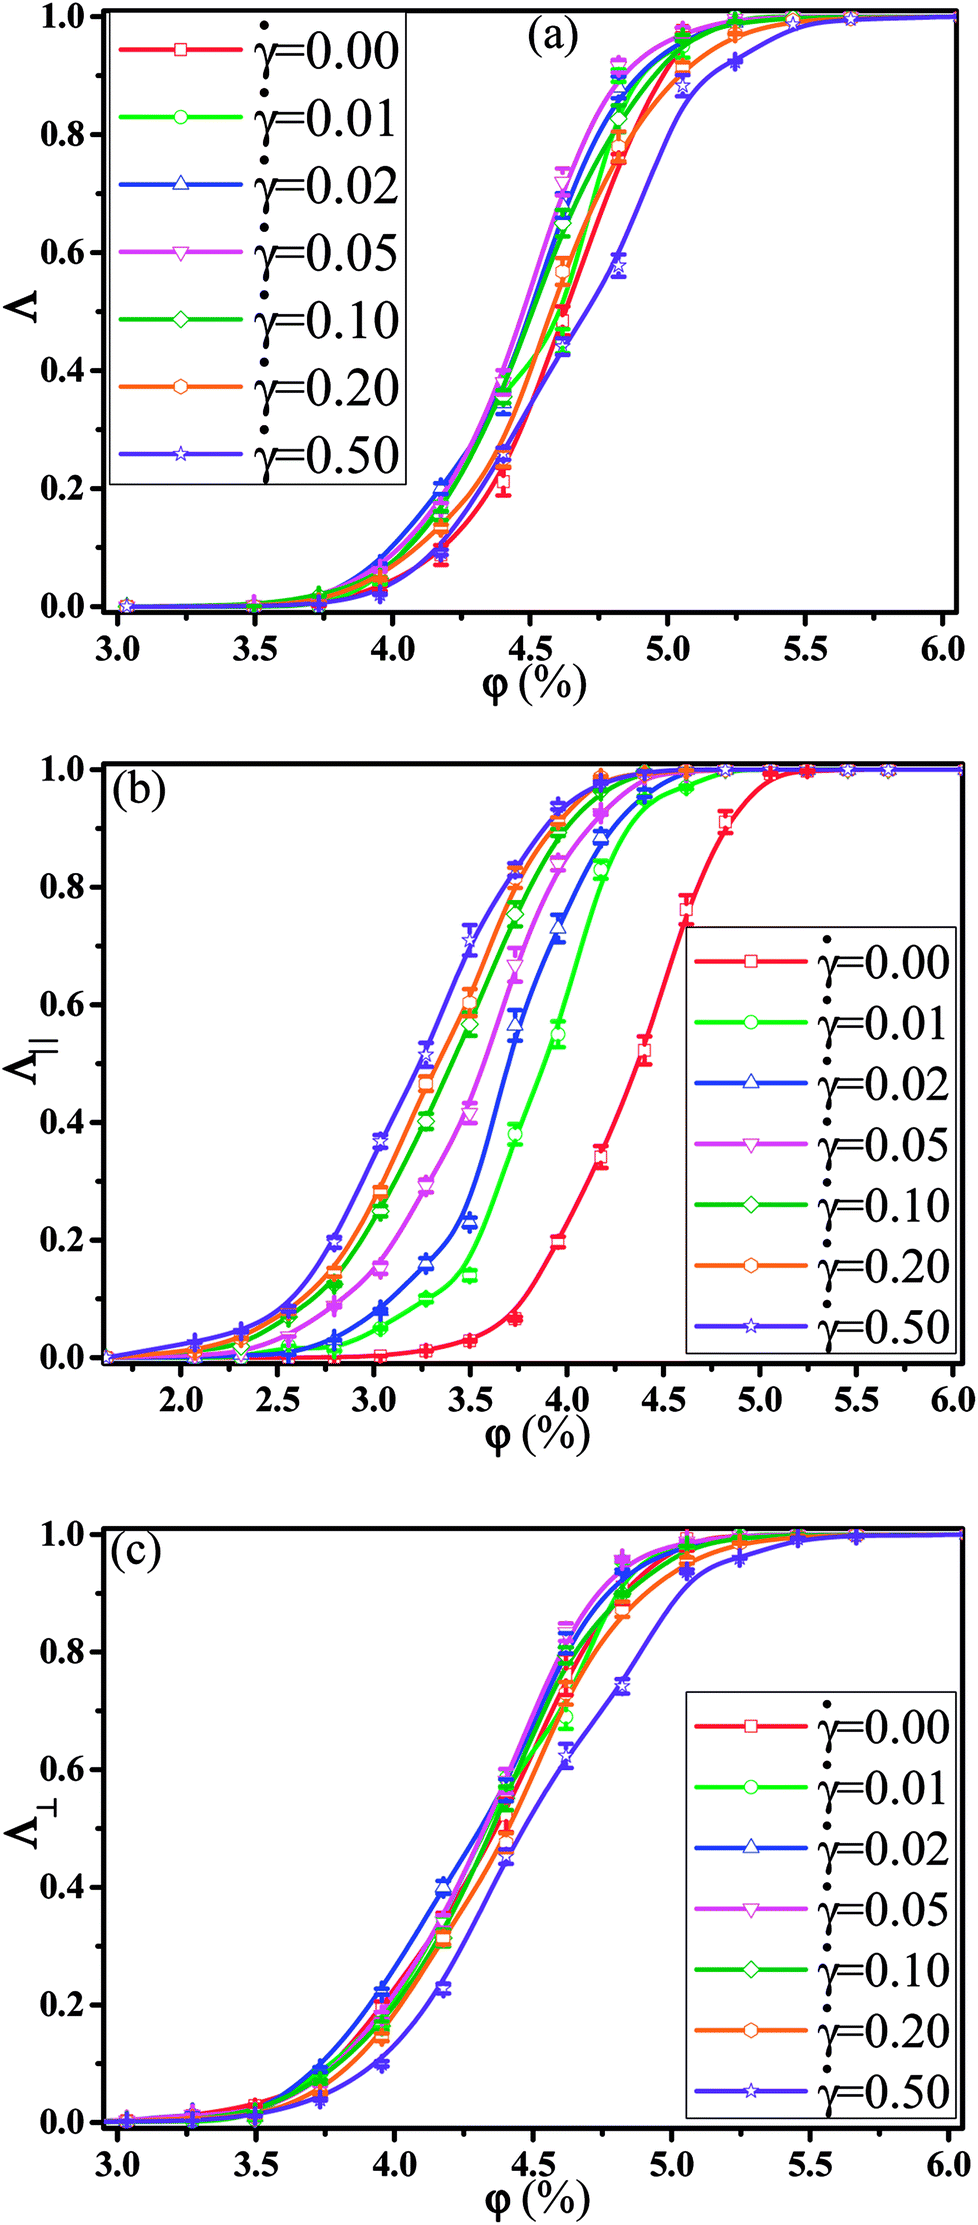
Then, we investigated the effect of the NR stiffness (Kstiffness) on the conductive probability of PNCs by fixing the shear rate = 0.1. Fig. 6 shows variation of Λ, Λ∥, and Λ⊥ for different NR volume fractions and Kstiffness in a steady shear flow. Under the shear field, Λ in Fig. 6(a) first increases and then decreases with the increase of Kstiffness at = 0.1, which is different with that at = 0.0 in Fig. 1. To clearly present it, the percolation threshold φc is shown in Fig. 7(a) for different Kstiffness at = 0.0 and 0.1. Similarly, the increase of Λ∥ in Fig. 6(b) is attributed to the gradual NR orientation with Kstiffness in Fig. S6.† Meanwhile, Λ and Λ⊥ have the same trend with Kstiffness. Under the shear field, on one hand the breakage of conductive network reduces Λ. On the other hand, the increase of the effective aspect ratio of NR enhances Λ. As shown in Fig. 7(b), at low Kstiffness < 5, Ree of NR at = 0.1 increases by more than 7% compared with that at = 0.0. The increase of Λ by the improved effective aspect ratio of NR can make up the decrease of Λ induced by the breakage of conductive network, which enhances Λ. However, at high Kstiffness > 5, both the breakage of the conductive network and the NR stiffness determines the variation in Λ because of the limited increase of Ree (∼1.5% for Kstiffness = 100). Thus, the Kstiffness of NR determines the increase or the decrease of the conductive probability under the shear field compared with that the quiescent state. Similarly, the main cluster size Cn is calculated to analyze the conductive network in Fig. S7.† The results show that Cn first increases and then decreases with Kstiffness, which is consistent with Λ. To observe the conductive network, the snapshots of some typical systems (φ = 4.40%) are presented with different Kstiffness at = 0.0 and 0.1 in Fig. S8(a).† It clearly presents that NRs gradually align along the shear direction from = 0.0 to 0.1. Meanwhile, at = 0.1, Cn increases for Kstiffness = 0.0, while it decreases for Kstiffness = 100 compared with those at = 0.0. This can be reflected by the decrease in the number in red beads. In total, compared with in the quiescent state, the decrease or the increase of the conductive probability strongly depends on the NR stiffness under the shear field.
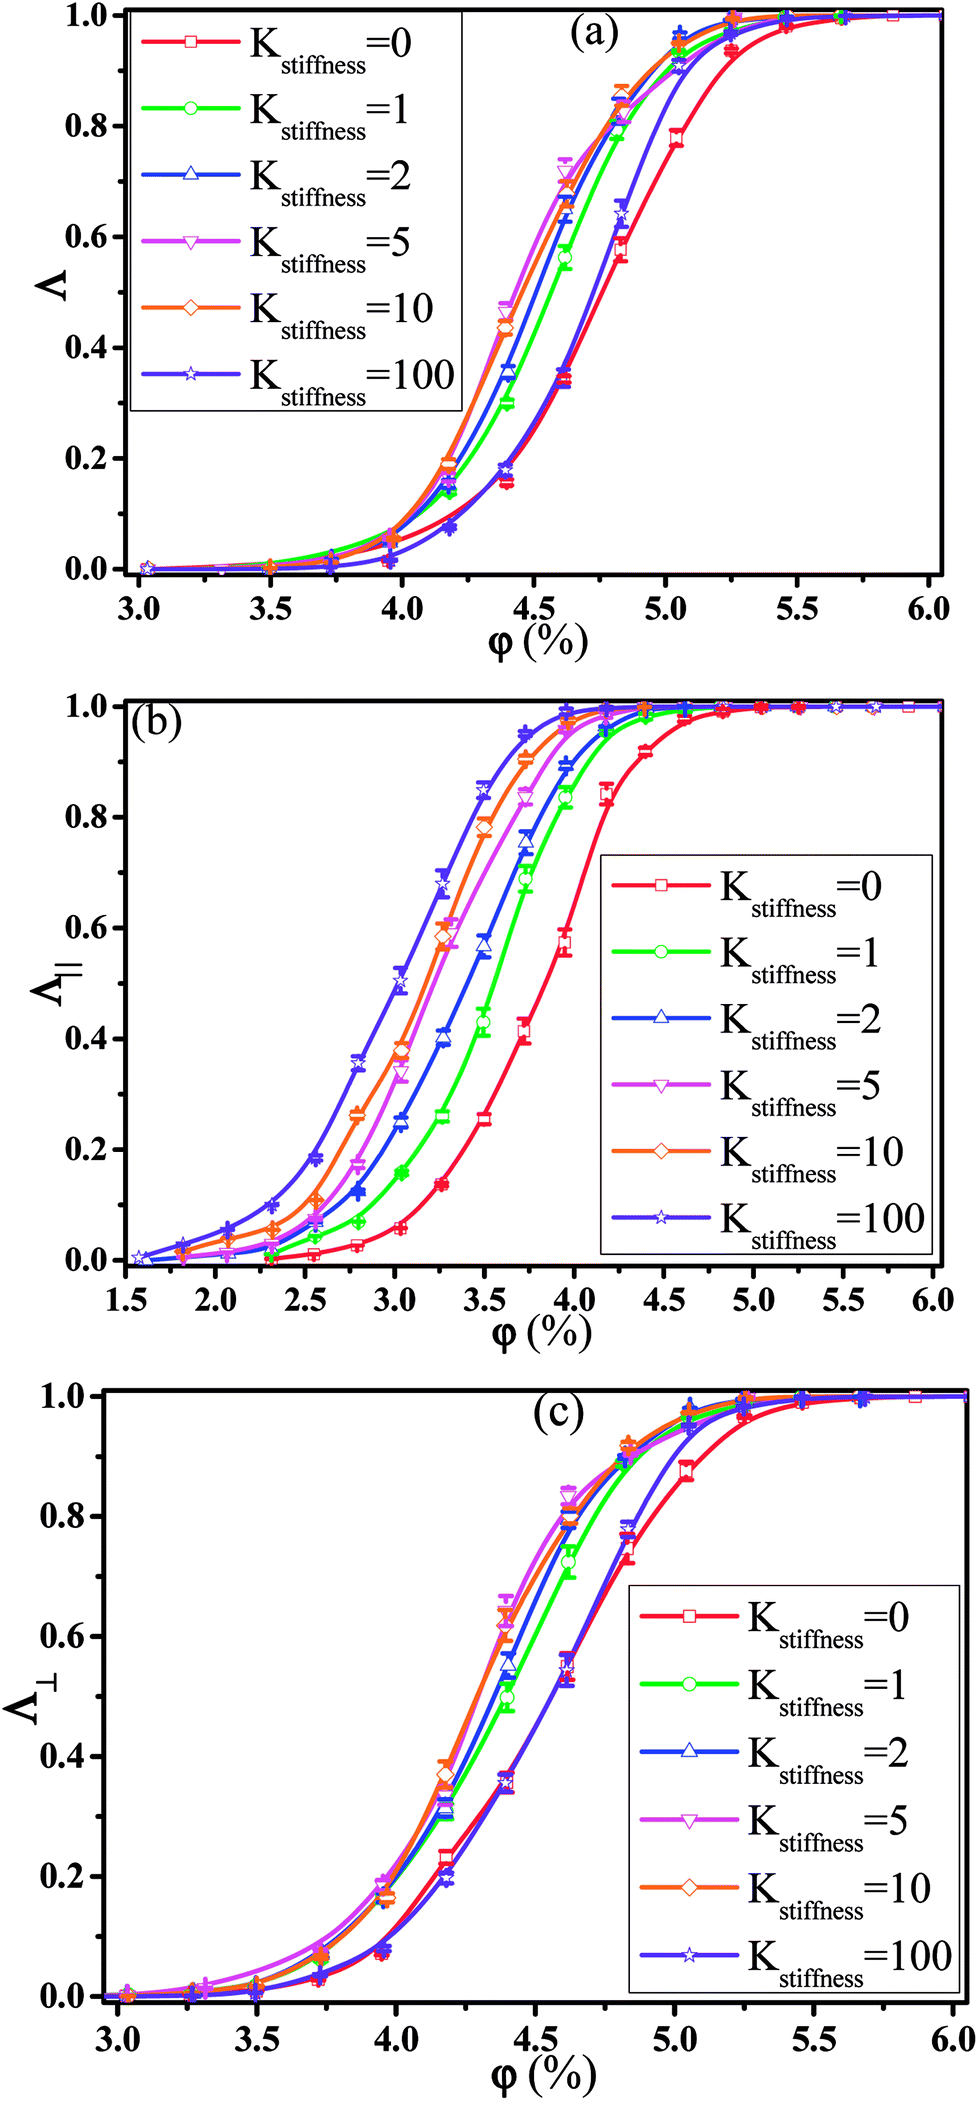 | ||
| Fig. 6 (a) Homogeneous conductive probability Λ, (b) directional conductive probability Λ∥ parallel to the shear direction, and (c) directional conductive probability Λ⊥ perpendicular to the shear direction as a function of the nanorod volume fraction φ for different nanorod stiffness (Kstiffness). (T* = 1.0, = 0.1). | ||
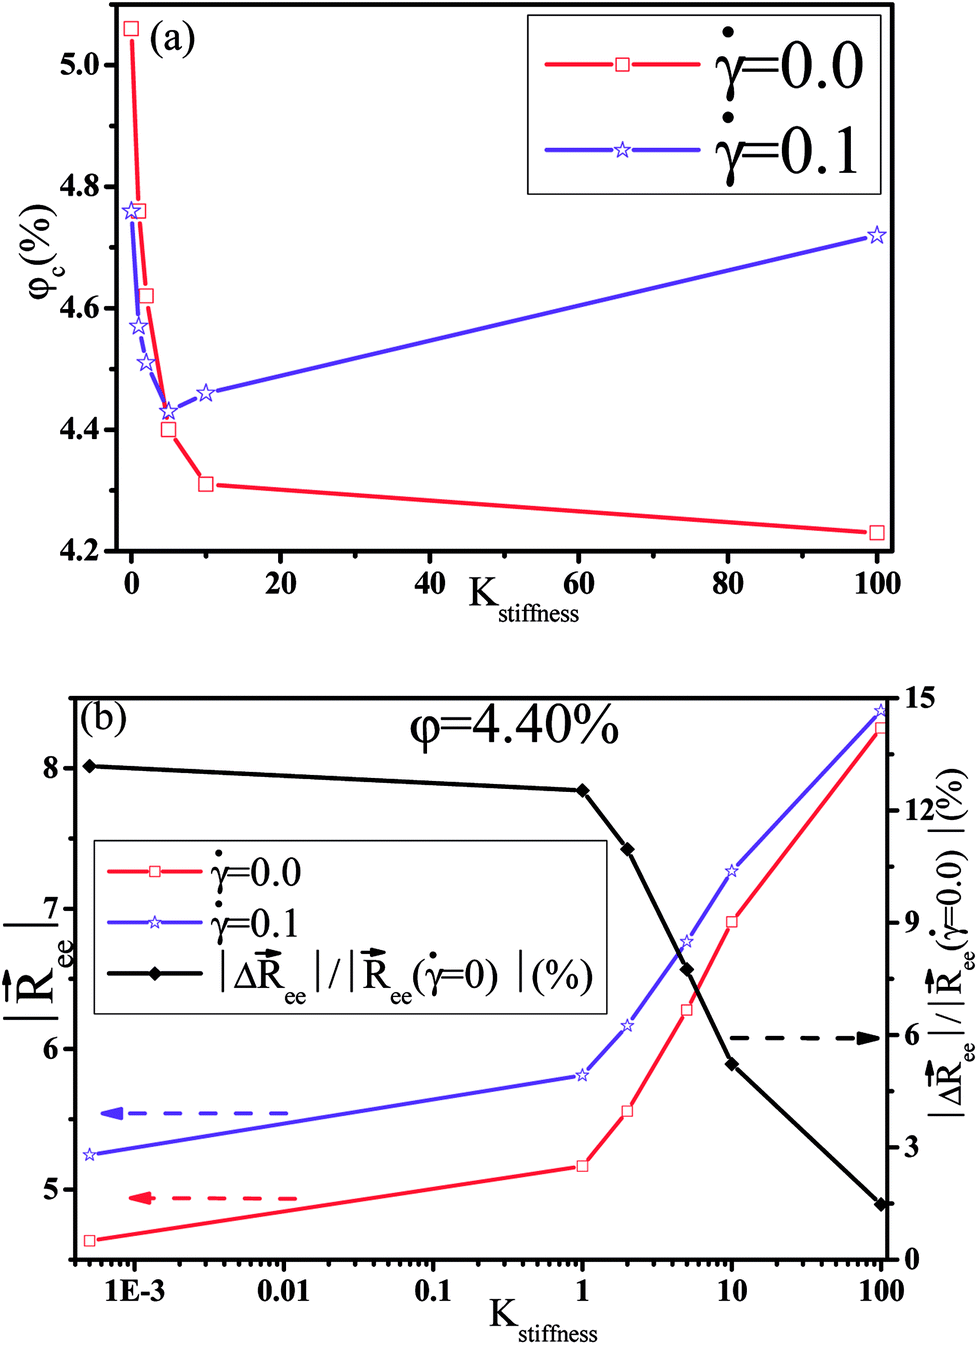 | ||
Fig. 7 (a) The percolation threshold φc for different nanorod stiffness (Kstiffness) at shear rates = 0.0 and 0.1. (b) The left axis denotes the end-to-end distance  of the nanorod at shear rates = 0.0 and 0.1, while the right axis represents the change of of the nanorod at shear rates = 0.0 and 0.1, while the right axis represents the change of  with different stiffness (Kstiffness) (φ = 4.40%). (T* = 1.0, = 0.1). with different stiffness (Kstiffness) (φ = 4.40%). (T* = 1.0, = 0.1). | ||
Under the shear field, the conductive anisotropy Λ∥/Λ⊥ is induced by the NR orientation, defined in eqn (4). Here, we chose systems which contain 4000 NRs (φ = 3.95%), which is near to the percolation threshold. Otherwise, Λ∥ or Λ⊥ approaches 0 or 1 which induces large error. The result in Fig. S8(b)† indicates that the dependence of Λ∥/Λ⊥ on the NR orientation 〈P2〉 can be described by a simple empirical formula for different Kstiffness, given by:
| ln(Λ∥/Λ⊥) = A × 〈P2〉 | (5) |
3.2 Discussion
When mapping the coarse-grained model to real polymers,41 the interaction parameter ε is about 2.5–3.4 kJ mol−1 for the common polymers. In addition, for this coarse-grained model of polymer chains, the persistence length is about 0.676σ. For real polymers, the range of the persistence length is between 0.35 nm and 0.76 nm.56 Thus, σ can be roughly about 1 nm. Here, polyethylene is used as an example. Each bead with its diameter σ equal to 1 nm roughly corresponds to 5 repeating units which leads to the mass of each bead equal to 140g mol−1. The time scale is calculated, which is within the range of about 10 ps. In the ESI,† the rotational diffusion coefficient (Drot) gradually decreases from 15.5 × 10⁻⁴τ−1, 12.2 × 10⁻⁴τ−1, 9.7 × 10⁻⁴τ−1, 7.35 × 10⁻⁴τ−1, 5.35 × 10⁻⁴τ−1 to 2.43 × 10⁻⁴τ−1 with the increase of Kstiffness from 0, 1, 2, 5, 10 to 100, respectively. The shear rate varies from 0.1τ−1 to 0.5τ−1 in our simulation. Thus, the Peclet number
  varies from 64 to 2058, which is comparable with the experimental Peclet numbers.57 Thus, our simulation is roughly reasonable. In addition, in experiments because of the attractive interaction between fillers, the fillers always aggregate directly and the conductive network can not be formed. To improve the dispersion state of fillers, an effective strategy is to functionalize the filler surface by grafted polymer chains.58–61 As a results, the filler surface is covered with a layer of polymer, which leads to the similar interactions for εpp, εnp and εnn. Thus, in this work, εpp, εnp, and εnn are set to be 1.0, which roughly can stand for the system with a good dispersion state of grafted fillers in the matrix.
The electrical conductivity is closely dependent on the conductive network, which is mainly affected by several factors, such as filler dispersion,23,35 filler shape,28,35 filler aspect ratio,11,62 filler–filler and polymer–filler interactions,10,30 filler alignment,29,32 etc. Due to their very large aspect ratio, carbon nanotubes are not completely stiff.36,37 The effective aspect ratio of filler gradually increases with its stiffness, which reduces the percolation threshold of PNCs.13,27,38–40,44 Under the shear field, it induces the destruction and build-up of the conductive network. CNTs in a shear gradient can pick up other CNTs and stick to each other, which is called the ‘picking-up’ mechanism.14 Meanwhile, the decrease or the increase of the electrical conductivity depends on the initial dispersion state of filler. For the well dispersed CNTs in PC matrix, the interconnected conductive network changes the materials from insulator to the conductor, which is attributed to the agglomeration of CNTs under steady shear field.14 However, for the initially partially aggregated filler, the breakage of the conductive network significantly reduces the electrical conductivity.53,63 In total, the shear-induced change of CNT structure (such as CNT alignment29,64 and the CNT entanglement65) is responsible for the electrical conductivity. In this simulation, we mainly investigated the effect of the NR stiffness on the conductive behavior of PNCs under the shear field. Currently, only some models26,28,38–40 reported the effect of NR stiffness on the percolation threshold of PNCs where the NRs changes from very flexibility to rigidity, which is consistent with ours. For the NR in our simulation, the percolation threshold of PNCs varies from 5.06% to 4.23% with the increase of Kstiffness from 0 to 100 where the effective aspect ratio of NR increases from 5.6 to 9.3. The difference of the percolation threshold for different flexible NRs is 0.83%. In experiments,66 the percolation threshold decreases from 8.3% to 5.9% when the aspect ratio of silver nanowire increases from 9 to 16 in silver nanowire-polystyrene nanocomposites. This difference of the percolation threshold is larger than ours. On the one hand, the NR in the simulation is short.8,67 The change of the effective aspect ratio of the short NR is limited with different stiffness and different shear rates. On the other hand, in the simulation, we adopted the conductive probability to qualitatively reflect the electrical conductivity in experiments, not quantitatively. Meanwhile, it just changes from 0.0 to 1.0 (one order of magnitude). However, in experiments,2 the electronic conductivity is used, which can change over more than 10 orders of magnitude near the percolation threshold. Under the shear field, for the rigid NR with Kstiffness = 100, the percolation threshold increases from 4.23% at = 0.0 to 4.72% at = 0.1. However, similarly the difference is also small compared with that in experiment.13 Besides the above two possibilities, the NR dispersion is relatively uniform in the simulation, which forms a loose conductive network. In experiments,13 the closely connected conductive network is formed. Under the shear field, accompanied by the destruction of the closely connected conductive network, the significant decrease of the electronic conductivity leads to the large increase of the percolation threshold. However, these are three possible reasons for small difference of the percolation threshold in our systems, which are expected to be proved by using long NRs in the future. In total, compared with the previous work, the main new phenomenons revealed here are summarized below: (1) in the quiescent state, the conductive probability of PNCs gradually increases with the increase of the NR stiffness; however, under the shear field, it first increases and then decreases. (2) Compared with in the quiescent state, the decrease or the increase of the conductive probability under the shear field depends on the NR stiffness. (3) For flexible NRs, the conductive probability first increases and then decreases with the increase of the shear rate. As a result, the conductive probability reaches maximum at the mediate shear rate, which is consistent with the maximum effective aspect ratio of NRs. These results can help to further understand the effect of NR stiffness on the conductive property of PNCs under the shear field.
4. Conclusions
In this work, the effect of nanorod (NR) stiffness on the conductive probability of NR filled polymer nanocomposites (PNCs) has been investigated under the quiescent state and the shear field. In the quiescent state, the conductive probability of PNCs gradually increases with increasing the NR stiffness, which is reflected by the low percolation threshold; however, under the shear field, it first increases and then decreases. The largest conductive probability appears at the moderate NR stiffness, which result from the competition between the improved effective aspect ratio of NR and the breakage of conductive network induced by the shear field. In addition, compared with in the quiescent state, the NR stiffness determines the decrease or the increase of the conductive probability under the shear field. At low NR stiffness, the improved effective aspect ratio of NR enhances the conductive probability. While at high NR stiffness, the conductive network is significantly broken down, which reduces the conductive probability. At low shear rate, NRs with low stiffness first straighten, which increases the effective aspect ratio; however, at high shear rate, the increase of effective aspect ratio is limited. As a result, the maximum effective aspect ratio of NRs appears at the moderate shear rate, leading to the maximum conductive probability at the mediate shear rate. In summary, this work can further help to understand the effect of NR stiffness on the conductive property of PNCs under the shear field.Conflicts of interest
There are no conflicts to declare.Acknowledgements
The authors acknowledge financial supports from the National Natural Science Foundation of China (21704003), National 973 Basic Research Program of China 2015CB654700 (2015CB654704), the financial support from the National Natural Science Foundation of China (Grant No. 51521062), the start-up funding of Beijing University of Chemical Technology for excellent introduced talents (buctrc201710), and the Fundamental Research Funds for the Central Universities (JD1811), and supported by CHEMCLOUDCOMPUTING of Beijing University of Chemical Technology are both greatly appreciated.References
- B. Guo, Z. Tang and L. Zhang, Prog. Polym. Sci., 2016, 61, 29–66 CrossRef
.
- R. M. Mutiso and K. I. Winey, Prog. Polym. Sci., 2015, 40, 63–84 CrossRef
- R. Haggenmueller, C. Guthy, J. R. Lukes, J. E. Fischer and K. I. Winey, Macromolecules, 2007, 40, 2417–2421 CrossRef
- M. Foygel, R. D. Morris, D. Anez, S. French and V. L. Sobolev, Phys. Rev. B: Condens. Matter Mater. Phys., 2005, 71, 104201 CrossRef
- Y. Shudo, A. Izumi, K. Hagita, T. Nakao and M. Shibayama, Polymer, 2017, 116, 506–514 CrossRef
- I. Balberg, Philos. Mag. B, 1987, 56, 991–1003 Search PubMed
- I. Alig, P. Pötschke, D. Lellinger, T. Skipa, S. Pegel, G. R. Kasaliwal and T. Villmow, Polymer, 2012, 53, 4–28 CrossRef
- W. Bauhofer and J. Z. Kovacs, Compos. Sci. Technol., 2009, 69, 1486–1498 CrossRef
- Y. Zeng, P. Liu, J. Du, L. Zhao, P. M. Ajayan and H.-M. Cheng, Carbon, 2010, 48, 3551–3558 CrossRef
- Y. Bréchet, J. Y. Cavaillé, E. Chabert, L. Chazeau, R. Dendievel, L. Flandin and C. Gauthier, Adv. Eng. Mater., 2001, 3, 571–577 CrossRef
- J. Li, P. C. Ma, W. S. Chow, C. K. To, B. Z. Tang and J. K. Kim, Adv. Funct. Mater., 2007, 17, 3207–3215 CrossRef
- S. B. Kharchenko, J. F. Douglas, J. Obrzut, E. A. Grulke and K. B. Migler, Nat. Mater., 2004, 3, 564–568 CrossRef PubMed
- J. Obrzut, J. F. Douglas, S. B. Kharchenko and K. B. Migler, Phys. Rev. B: Condens. Matter Mater. Phys., 2007, 76, 195420 CrossRef
- T. Skipa, D. Lellinger, W. Böhm, M. Saphiannikova and I. Alig, Polymer, 2010, 51, 201–210 CrossRef
- S. Kale, F. A. Sabet, I. Jasiuk and M. Ostoja-Starzewski, J. Appl. Phys., 2016, 120, 045105 CrossRef
- S. Kale, F. A. Sabet, I. Jasiuk and M. Ostoja-Starzewski, J. Appl. Phys., 2015, 118, 154306 CrossRef
- G. Ambrosetti, C. Grimaldi, I. Balberg, T. Maeder, A. Danani and P. Ryser, Phys. Rev. B: Condens. Matter Mater. Phys., 2010, 81, 155434 CrossRef
- G. Ambrosetti, N. Johner, C. Grimaldi, T. Maeder, P. Ryser and A. Danani, J. Appl. Phys., 2009, 106, 016103 CrossRef
- C. Li and T. W. Chou, Appl. Phys. Lett., 2007, 90, 491 Search PubMed
- R. H. Otten and d. S. P. Van, Phys. Rev. Lett., 2009, 103, 225704 CrossRef PubMed
- A. V. Kyrylyuk and P. V. D. Schoot, Proc. Natl. Acad. Sci. U. S. A., 2008, 105, 8221–8226 CrossRef PubMed
- B. Nigro, C. Grimaldi, M. A. Miller, P. Ryser and T. Schilling, Phys. Rev. E: Stat., Nonlinear, Soft Matter Phys., 2013, 88, 042140 CrossRef PubMed
- H. Woo Cho, S. Nam, S. Lim, D. Kim, H. Kim and B. June Sung, J. Appl. Phys., 2014, 115, 154307 CrossRef
- H. M. Ma and X. L. Gao, Polymer, 2008, 49, 4230–4238 CrossRef
- R. M. Mutiso, M. C. Sherrott, J. Li and K. I. Winey, Phys. Rev. B: Condens. Matter Mater. Phys., 2013, 86, 278–281 Search PubMed
- W. S. Bao, S. A. Meguid, Z. H. Zhu, Y. Pan and G. J. Weng, J. Appl. Phys., 2013, 113, 234313 CrossRef
- H. M. Ma, X.-L. Gao and T. B. Tolle, Appl. Phys. Lett., 2010, 96, 061910 CrossRef
- S. Kwon, H. W. Cho, G. Gwon, H. Kim and B. J. Sung, Phys. Rev. E, 2016, 93, 032501 CrossRef PubMed
- S. Gong, Z. H. Zhu and S. A. Meguid, Polymer, 2015, 56, 498–506 CrossRef
- A. E. Eken, E. J. Tozzi, D. J. Klingenberg and W. Bauhofer, J. Appl. Phys., 2011, 109, 084342 CrossRef
- C. Jizhe and N. Mohammad, Modell. Simul. Mater. Sci. Eng., 2016, 24, 065004 CrossRef
- F. Du, J. E. Fischer and K. I. Winey, Phys. Rev. B: Condens. Matter Mater. Phys., 2005, 72, 121404 CrossRef
- G. Kwon, Y. Heo, K. Shin and B. J. Sung, Phys. Rev. E: Stat., Nonlinear, Soft Matter Phys., 2012, 85, 011143 CrossRef PubMed
- A. E. Eken, E. J. Tozzi, D. J. Klingenberg and W. Bauhofer, Polymer, 2012, 53, 4493–4500 CrossRef
- A. E. Eken, E. J. Tozzi, D. J. Klingenberg and W. Bauhofer, Polymer, 2011, 52, 5178–5185 CrossRef
- F. Dalmas, R. Dendievel, L. Chazeau, J.-Y. Cavaillé and C. Gauthier, Acta Mater., 2006, 54, 2923–2931 CrossRef
- Y. B. Yi, L. Berhan and A. M. Sastry, J. Appl. Phys., 2004, 96, 1318–1327 CrossRef
- W. Lu, T.-W. Chou and E. T. Thostenson, Appl. Phys. Lett., 2010, 96, 223106 CrossRef
- C. Li, E. T. Thostenson and T.-W. Chou, Compos. Sci. Technol., 2008, 68, 1445–1452 CrossRef
- L. Berhan and A. M. Sastry, Phys. Rev. E: Stat., Nonlinear, Soft Matter Phys., 2007, 75, 041121 CrossRef PubMed
- K. Kremer and G. S. Grest, J. Chem. Phys., 1990, 92, 5057–5086 CrossRef
- G. N. Toepperwein, N. C. Karayiannis, R. A. Riggleman, M. Kröger and J. J. D. Pablo, Macromolecules, 2011, 44, 1034–1045 CrossRef
- G. N. Toepperwein, R. A. Riggleman and J. J. D. Pablo, Macromolecules, 2012, 45, 543–554 CrossRef
- Y. Gao, D. Cao, Y. Wu, J. Liu and L. Zhang, Polymer, 2016, 101, 395–405 CrossRef
- Y. Gao, D. Cao, J. Liu, J. Shen, Y. Wu and L. Zhang, Phys. Chem. Chem. Phys., 2015, 17, 22959–22968 RSC
- Y. Gao, J. Liu, J. Shen, L. Zhang, Z. Guo and D. Cao, Phys. Chem. Chem. Phys., 2014, 16, 16039–16048 RSC
- S. Plimpton, J. Comput. Phys., 1995, 117, 1–19 CrossRef
- Y. Wang, G. J. Weng, S. A. Meguid and A. M. Hamouda, J. Appl. Phys., 2014, 115, 193706 CrossRef
- C. Li, E. T. Thostenson and T.-W. Chou, Appl. Phys. Lett., 2007, 91, 223114 CrossRef
- Y. Feng, N. Ning, Q. Zhao, J. Liu, L. Zhang, M. Tian and J. Mi, Soft Matter, 2014, 10, 8236 RSC
- S. Nam, H. W. Cho, S. Lim, D. Kim, H. Kim and B. J. Sung, ACS Nano, 2013, 7, 851–856 CrossRef PubMed
- I. Balberg, C. H. Anderson, S. Alexander and N. Wagner, Phys. Rev. B: Condens. Matter Mater. Phys., 1984, 30, 3933–3943 CrossRef
- I. Alig, D. Lellinger, M. Engel, T. Skipa and P. Pötschke, Polymer, 2008, 49, 1902–1909 CrossRef
- M. E. Tuckerman, C. J. Mundy, S. Balasubramanian and M. L. Klein, J. Chem. Phys., 1997, 106, 5615–5621 CrossRef
- A. W. Lees and S. F. Edwards, J. Phys. C: Solid State Phys., 1972, 5, 1921 CrossRef
- P. C. Hiemenz and T. P. Lodge, in Polymer chemistry, CRC Press, London, New York, 2007, p. 587 Search PubMed
- R. G. Larson, The Structure and Rheology of Complex Fluids, Oxford University Press, New York, 1999, p. 663 Search PubMed
- A. L. Frischknecht, M. J. A. Hore, J. Ford and R. J. Composto, Macromolecules, 2013, 46, 2856–2869 CrossRef
- A. Rungta, B. Natarajan, T. Neely, D. Dukes, L. S. Schadler and B. C. Benicewicz, Macromolecules, 2012, 45, 9303–9311 CrossRef
- S. K. Kumar, N. Jouault, B. Benicewicz and T. Neely, Macromolecules, 2013, 46, 3199–3214 CrossRef
- J. F. Moll, P. Akcora, A. Rungta, S. Gong, R. H. Colby, B. C. Benicewicz and S. K. Kumar, Macromolecules, 2011, 44, 7473–7477 CrossRef
- V. Kumar and A. Rawal, Polymer, 2016, 97, 295–299 CrossRef
- I. Alig, T. Skipa, M. Engel, D. Lellinger, S. Pegel and P. Pötschke, Phys. Status Solidi B, 2007, 244, 4223–4226 CrossRef
- J. Xu, W. Florkowski, R. Gerhardt, K.-s. Moon and C.-P. Wong, J. Phys. Chem. B, 2006, 110, 12289–12292 CrossRef PubMed
- R. H. Schmidt, I. A. Kinloch, A. N. Burgess and A. H. Windle, Langmuir, 2007, 23, 5707–5712 CrossRef PubMed
- S. I. White, R. M. Mutiso, P. M. Vora, D. Jahnke, S. Hsu, J. M. Kikkawa, J. Li, J. E. Fischer and K. I. Winey, Adv. Funct. Mater., 2010, 20, 2709–2716 CrossRef
- D. A. T. Nikta Fakhri, L. Cognet, R. Bruce Weisman and M. Pasquali, Proc. Natl. Acad. Sci. U. S. A., 2009, 106, 14219–14223 CrossRef PubMed
Footnote |
| † Electronic supplementary information (ESI) available. See DOI: 10.1039/c8ra06264a |
| This journal is © The Royal Society of Chemistry 2018 |