 Open Access Article
Ag modified bismuth ferrite nanospheres as a chlorine gas sensor
Qiang Li*ab,
Weiming Zhang a,
Chao Wanga,
Jiangwei Maa,
Li Ninga and
Huiqing Fanab
aSchool of Materials Science and Engineering, Northwestern Polytechnical University, Xi'an 710072, China. E-mail: jerrylee57318@hotmail.com; Fax: +86-29-88492642; Tel: +86-29-88494463
bState Key Laboratory of Solidification Processing, Xi'an 710072, China
First published on 26th September 2018
Abstract
Pure phase bismuth ferrite (BiFeO3, BFO) nanospheres were synthesized via a sol–gel method, and Ag was loaded on the surface of BFO by photodeposition. The effects of the Ag-modification on the morphologies and microstructural characteristics were investigated using transmission electron microscopy (TEM) and X-ray powder diffraction (XRD) analyses. Only BFO peaks but no Ag peaks were observed for all samples in the XRD patterns, which is related to the small size and low loading of Ag. The gas-sensing tests show that the response of 4 mg AgNO3 modified BiFeO3 (ABFO4) was 72.62 to 10 ppm Cl2 at 240 °C, which was 2.5 times higher than that of the pristine BFO. Such outstanding gas sensing performances are attributed to the fact that the presence of Ag not only increases the density of holes and the amount of gas adsorption sites but also has a catalytic effect.
1. Introduction
Chlorine (Cl2) as one of the toxic gases has been a great concern in the past few decades because it is extremely harmful to human respiratory mucosa when it is exposed to Cl2 gas at a concentration between 0.2 ppm and 3.5 ppm.1,2 Meanwhile, it causes skin infections, psychological disorders, and even liver damage when combined with waste.3 Thus, it is essential to develop low cost, timely and accurate gas sensors for the detection of Cl2.Various researchers have reported sensors using metal oxides for detection of Cl2. Guo et al. reported a one-pot solvothermal method to prepare fluorescent carbon nitride nanoparticles for detection of free chlorine.4 Miyata et al. revealed Cu-phthalocyanine thin films exhibit high sensitivity for Cl2.5 Rao et al. reported palladium doped nickel ferrite thin films for sensing of Cl2 gas with long-term stability in spite of low sensitivity.6 As is known to all, p-type gas sensor due to its unique conduction characteristics and gas sensing mechanism, exhibits various advantages, such as low optimum operating temperature, long-term stability and low relative humidity.
It was reported that BFO exhibited excellent gas-sensing properties.7–9 Perovskite BFO, as p-type oxide semiconductors, displays more stable and reliable gas-sensing properties than binary metal oxides, such as ZnO, CuO and SnO2, resulting from the fact that the ternary oxides consists of two differently sized cations.10,11 At the same time, BFO possesses distinctive surface reactivity, oxygen adsorption and relatively narrow band gap (2.19 eV) which are advantageous for enhancing gas selectivity, decreasing the humidity dependence of sensor signals to negligible levels, being conducive to transportation of valence electrons and improving recovery speed.12,13 They are especially meaningful for detection of Cl2, but the researches about BFO in the field of gas-sensing area are still limited due to its low sensitivity. The gas response of p-type oxide semiconductors could be improved remarkably by loading noble metals.14–16 Inspired by previous reports, we loaded Ag on the surface of BFO by photodeposition. Ag, as a noble metal, is well known for the catalyzing the redox reactions on the semiconductor surfaces.17 The catalytic nature of the Ag particles facilitate faster adsorption and desorption of the oxygen molecules (O2) over the sensor surface and the capture electrons from substrate to reduce O2 into oxygen ions (O−).18 Therefore, Ag deposited BFO, with high selectivity, sensitivity and stability is designed for the monitor of Cl2 in the present work.
Herein, we studied the sensing properties of BFO materials with different Ag loadings. The influences of different amounts of Ag particles modification and the gas sensing mechanism were also explored in detail.
2. Experimental
2.1 Preparation and characterizations of BFO nanospheres
Reagent grade bismuth nitrate pentahydrate (Bi(NO3)3·5H2O), acetic acid (CH3COOH), iron nitrate nonahydrate (Fe(NO3)3·9H2O), ethylene glycol ((CH2OH)2) and citric acid (C6H8O7) were used as starting materials. Perovskite-type BFO nanospheres were synthesized by a sol–gel method as previously reported.10,19,20 Briefly, stoichiometric Bi(NO3)3·5H2O and Fe(NO3)3·9H2O were dissolved in CH3COOH and (CH2OH)2, respectively. The obtained solutions were mixed after stirring for 30 minutes. C6H8O7 was added to above mixed solution after stirring at 80 °C. Then the yellow-brown sol was obtained by volatilization of the excess solvent. In order to remove the residual oxynitrides and hydrocarbon impurities, the obtained sol–gel was dried at 100 °C and preheated to 400 °C.21 Finally, the BFO nanospheres were obtained after being calcined at 600 °C for 2 h. 240 mg BFO nanospheres were divided equally into two parts and placed in two 250 mL beakers, respectively. Then 80 mL deionized water was added into the two beakers with ultrasound for 30 min, following by adding 0.4 mL (CH2OH)2 solution (5 wt%) and stirring for 10 min, respectively. After that, the two beakers were added with 4 mL and 8 mL AgNO3 solution (1 mg mL−1) and stirred for 1.5 h. Furthermore, two solutions obtained were irradiated under a high-pressure mercury lamp (8 W) for 3 h, respectively. After being washed with deionized water and absolute ethanol for several times and dried at 60 °C for 12 h, the BFO nanospheres with different concentration of Ag were prepared (ABFO4 and ABFO8, respectively).The crystal structure of the as-prepared samples was analyzed via powder X-ray diffraction (XRD; D8 Advance, Bruker, Germany) at 20–70° using Cu-Kα radiation (= 1.5406 Å). The surface morphologies of obtained products were examined using field scanned electronic microscopy (FE-SEM; JSM-6710F, JEOL, Tokyo, Japan). The chemical state was examined by high-resolution X-ray photoelectron spectroscopy (XPS; VG ESCALA-B220i-XL, Thermo-Scientific, Surrey, UK) with a focused monochromatized Al Kα radiation (E = 1486.6 eV).
2.2 Fabrication of gas sensors
The process for fabrication of gas sensors was mainly as follows: a certain amount of the as-prepared samples and terpineol were mixed and ground for 1 or 2 min until a slightly sticky paste was obtained. Then the alumina ceramic tubes were coated evenly with the paste and sintered at 350 °C for 2.5 h. After pressurizing aging, the sensitivity of the samples could be investigated.3. Results and discussion
3.1 Crystalline structure and morphology
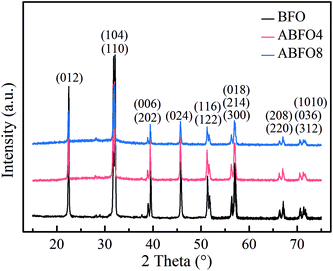
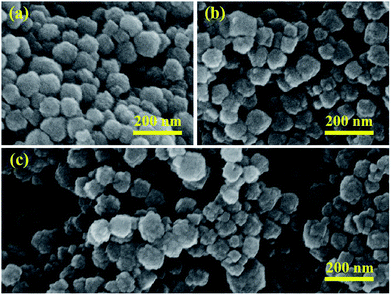
Fig. 1 shows the XRD patterns for pure BFO, ABFO4 and ABFO8 samples. It indicates that the BFO nanospheres exhibit pure tripartite perovskite structure with space group R3c. No secondary impurity phases are detected. The high diffraction peaks reveal the high crystallinity of the as-prepared samples. The diffraction peaks of the nanospheres was largely weakened with the increased loading amount of Ag particles. Compared with pure BFO, the intensities of peaks for (012) and (104) of ABFO4 and ABFO8 decrease significantly: 57%, 39% and 72%, 61%, respectively. This can be explained that the loading of Ag causes the X-rays to scatter, resulting in the signal to weaken.The morphology of the samples is confirmed by SEM and the results are shown in Fig. 2(a–c). The pure BFO consists of agglomerated nanospheres with diameters ranging from 50–70 nm in Fig. 2(a),22 which is in line with the reported in the literature.19–21 The SEM images [Fig. 2(b)] of the ABFO4 clearly depicts relatively broadened nanosphere distribution, approximately 40–70 nm and the ABFO8 [Fig. 2(c)] displays a totally inhomogeneous particle size distribution (30–120 nm).23 No changes can be found in the surface morphology of BFO by SEM after Ag loading. All results indicate that the loading of Ag, small in size and uniform dispersion, has a certain influence on the size of BFO.
XPS is carried out to verify the existence of Ag and explore the effects of Ag modification on the chemical state of BFO. The spectra are displayed in Fig. 3. Peaks of Bi, Fe, O, Ag and C elements are observed in the fully scanned spectrum of ABFO4. The appearance of Ag 3d3/2 and Ag 3d5/2 peaks indicates that the Ag nanoparticles are successfully deposited on the surface of BFO nanospheres by light irradiation. Fig. 3(b) displays Ag 3d XPS spectrum of ABFO4 and O 1s (inset) spectra of BFO and ABFO4. As seen from Fig. 3(b), the O 1s has two peaks at 533.0 eV and 535.6 eV, respectively. The peak with a lower binding energy is related to the O 1s binding energy whereas the other is attributed to the loss of oxygen in the sample.24–26 But for ABFO4, the peak located at 533.0 eV decreases dramatically. This means that the change in the content of the oxygen atom sharply while the peak at 535.6 eV is almost constant, indicating that the oxygen vacancy does not change significantly. From the illustration of Fig. 3(b), it is found that the difference in the binding energy between the Ag 3d3/2 and 3d5/2 states is about 6.3 eV, which differs from that of Ag2O and AgO. Therefore, the XPS results demonstrate that Ag exists as metallic phase, but it cannot be examined by the XRD and SEM, which may be interpreted that Ag particles are low content, small in size and uniform dispersion.
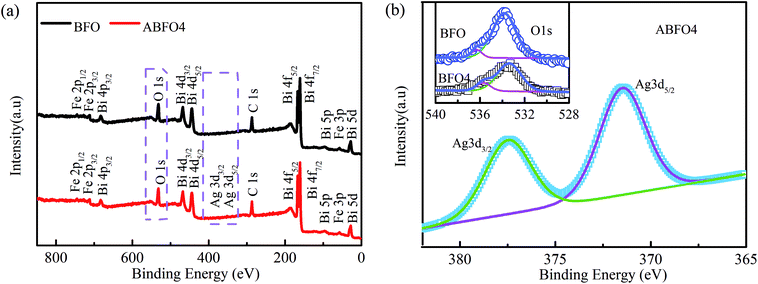 | ||
| Fig. 3 XPS spectra of pure BFO nanospheres and ABFO4 samples: (a) fully scanned spectra, (b) O 1s and Ag 3d3/2, Ag 3d5/2. | ||
3.2 Gas sensing properties
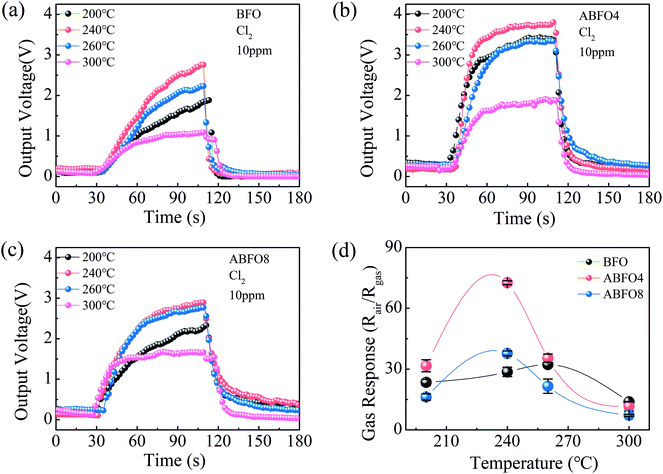
Generally, the absorption of the target gas can be much faster at higher temperatures, when the contaminant adsorption may be restricted. Therefore, the sensitivity and stability can be enhanced to a large extent.27 Nevertheless, extremely high temperatures can change the composition and structure of the sensor materials. Hence, parallel experiments are performed from 200 °C to 300 °C to optimize the working temperature of the gas sensors which are exposed to Cl2 gas at a concentration of 10 ppm. The response and recovery curves of sensors at different temperature are shown in Fig. 4.The resistance of semiconductor metal oxide gas sensors decreases when exposed to oxide gases, indicating a p-type conduction mechanism.28 It is noted that the conduction of the BFO is dominated by the hole concentration. The gas response increases along with the operating temperature and reaches a maximal value at 240 °C, after declines when further raising the temperature as shown in Fig. 4(a). This phenomenon is also observed in Fig. 4(b) and (c). It means that the optimum operating temperature for BFO and Ag decorated BFO sensors is 240 °C. Fig. 4(d) displays that the gas response of ABFO4 to 10 ppm Cl2 could reaches 72.62, which is far superior to pure BFO and ABFO8. The gas response of p-type gas sensors for oxidizing gases was calculated from the following eqn (1):
| S = Ra/Rg | (1) |
Sensitivity is the most crucial factor when determining whether a gas sensor is suitable for practical application. Fig. 5 shows the typical response/recovery curves of sensors and gas response of ABFO4 to Cl2 as the concentration varied from 7 ppm to 20 ppm at 240 °C. The output voltage of the sensors increases with increasing of the concentration of target gas (7–20 ppm) in Fig. 5(a). Fig. 5(b) shows that the gas response value rises rapidly from 7 ppm to 10 ppm while this trend is suppressed when the concentration of target gas further goes up. It is also noteworthy that the limit of detection (LOD) of ABFO4 sensor (inset) for Cl2 is 0.153 ppm. The sensitivity comparison of ABFO4 nanospheres and other reported materials in Cl2 at the optimum working temperature are summarized in Table 1.3,29–32 Compared to p-type semiconductor metal oxides, the response time is shorter.
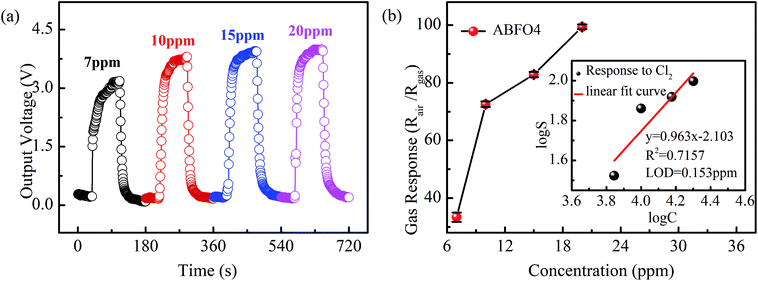 | ||
| Fig. 5 (a) Typical response and recovery curve of sensors and (b) sensitivity pattern of ABFO4 to Cl2 as the concentration varied from 7 ppm to 20 ppm at 240 °C. | ||
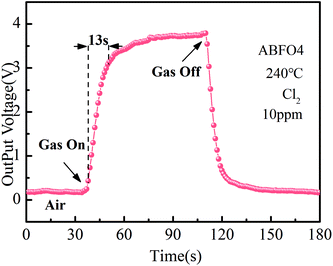
Fig. 6 shows the response and recovery curve of ABFO4 sensor to 10 ppm Cl2 at 240 °C. The gas response time is 24 s. Compared with many metal oxides, such as In2O3, BFO displays a long response time, which is related to the p-type semiconductor response mechanism of oxidizing gases. But the stability of BFO is much higher in long term application and extreme conditions, so it still has a broad development prospects and practical value.
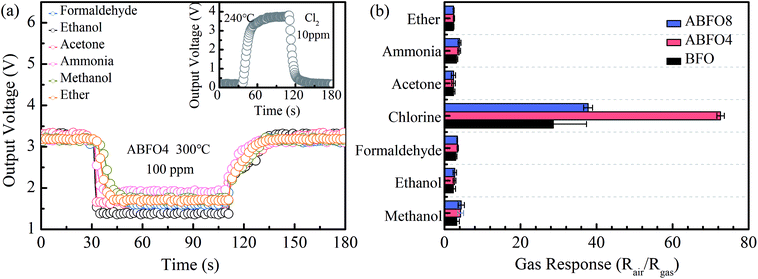
Selectivity is another vital factors in the development of gas sensors for the real market. BFO exhibits a high performance to ethanol at 300 °C according to the previous paper. Fig. 7(a) shows a typical response curve of ABFO4 to 100 ppm ammonia, acetone, ethanol, ether, formaldehyde and methanol at 300 °C, but 10 ppm Cl2 at 240 °C (inset). The gas response of BFO, ABFO4 and ABFO8 to 10 ppm Cl2 and 100 ppm other gases is displayed in Fig. 7(b). As is shown, the BFO material has excellent selectivity for Cl2.
3.3 Gas sensing mechanism
To get a better understanding of the BFO mechanism for Cl2, it can be analyzed from the following aspects: chemisorption, a hole-accumulation layer, band bending and resistance change. The dangling bonds are a vital precondition for gas sensors, because it can possess geometrically and electronically favorable sites for molecule chemisorption and charge transfer in gas–solid interface.33 The adsorption of chlorine and oxygen can be figured out by the reactions as follows:| 2S + O2 → O(ads) + O(ads) | (2) |
| 2S + Cl2 → Cl(ads) + Cl(ads) | (3) |
 | (4) |
 denotes the adsorption sites on the surface, oxygen vacancy and lattice oxygen, respectively.
On the surface of the semiconductor, electrons are drawn by O2 from the conduction band of the materials and trapped at the surface to form ionized oxygen. According to the Wolkenstein's model,34–36 the adsorbed O2 are partially ionized into different chemical forms (O2−, O− or O2−, etc.) at different temperatures. The process of semiconductor surface resistance change is mainly dominated by the process of O2 and chlorine molecules adsorption, ionization and desorption.
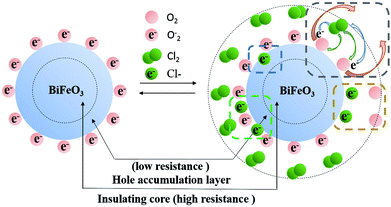
The mechanism for the response of BFO nanospheres to Cl2 is shown in Fig. 8. In the air atmosphere, O2 are adsorbed on the surface of BFO nanospheres and O2− ions are formed at 100–300 °C, as the eqn (5) shows. When Cl2 is injected, the reactions in eqn (6)–(9) occur. Electrons are captured by Cl2 as shown in eqn (6) and (7), resulting in an increase in the number of holes. O2− ions are consumed by Cl2 as displayed in eqn (8). In stark contrast, electrons are released (eqn (9)), resulting in a decrease in the number of holes due to the partial electron–hole neutralization. As a result, the reactions in eqn (6)–(8) decrease the resistance of p-type metal oxide semiconductors, whereas the reaction in eqn (9) increase the resistance.37 In this work, the resistance of BFO, ABFO4 and ABFO8 sensors decreased among all Cl2 concentrations at all measured temperatures. Thus, the sensing mechanism is dominated as eqn (6)–(8) demonstrate. Meanwhile, the reactions in eqn (6)–(8) reduce the amount of electrons on the surface and form a hole accumulation layer near the surface, causing the valence band to bend upwards and form a potential barrier that hinders the reaction, as shown in Fig. 9.
| O2(ads) + e− → O2(ads)− | (5) |
| Cl2 + 2e− ⇌ 2Cl(surf)− | (6) |
 | (7) |
| Cl2 + (2O2−)(ads) ⇌ 2Cl(ads)− + 2O2 | (8) |
 | (9) |
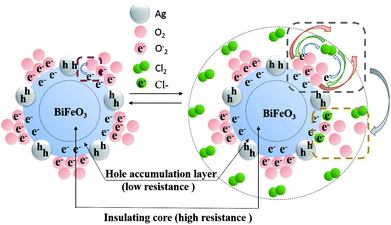
The gas sensing mechanism of Cl2 by Ag nanoparticles modified BFO nanospheres is shown in Fig. 10. Fig. 11 shows the band structure and holes transfer after Ag nanoparticles loading. The main reasons for the promotion of gas sensitivity of BFO by Ag nanoparticles are as follows: as a p-type semiconductor, the majority carriers in the BFO nanospheres are holes. When Ag is loaded on the BFO surface, the number of positive charges on the BFO nanospheres decreases and the conduction band and the valence band bends downward because the holes on BFO nanospheres transfer to Ag.38 Energy potential is generated between the Ag and BFO nanospheres barrier. With the separation of electrons and holes, electrons are more likely to combine with O2 and Cl2 on the surface, and no barrier is generated due to the decreased amount of electrons in the conduction band, which promotes the progress of the reaction. At the same time, the Fermi levels of BFO and Ag match each other to the same level after the contact, since the work function φm of BFO is lower than the work function φs of Ag.
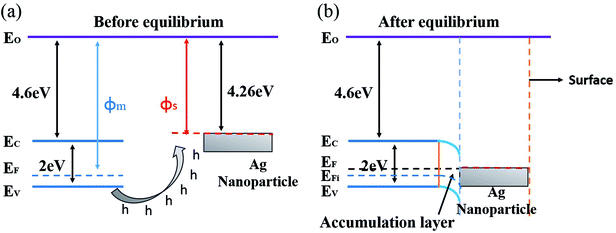 | ||
| Fig. 11 Energy band structure and hole transfer in Ag nanoparticles decorated BFO microspheres (a) before equilibrium, (b) after equilibrium. | ||
Ag particles can also serve as a special adsorption site for O2 and Cl2; in addition, a Schottky junction can be formed at the interface of Ag and BFO, thereby reducing the intergranular barriers and improving the interfacial effect;39,40 furthermore, due to the fast transfer of charge carriers from BFO to the Ag, the number of electrons for reactions sites is increased and the reaction can be rapidly saturated. Thereby, the gas response is largely enhanced and the response time is shortened.
Hence, it is noteworthy that the above-mentioned results can account for the improvement in the sensitivity of BFO, with a certain amount of Ag decoration (ABFO4). However, when an overdose of Ag is loaded (ABFO8), the adsorbed oxygen goes down significantly, resulting in reduction of the amount of oxygen and chlorine gas adsorption, thus decreasing the gas response.
4. Conclusions
We successfully fabricated Ag modified BFO sensors for Cl2 sensing application. The phase composition, surface morphology and element chemical state of Ag modified BiFeO3 nanospheres were studied systematically. The Cl2 gas sensing characteristics of the sensors were also investigated detailedly. Compared with BFO and ABFO8, ABFO4 exhibited a superior sensitivity for Cl2 with rapid response (13 s) and relatively short recovery time (24 s) to 10 ppm Cl2 at 240 °C. Furthermore, the as-prepared ABFO4 sensor showed excellent selectivity in natural environment. The largely enhanced sensing performances are attributed to the fact that the presence of Ag not only increase the density of holes and the amount of gas adsorption sites but also has a catalytic effect. Thus, the modification of the noble metal opens up a new direction for the improvement of the gas sensitivity of p-type semiconductors to Cl2.Conflicts of interest
There are no conflicts to declare.Acknowledgements
This work is supported by the National Nature Science Foundation (51672220), the SPDRF (20116102130002), the 111 Program (B08040) of MOE, the National Defense Science Foundation (32102060303), the Xi'an Science and Technology Foundation (XBCL-1-08, CXY1706-5), the SKLP Foundation (KP201421, KP201523), the Project of Key Areas of Innovation team in Shaanxi Province (2014KCT-12), the Fundamental Research Funds for the Central Universities (3102014JGL01002). The Shaanxi Provincial Science Foundation (2017KW-018), and the NPU Gaofeng Project (17GH020824) of China.References
- C. Winder, Environ. Res., 2001, 85, 105–114 CrossRef CAS PubMed.
- C. White and J. Martin, Proc. Am. Thorac. Soc., 2010, 7, 257–263 CrossRef CAS PubMed.
- M. Arif, A. Sanger and A. Singh, J. Electron. Mater., 2018, 47, 3451–3458 CrossRef CAS.
- J. Guo, Y. Lin, H. Huang, S. Zhang, T. Huang and W. Weng, Sens. Actuators, B, 2017, 224, 965–971 CrossRef.
- T. Miyata, S. Kawaguchi and M. Ishii, Thin Solid Films, 2003, 425, 255–259 CrossRef CAS.
- P. Rao and R. V. Godbole, J. Magn. Magn. Mater., 2016, 405, 219–224 CrossRef CAS.
- S. Waghmare, V. Jadhav, S. Gore, S. Yoon, S. Ambade, B. Lokhande, R. Mane and S. Han, Mater. Res. Bull., 2012, 47, 4169–4173 CrossRef CAS.
- X. Yu, Y. Wang, Y. Hu, C. Cao and H. Chan, J. Am. Ceram. Soc., 2009, 92, 3105–3107 CrossRef CAS.
- S. Waghmare, V. Jadhav, S. Shaikh, R. Mane, J. Rhee and C. O'Dwyer, Sens. Actuators, A, 2018, 271, 37–43 CrossRef CAS.
- G. Dong, H. Tian and J. Fang, RSC Adv., 2015, 5, 29618–29623 RSC.
- H. Obayashi, Y. Sakurai and T. Gejo, J. Solid State Chem., 1976, 17, 299–303 CrossRef CAS.
- H. Kim and J. Lee, Sens. Actuators, B, 2014, 192, 607–627 CrossRef CAS.
- X. Deng, C. Song, Y. Tong, G. Yuan, F. Gao, D. Liu and S. Zhang, Phys. Chem. Chem. Phys., 2018, 20, 3648–3657 RSC.
- E. Gaspera, M. Guglielmi, A. Martucci, L. Giancaterini and C. Cantalini, Sens. Actuators, B, 2012, 164, 54–63 CrossRef.
- J. Fu, C. Zhao, J. Zhang, Y. Peng and E. Xie, ACS Appl. Mater. Interfaces, 2013, 5, 7410–7416 CrossRef CAS PubMed.
- N. G. Cho, H.-S. Woo, J.-H. Lee and I.-D. Kim, Chem. Commun., 2011, 47, 11300–11302 RSC.
- R. Joshi and F. Kruis, Appl. Phys. Lett., 2006, 89, 153116 CrossRef.
- W. Wei, S. Guo, C. Chen, L. Sun, Y. Chen, W. Guo and S. Ruan, J. Alloys Compd., 2017, 695, 1122–1127 CrossRef CAS.
- H. Wu, P. Xue, Y. Lu and X. Zhu, J. Alloys Compd., 2017, 731, 471–477 CrossRef.
- T. Park, G. Papaefthymiou, A. Viescas, A. Moodenbaugh and S. Wong, Nano Lett., 2007, 7, 766–772 CrossRef CAS PubMed.
- X. Ren, Y. Zhao, Z. Liu and H. Fan, ACS Appl. Mater. Interfaces, 2016, 8, 26190–26197 CrossRef CAS PubMed.
- M. Hjiri, L. ElMir, S. Leonardi, A. Pistone, L. Mavilia and G. Neri, Sens. Actuators, B, 2014, 196, 413–420 CrossRef CAS.
- T. Dang, N. Hoa, N. Duy and N. Hieu, ACS Appl. Mater. Interfaces, 2016, 8, 4828–4837 CrossRef PubMed.
- L. Fang, J. Liu, S. Ju, F. Zheng, W. Dong and M. Shen, Appl. Phys. Lett., 2010, 97, 242501–242503 CrossRef.
- C. Rath, P. Mohanty, A. Pandey and N. Mishra, J. Phys. D: Appl. Phys., 2009, 42, 205101 CrossRef.
- M. Naeem, S. Hasanain, M. Kobayashi, Y. Ishida, A. Fujimori, S. Buzby and S. Shah, Nanotechnology, 2006, 17, 2675–2680 CrossRef CAS PubMed.
- K. Toda, Bunseki Kagaku, 1990, 39, 611–615 CrossRef CAS.
- D. Williams, Sens. Actuators, B, 1999, 57, 1–16 CrossRef CAS.
- C. Reddy, S. Manorama and V. Rao, Sens. Actuators, B, 1999, 55, 90–95 CrossRef.
- T. Miyata, T. Hikosaka and T. Minami, Sens. Actuators, B, 2000, 69, 16–21 CrossRef CAS.
- D. Wang, P. Hu, J. Xu, X. Dong and Q. Pan, Sens. Actuators, B, 2009, 140, 383–389 CrossRef CAS.
- P. Li and H. Fan, Mater. Sci. Semicond. Process., 2015, 29, 83–89 CrossRef CAS.
- G. Sun, P. Zhao, W. Zhang, H. Li and C. He, Mater. Chem. Phys., 2017, 186, 305–311 CrossRef CAS.
- A. Labidi, E. Gillet, R. Delamare, M. Maaref and K. Aguir, Sens. Actuators, B, 2006, 120, 338–345 CrossRef CAS.
- K. Wetchakun, T. Samerjai, N. Tamaekong, C. Liewhiran, C. Siriwong, V. Kruefu, A. Wisitsoraat, A. Tuantranont and S. Phanichphant, Sens. Actuators, B, 2011, 160, 580–591 CrossRef CAS.
- R. Khadayate, M. Chaudhari, S. Disawal and P. Patil, Invertis Journal of Science & Technology, 2009, 2, 185–189 Search PubMed.
- A. Dey, Mater. Sci. Eng., B, 2018, 229, 206–217 CrossRef CAS.
- Y. Chen, F. Zheng, Y. Min, T. Wang, Y. Zhang and Y. Wang, J. Mater. Sci.: Mater. Electron., 2012, 23, 1592–1598 CrossRef CAS.
- L. Chen and S. Tsang, Sens. Actuators, B, 2003, 89, 68–75 CrossRef CAS.
- S. Sarkar, M. Pradhan, A. K. Sinha, M. Basu, Y. Negishi and T. Pal, Inorg. Chem., 2010, 49, 8813 CrossRef CAS PubMed.
| This journal is © The Royal Society of Chemistry 2018 |

