 Open Access Article
Red C-dots and C-dot films: solvothermal synthesis, excitation-independent emission and solid-state-lighting†
Daqin Chen *ab,
Xiao Chena,
Haobo Gaoa and
Jiasong Zhonga
aCollege of Materials & Environmental Engineering, Hangzhou Dianzi University, Hangzhou, 310018, P. R. China. E-mail: dqchen@hdu.edu.cn
bCollege of Physics and Energy, Fujian Normal University, Fuzhou, Fujian 350117, P. R. China. E-mail: dqchen@fjnu.edu.cn
First published on 23rd August 2018
Abstract
Currently, fluorescent carbon dots (CDs) have attracted great attention for their unique optical performance. However, the shortage of red emissive CDs and the corresponding CD solid samples with intense luminescence significantly limit their applications in optoelectronic fields. In the present work, red fluorescence CDs were successfully synthesized via a facile solvothermal reaction using p-phenylenediamine as the carbon source and isopropanol as the solvent. Excitation-independent luminescence and emission-independent decay indicated that one dominant type of emissive state was responsible for red luminescence, which was evidenced to be a N-related surface defect state with the help of structural and spectroscopic characterizations. Furthermore, CD-embedded PVA solid films, exhibiting bright red emission with intense absorption in the blue-light region, were prepared to explore their possible application as a color converter in solid-state lighting. As a proof-of-concept experiment, white light-emitting diode devices were constructed by combining a red CD solid film and yellow Ce:YAG phosphor-in-glass with a commercial InGaN blue chip, showing tunable color coordinates, color rendering index and correlated color temperature via modifying the thickness of the CD film.
Introduction
Because of their superiority in terms of excellent water solubility, optical stability, unique fluorescence performance, low toxicity and low cost, fluorescent carbon quantum dots, as a new type of nanomaterial, have been studied intensively over the past decade for potential applications in fluorescent probes, light emitting devices and biosensors.1–5 Since carbon dots (CDs) were discovered, various synthetic methods have been developed, and they can be largely divided into “top-down” and “bottom-up” routes.6–8 This classification is mainly based on carbon sources. The “top-down” route physically breaks macroscopic carbon materials into smaller nanomaterials, while the “bottom-up” route chemically generates C-dots through molecular self-assembly reactions from various small-molecule reagents.9–12 Recently, the bottom-up route has attracted great attention and been widely used to prepare CDs since the precursor sources are abundant and the reaction is easy to operate.Presently, many fluorescent CDs have been prepared, but most of them show dominant emissions in the blue-green spectral region, which limits their practical applications in optoelectronic fields.13–17 Therefore, it is highly desirable to develop CDs with intense and stable red emission. Furthermore, the conversion from CD solution into carbon solid-state powder is urgently required. Unfortunately, the luminescence of CD powder is generally far weaker than that of the corresponding CD solution, probably attributing to aggregation-induced emission quenching.18–23 p-Phenylenediamine (p-PD) has been previously studied as a new carbon source for preparing red-emissive C-dots; however, significantly diverse emissive features were found when different kinds of solvents were adopted.24,25 As a result, the origination of red luminescence was actually confusing and not well understood.
In the present work, we developed a facile one-pot solvothermal reaction to synthesize bright excitation-independent red-emissive N-doped CDs using p-PD as the precursor and isopropanol (IPA) as the solvent. Series of structural and optical spectroscopic characterizations were carried out to evidence that N-related defect states on the surfaces of CDs were responsible for the red luminescence. Importantly, the obtained CDs can be easily converted into solid CD film with retained intense red luminescence. As a concept-of-experiment, the red-emissive CD film was used as color converter to demonstrate its promising application in solid-state-lighting.
Experimental section
Synthesis of red CDs
0.25 mmol PPD was first dissolved in 20 mL isopropanol (IPA), and stirred to form a transparent solution. Then the solution was transferred into a 25 mL Teflon-lined stainless steel autoclave. After heating at 200 °C in an oven for 1 h and cooling to room temperate naturally, the resulted solution was centrifuged to remove large particles and red suspension was achieved. Finally, the solution was transferred into a vacuum freeze drier for drying 2 days to obtain C-dot solid powders.Preparation of CD films
Polyvinyl alcohol (PVA, 2.0 g) was firstly dissolved in 10 mL ultrapure water at 100 °C and then red C-dots IPA solution was dropwise added to produce C-dot aqueous solution (CD contents: 0.1–0.4 mg mL−1). After stirring for 5 minutes, the resulting mixture was transferred into a clean glass substrate and heated in a vacuum oven at 60 °C for 24 h to obtain a solid composite film.Preparation of Ce3+:Y3Al5O12 (Ce:YAG) phosphor-in-glass (PiG) plate
A low-temperature co-sintering route was adopted to fabricate yellow-emissive Ce:YAG PiG plate. Low-melting glass with composition of 40SnF2–30SnO–30P2O5– 10CsF (in mol%) and 3wt% commercial Ce:YAG phosphor (XinLi Illuminant Co. Ltd.) were thoroughly mixed and sintered in a corundum crucible at 400 °C for 20 min under an ambient atmosphere. The melt was quenched into a pre-heated steel mold and then naturally cooled to room temperature. The as-prepared PiG was elaborately polished and cut into φ10 mm plate with a thickness of 0.5 mm.Construction of white light-emitting diode (wLED)
LED devices were designed by directly coupling the as-prepared C-dot film/PiG color converters on the InGaN blue chip. To tune optoelectronic parameters, different thicknesses of C-dot film were adopted. Opaque silica gels were filled around the edges of device in order to avoid the leakage of blue light.Characterization
The actual compositions of CD samples were determined by X-ray photoelectron spectroscopy (XPS) using a VG Scientific ESCA Lab Mark II spectrometer equipped with two ultra-high-vacuum 6 chambers. All the binding energies were referenced to the C 1s peak of the surface adventitious carbon at 284.6 eV. Fourier transform infrared (FTIR) spectra were recorded on a Nicolet 6700 FTIR spectrometer in the range 400–4000 cm−1 using the KBr pellet technique. Raman spectra were recorded on a microscopic confocal Raman spectrometer (Renishaw Trade Co., Ltd., England) under the excitation of a 785 nm laser. Microstructure observation was performed on a JEOL JEM-2010 transmission electron microscope (TEM) at 200 kV accelerating voltage. Absorption and emission spectra were recorded on an Edinburgh Instruments (EI) FS5 spectrofluorometer equipped with continuous (150 W) and pulsed xenon lamps. Excitation–emission mappings of red CDs were recorded by continuously changing the excitation wavelength with a fixed step of 1 nm, and the offset between excitation wavelength and emission was set at 30 nm to reduce scattering light. Absolute photoluminescence quantum yield (PLQY), defined as the ratio of emitted photons to absorbed ones, was determined by a spectrofluorometer (FS5) equipped with an integrating sphere. Time-resolved spectra of red CDs were performed on a fluorescent lifetime spectrometer (LifeSpec-II, EI) based on a time-correlated single-photon-counting technique under the excitation of 475 nm picoseconds laser. The lifetimes were evaluated via the equation of τ = ∫I(t)dt/I0, where I(t) is the time-related luminescence intensity and I0 is the peak intensity. Electroluminescence (EL) spectra, Commission Internationale de L'Eclairage (CIE) chromaticity coordinates, color rendering index (CRI), correlated color temperature (CCT), and luminous efficiency (LE) of the constructed wLEDs were recorded in a HAAS-2000 spectroradiometer (Everfine) under an operating current of 10–200 mA. All the experiments were performed at room temperature.Results and discussion
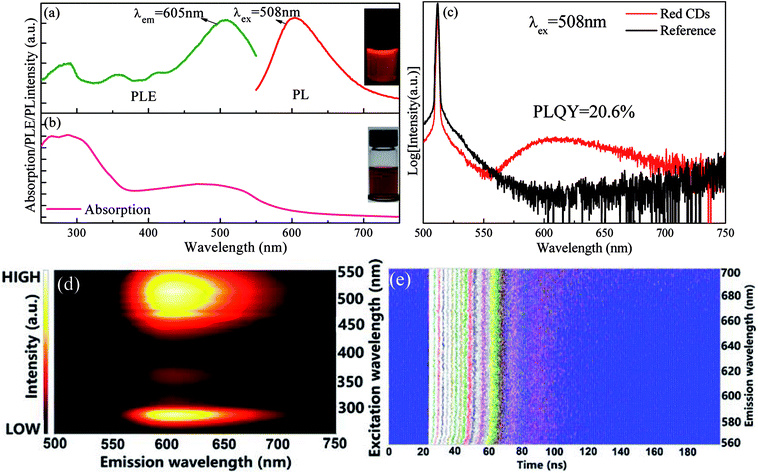
p-PD acting as carbon source and IPA as solvent was adopted to fabricated red CDs by a one-pot solvothermal reaction. Herein, the presence of p-PD was crucial for obtaining CDs with long-wavelength emission as p-PD is the only carbon source. In fact, experimental conditions, including reaction temperature, time and p-PD content, significantly affect optical performance of the as-prepared CDs (Fig. S1†), and the optimal conditions for efficient luminescence of CDs are determined to be 200 °C, 1 h and 0.25 mmol. As shown in Fig. 1a, a broad red emission band centered at 605 nm is detected in the PL spectrum and multiple excitation bands are observed in the corresponding PLE spectrum. A typical peak at 270 nm assigned to π–π* (aromatic C![[double bond, length as m-dash]](https://www.rsc.org/images/entities/char_e001.gif) C) transition and a broad absorption band in the wavelength region of 400–600 nm probably attributed to transitions from surface defect states to ground state are observed in the UV-visible absorption spectrum (Fig. 1b). As revealed in Fig. 1c, absolute PLQY of red CDs is determined to be as high as 20.6%, being close to the values (4–25%) for those previously reported orange or red CDs.17,26–28 Importantly, the present red CDs exhibit excitation-independent emission feature, i.e., upon the variation of excitation light wavelength, the emission intensity gradually changes but the emission peak position does not vary, as evidenced in Fig. 1d and S2a.† This result indicates that the luminescence is probably originated from an individual emitting state in red CDs. Indeed, PL lifetime curves (Fig. S2b†) and the corresponding contour plot (Fig. 1e) evidence that no obvious change in decay lifetime is found with increase of detecting emission wavelength of red CDs from 560 nm to 700 nm. All these experimental results verify that only one type of emission state in the prepared CDs is dominantly responsible for the observed red luminescence.
C) transition and a broad absorption band in the wavelength region of 400–600 nm probably attributed to transitions from surface defect states to ground state are observed in the UV-visible absorption spectrum (Fig. 1b). As revealed in Fig. 1c, absolute PLQY of red CDs is determined to be as high as 20.6%, being close to the values (4–25%) for those previously reported orange or red CDs.17,26–28 Importantly, the present red CDs exhibit excitation-independent emission feature, i.e., upon the variation of excitation light wavelength, the emission intensity gradually changes but the emission peak position does not vary, as evidenced in Fig. 1d and S2a.† This result indicates that the luminescence is probably originated from an individual emitting state in red CDs. Indeed, PL lifetime curves (Fig. S2b†) and the corresponding contour plot (Fig. 1e) evidence that no obvious change in decay lifetime is found with increase of detecting emission wavelength of red CDs from 560 nm to 700 nm. All these experimental results verify that only one type of emission state in the prepared CDs is dominantly responsible for the observed red luminescence.
The surface states and element analysis of red CDs were characterized by X-ray photoelectron spectroscopy (XPS), Fourier transform infrared (FTIR) and Raman spectra. For FTIR spectrum, amine (3226 cm−1), methylene (2920 cm−1), C![[double bond, length as m-dash]](https://www.rsc.org/images/entities/char_e001.gif) C (1491 cm−1), O–H (3425 cm−1), C
C (1491 cm−1), O–H (3425 cm−1), C![[double bond, length as m-dash]](https://www.rsc.org/images/entities/char_e001.gif) N (1642 cm−1) and C–O (1124 cm−1) functional groups or chemical bonds are detected on the surface of red CDs (Fig. 2a).29,30 These FTIR assignments are further verified by XPS analysis. The red CDs mainly contain C, N and O elements (Fig. 2b). High-resolution C 1s XPS spectrum exhibits a distinctive peak at 284.7 eV assigned to C
N (1642 cm−1) and C–O (1124 cm−1) functional groups or chemical bonds are detected on the surface of red CDs (Fig. 2a).29,30 These FTIR assignments are further verified by XPS analysis. The red CDs mainly contain C, N and O elements (Fig. 2b). High-resolution C 1s XPS spectrum exhibits a distinctive peak at 284.7 eV assigned to C![[double bond, length as m-dash]](https://www.rsc.org/images/entities/char_e001.gif) C/C–C (Fig. 2c), N 1s XPS spectrum shows a characteristic peak at 400.5 attributed to pyrrolic-like N (Fig. 2d), and O 1s XPS spectrum reveals a peak of C
C/C–C (Fig. 2c), N 1s XPS spectrum shows a characteristic peak at 400.5 attributed to pyrrolic-like N (Fig. 2d), and O 1s XPS spectrum reveals a peak of C![[double bond, length as m-dash]](https://www.rsc.org/images/entities/char_e001.gif) O at 533.1 eV (Fig. 2e).31,32 Additionally, Raman spectrum in the 1000–1800 cm−1 region (Fig. 2f) was measured under 785 nm laser excitation to characterize the intrinsic structure of red CDs, where G band centered at 1540 cm−1 attributes to graphitic sp2 carbon and D band located at 1350 cm−1 originates from defects on the surface of red CDs.33–35
O at 533.1 eV (Fig. 2e).31,32 Additionally, Raman spectrum in the 1000–1800 cm−1 region (Fig. 2f) was measured under 785 nm laser excitation to characterize the intrinsic structure of red CDs, where G band centered at 1540 cm−1 attributes to graphitic sp2 carbon and D band located at 1350 cm−1 originates from defects on the surface of red CDs.33–35
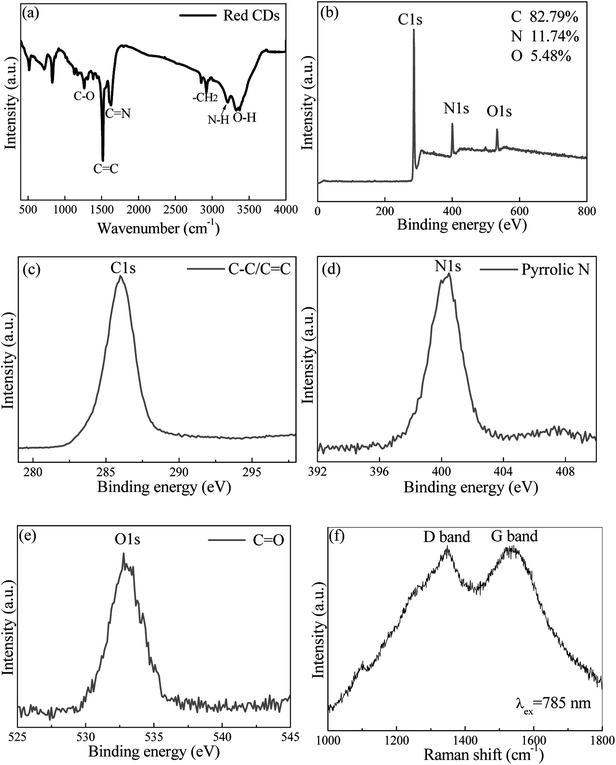 | ||
| Fig. 2 (a) FTIR spectrum, (b) XPS full-survey and high-resolution XPS (c) C 1s, (d) N 1s and (e) O 1s spectra. (f) Raman spectrum of the as-prepared red CDs. | ||
TEM image, shown in Fig. 3a, demonstrates that the synthesized red CDs are monodispersed with sizes in the range of 3–5 nm. XRD pattern (Fig. 3b) shows two broad humps, confirming the amorphous structure of red CDs. Accordingly, based on the above structural and spectroscopic characterizations, a possible structural model of the present CDs and the related energy-state structure responsible for multi-state absorption and red luminescence were proposed, as schematically illustrated in Fig. 3c and d. During solvothermal reaction, p-PD acting as both C source and N source could assemble into N-doped CDs through the dehydrolysis, carbonization and nitridation processes accompanied with the formation of organic functional groups on the surfaces including COOH, C![[double bond, length as m-dash]](https://www.rsc.org/images/entities/char_e001.gif) O, C
O, C![[double bond, length as m-dash]](https://www.rsc.org/images/entities/char_e001.gif) N, OH and NH2 and the resulted O-/N-related defect states (Fig. 3c). As proposed in Fig. 3d, the absorption/excitation bands in the UV region are originated from π → π* (HOMO → LUMO) transition of C
N, OH and NH2 and the resulted O-/N-related defect states (Fig. 3c). As proposed in Fig. 3d, the absorption/excitation bands in the UV region are originated from π → π* (HOMO → LUMO) transition of C![[double bond, length as m-dash]](https://www.rsc.org/images/entities/char_e001.gif) C bonds of sp2 C domain, and those in the visible region are assigned to the transitions from π states to O- and N-related defect states located within energy gap of CDs. As a result, upon the excitation of UV-visible light, the electrons in LUMO state and O-related defect states will non-radiatively relax into N-related defect states, from which red emission yields via radiative transition to HOMO states. To evidence surface defect-state induced red luminescence in the present CDs, pH dependent emission/absorption behaviors were investigated. For the PL spectra (Fig. S3a†), the emission peak position and emission intensity significantly vary when pH value deviates from 7; for the absorption spectra (Fig. S3b5†), HOMO → LUMO (π → π*) transition of the graphitic C domain in the UV region shows no obvious change while the absorption transitions from π ground state to O-/N-related defect states exhibit remarkable pH-dependent. All these results confirm that the red emission of CDs is actually caused by the N-related defect states, and the introduction of H+ and OH− has a great influence on these surface emitting-states.
C bonds of sp2 C domain, and those in the visible region are assigned to the transitions from π states to O- and N-related defect states located within energy gap of CDs. As a result, upon the excitation of UV-visible light, the electrons in LUMO state and O-related defect states will non-radiatively relax into N-related defect states, from which red emission yields via radiative transition to HOMO states. To evidence surface defect-state induced red luminescence in the present CDs, pH dependent emission/absorption behaviors were investigated. For the PL spectra (Fig. S3a†), the emission peak position and emission intensity significantly vary when pH value deviates from 7; for the absorption spectra (Fig. S3b5†), HOMO → LUMO (π → π*) transition of the graphitic C domain in the UV region shows no obvious change while the absorption transitions from π ground state to O-/N-related defect states exhibit remarkable pH-dependent. All these results confirm that the red emission of CDs is actually caused by the N-related defect states, and the introduction of H+ and OH− has a great influence on these surface emitting-states.
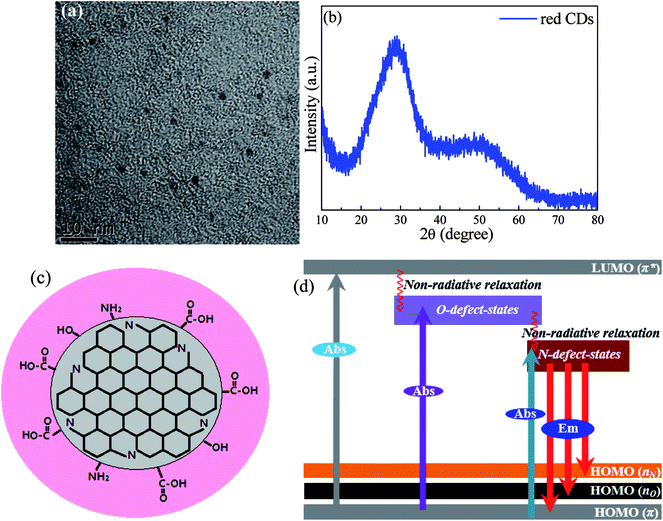 | ||
| Fig. 3 (a) TEM image and (b) XRD pattern of red CDs. (c) Proposed structural model and (d) the corresponding absorption (Abs) and red emission (Em) mechanisms for the investigated CDs. | ||
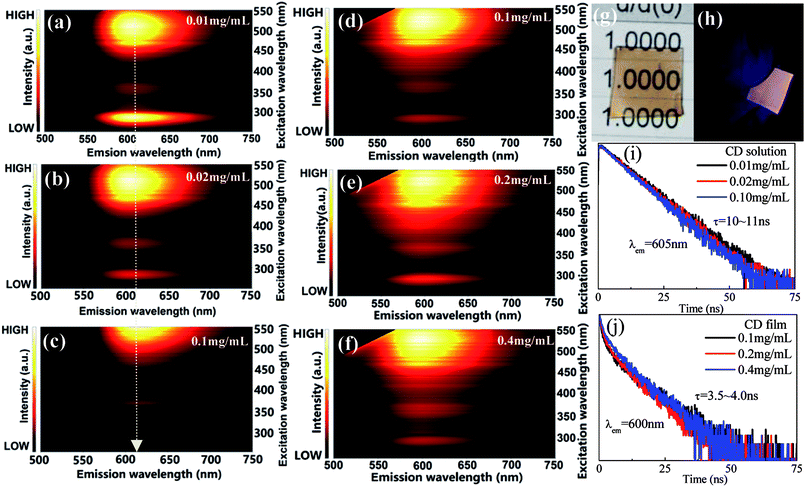
As schematically illustrated in Fig. 4a–c, the luminescence of red CD solutions with different CD concentrations were studied. With increase of CD content, the excitation peak position of red CDs gradually red-shifts towards long-wavelength, i.e., the optimal excitation wavelength required for efficient red emission changes from 510 nm to 550 nm, which are actually due to reabsorption effect of high-content CDs in solution. To enable their application in solid-state-lighting, C-dot solid powders were further obtained by the vacuum freeze-drying method. Unfortunately, no any red luminescence was detected under the excitation of UV-visible light, probably attributing to the aggregation-induced emission quenching. To solve this issue, herein PVA was utilized as the supporting matrix to prepare red CD solid films with adjustable shape, size and thickness. Different to CD solution, CD solid films show invariable emissions with increase of CD content in PVA and no red-shift of excitation wavelength is found (Fig. 4d–f). Importantly, the prepared CD films can be effectively excited by blue light, enabling their application in white light-emitting diode as red color converter. The prepared CD film shows high transparency under daylight (Fig. 4g) and yields bright red luminescence under the irradiation of blue light (Fig. 4h). Notably, compared to CD solution, the luminescence of CD solid film exhibits slight blue-shift from 605 nm to 600 nm, probably attributing to the modification of defect-related energy states induced by interaction between C-dots and PVA matrix. As shown in Fig. 4i and g, the variation of CD contents will not result in significant change of decay lifetimes, however, the lifetime of CD solid film is obviously shorter than that of CD solution.
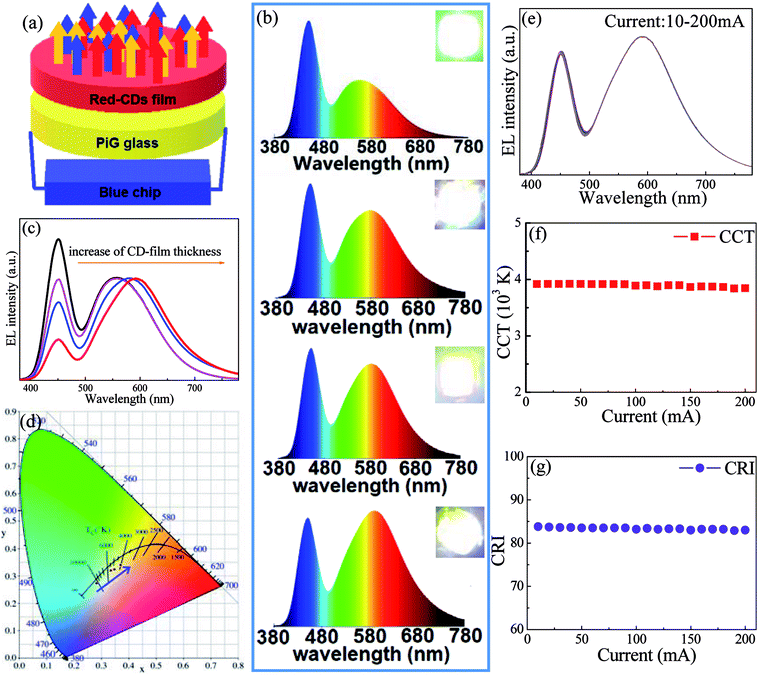
As a proof-of-concept experiment, wLED devices were constructed by coupling commercial InGaN blue chip with yellow Ce:YAG PiG and red CD film, as schematically illustrated in Fig. 5a. EL spectra of wLEDs driven by 100 mA operating current consist of blue emission attributed to InGaN chip and yellow-red luminescence originated from Ce:YAG and CDs (Fig. 5b). With increase of thickness of CD film, the yellow-red emission relative to blue one gradually enhances and the emission wavelength shifts to red light region (Fig. 5c). As a result, the shifting of CIE color coordinates towards red region (Fig. 5d, Table 1), the decreasing of CCT from 10![[thin space (1/6-em)]](https://www.rsc.org/images/entities/char_2009.gif) 714 to 3995 (Table 1), the increasing of CRI from 75 to 85 (Table 1) are clearly observed. Correspondingly, the emitting color of wLED changes from cold white to warm white, as evidenced in insets of Fig. 5b. Finally, the influence of driving current on optoelectronic properties for a typical wLED was investigated. As revealed in Fig. 5e–g, no remarkable change of EL spectra, CCT and CRI is observed with increase of operating current form 10 mA to 200 mA, proving that the developed CD solid film is applicable as red color converter in solid-state-lighting.
714 to 3995 (Table 1), the increasing of CRI from 75 to 85 (Table 1) are clearly observed. Correspondingly, the emitting color of wLED changes from cold white to warm white, as evidenced in insets of Fig. 5b. Finally, the influence of driving current on optoelectronic properties for a typical wLED was investigated. As revealed in Fig. 5e–g, no remarkable change of EL spectra, CCT and CRI is observed with increase of operating current form 10 mA to 200 mA, proving that the developed CD solid film is applicable as red color converter in solid-state-lighting.
| Device | CD-film thickness (mm) | Color coordinates | CCT | CRI |
|---|---|---|---|---|
| S1 | 0 | (0.283, 0.274) | 10![[thin space (1/6-em)]](https://www.rsc.org/images/entities/char_2009.gif) 714 714 |
75 |
| S2 | 0.5 | (0.335, 0.319) | 5359 | 81 |
| S3 | 1.0 | (0.348, 0.324) | 4772 | 84 |
| S4 | 1.5 | (0.371, 0.341) | 3994 | 85 |
Conclusions
In summary, N-doped carbon dots were synthesized via a facile solvothermal reaction using p-PD as C/N source and IPA as solvent. The as-prepared carbon dots showed bright excitation-insensitive red luminescence, emission-independent decay and absolute PLQY of 20.6%. Microstructural and optical spectroscopic characterizations confirmed that the observed red emission was originated from N-related defect-state on the surfaces of carbon dots. Additionally, red emissive solid films were fabricated by incorporating carbon dots into PVA matrix. Benefited from intense blue light absorption and bright red luminescence, the as-prepared carbon solid films were demonstrated to have promising applications in solid-state-lighting as red color converter.Conflicts of interest
The authors declare no competing financial interest.Acknowledgements
This research was supported by Zhejiang Provincial Natural Science Foundation of China (LR15E020001), National Natural Science Foundation of China (51572065), and 151 Talent's Projects in the Second Level of Zhejiang Province.References
- Z. F. Wang, F. L. Yuan, X. H. Li, Y. C. Li, H. Z. Zhong, L. Z. Fan and S. H. Yang, Adv. Mater., 2017, 29, 1702910 CrossRef PubMed.
- X. H. Gao, C. Du, Z. H. Zhuang and W. Chen, J. Mater. Chem. C, 2016, 4, 6927–6945 RSC.
- F. L. Yuan, Z. B. Wang, X. H. Li, Y. C. Li, Z. A. Tan, L. Z. Fan and S. H. Yang, Adv. Mater., 2017, 29, 1604436 CrossRef PubMed.
- K. K. R. Datta, G. G. Qi, R. Zboril and E. P. Giannelis, J. Mater. Chem. C, 2016, 4, 9798–9803 RSC.
- D. Q. Chen, H. B. Gao, X. Chen, G. L. Fang, S. Yuan and Y. J. Yuan, ACS Photonics, 2017, 4, 2352–2358 CrossRef.
- H. Ali, S. K. Bhunia, C. Dalal and N. R. Jana, ACS Appl. Mater. Interfaces, 2016, 8, 9305–9313 CrossRef PubMed.
- Y. B. Liu, L. Zhou, Y. N. Li, R. P. Deng and H. J. Zhang, Nanoscale, 2017, 9, 491–496 RSC.
- M. I. J. Stich, M. Schaeferling and O. S. Wolfbeis, Adv. Mater., 2009, 21, 2216 CrossRef.
- M. Vedamalai, A. P. Periasamy, C. W. Wang, Y. T. Tseng, L. C. Ho, C. C. Shih and H. T. Chang, Nanoscale, 2014, 6, 13119–13125 RSC.
- J. Y. Zhu, X. Bai, Y. Zhai, X. Chen, Y. S. Zhu, G. C. Pan, H. Z. Zhang, B. A. Dong and H. W. Song, J. Mater. Chem. C, 2017, 5, 11416–11420 RSC.
- T. L. Feng, Q. S. Zeng, S. Y. Lu, X. J. Yan, J. J. Liu, S. Y. Tao, M. X. Yang and B. Yang, ACS Photonics, 2018, 5, 502–510 CrossRef.
- S. L. Hu, A. Trinchi, P. Atkin and I. Cole, Angew. Chem., Int. Ed., 2015, 54, 2970–2974 CrossRef PubMed.
- C. X. Wang, H. H. Lin, Z. Z. Xu, Y. J. Huang, M. G. Humphrey and C. Zhang, ACS Appl. Mater. Interfaces, 2016, 8, 6621–6628 CrossRef PubMed.
- W. Kown, S. Do, J. Lee, S. Hwang, J. K. Kim and S. W. Rhee, Chem. Mater., 2013, 25, 1893–1899 CrossRef.
- H. Nie, M. J. Li, Q. S. Li, S. J. Liang, Y. Y. Tan, L. Sheng, W. Shi and S. X. A. Zhang, Chem. Mater., 2014, 10, 3104–3112 CrossRef.
- S. J. Zhu, Q. N. Meng, L. Wang, J. H. Zhang, Y. B. Song, H. Jin, K. Zhang, H. C. Sun, H. Y. Wang and B. Yang, Angew. Chem., Int. Ed., 2013, 52, 3953–3957 CrossRef PubMed.
- K. Hola, M. Sudolska, S. Kalytchuk, D. Nachtigallova, A. L. Rogach, M. Otyepka and R. Zboril, ACS Nano, 2017, 11, 12402–12410 CrossRef PubMed.
- Y. H. Chen, M. T. Zheng, Y. Xiao, H. W. Dong, H. R. Zhang, J. L. Zhuang, H. Hu, B. F. Lei and Y. L. Liu, Adv. Mater., 2016, 28, 312–318 CrossRef PubMed.
- D. Zhou, L. Di, P. T. Jing, Y. C. Zhai, D. H. Shen, S. N. Qu and A. L. Rogach, Chem. Mater., 2017, 29, 1779–1787 CrossRef.
- P. J. G. Luo, F. Yang, S. T. Yang, S. K. SonKar, L. J. Yang, J. J. Broglie, Y. Liu and Y. P. Sun, RSC Adv., 2014, 4, 10791–10807 RSC.
- S. Sun, L. Zhang, K. Jiang, A. G. Wu and H. W. Lin, Chem. Mater., 2016, 28, 8659–8668 CrossRef.
- H. Wang, C. Sun, X. R. Chen, Y. Zhang, V. L. Colvin, Q. Rice, J. Seo, S. Y. Feng, S. N. Wang and W. W. Yu, Nanoscale, 2017, 9, 1909–1915 RSC.
- D. Q. Chen, W. W. Wei, Y. J. Yuan, Y. Yang, Z. Y. Wan and P. Huang, J. Mater. Chem. C, 2016, 4, 9027–9035 RSC.
- H. Ding, S. B. Yu, J. S. Wei and H. M. Xiong, ACS Nano, 2016, 10, 484–491 CrossRef PubMed.
- K. Jiang, S. Sun, L. Zhang, Y. Lu, A. G. Wu, C. Z. Cai and H. W. Lin, Angew. Chem., Int. Ed., 2015, 54, 5360–5363 CrossRef PubMed.
- Y. Zhai, Y. Wang, D. Li, D. Zhou, P. Jing, D. Shen and S. Qu, J. Colloid Interface Sci., 2018, 528, 281–288 CrossRef PubMed.
- C. Li, Y. Wang, X. Zhang, X. Guo, X. Kang, L. Du and Y. Liu, J. Colloid Interface Sci., 2018, 526, 487–496 CrossRef PubMed.
- Y. Y. Din, X. J. Gong, Y. Liu, W. J. Lu, Y. F. Gao, M. Xian, S. M. Huang and C. Dong, Talanta, 2018, 189, 8–15 CrossRef PubMed.
- C. H. Yang, S. J. Zhu, Z. L. Li, Z. Li, C. Chen, L. Sun, W. Tang, R. Liu, Y. Sun and M. Yu, Chem. Commun., 2016, 52, 111912–111914 Search PubMed.
- H. Ding, J. S. Wei and H. M. Xiong, Nanoscale, 2014, 6, 13817–13823 RSC.
- S. N. Baker and G. A. Baker, Angew. Chem., Int. Ed., 2010, 49, 6726–6744 CrossRef PubMed.
- H. T. Li, X. D. He, Z. H. Kang, H. Huang, Y. Liu, J. Liu, J. L. Liu, S. Y. Lian, C. H. A. Tsang, X. B. Yang and S. T. Lee, Angew. Chem., Int. Ed., 2010, 49, 4430–4434 CrossRef PubMed.
- Y. X. Fang, S. J. Guo, D. Li, C. Z. Zhu, W. Ren, S. J. Dong and E. K. Wang, ACS Nano, 2012, 6, 400–409 CrossRef PubMed.
- C. Zhu, J. Zhai and S. Dong, Chem. Commun., 2012, 48, 9367–9369 RSC.
- S. Zhu, J. Zhang and S. Tang, Adv. Funct. Mater., 2012, 22, 4732–4740 CrossRef.
Footnote |
| † Electronic supplementary information (ESI) available: Fig. S1–S3. More PL spectra, absorption spectra and decay curves of red CDs. See DOI: 10.1039/c8ra06235h |
| This journal is © The Royal Society of Chemistry 2018 |

