
 Open Access Article
 This Open Access Article is licensed under a Creative Commons Attribution-Non Commercial 3.0 Unported Licence
Study on the pyrolysis treatment of HPF desulfurization wastewater using high-temperature waste heat from the raw gas from a coke oven riser
Chao Li ,
Guoqiang Li*,
Shuting Zhang,
Hongyu Wang,
Ying Wang and
Yongfa Zhang
,
Guoqiang Li*,
Shuting Zhang,
Hongyu Wang,
Ying Wang and
Yongfa Zhang
Key Laboratory of Coal Science and Technology, Ministry of Education and Shanxi Province, Taiyuan University of Technology, Taiyuan, 030024, Shanxi, China. E-mail: liguoqiang01@tyut.edu.cn
First published on 31st August 2018
Abstract
Thermogravimetric TG and a single riser from an industrial 4.3 m coke oven were used as pyrolysis reactors to systematically study the newly developed pyrolysis treatment of desulfurization wastewater. The TG study showed that the mixed salt in the desulfurization wastewater was transformed into the crystalline form of ammonium thiocyanate (in the temperature range 95.87–127.38 °C), followed by the isomerization of ammonium thiocyanate to thiourea (in the temperature range 127.38–246.26 °C), involving a total of five major stages. The final pyrolysis temperature was 540 °C, and the cumulative weight loss was 99.57%. The study on the single riser from an industrial 4.3 m coke oven showed that the relationship between the spray amount of desulfurization wastewater (v), the temperature drop (ΔT) and the concentration of ammonium thiocyanate (c) in the coke-oven raw gas at the outlet of the rising pipe were respectively ΔT = −2.939v and c = f(v). The maximum desulfurization wastewater treatment capacity of the 4.3 m single riser was 61.98 kg h−1. The spraying optimization conditions were: spraying position, 3 m from the water seal cap of the riser; spraying amount, 50–55 L h−1; spraying time, from 10 min after the coal loading to less than 20 h during the coking process. An industrial test device for treating 12![[thin space (1/6-em)]](https://www.rsc.org/images/entities/char_2009.gif) 000 tons of desulfurization wastewater was constructed, which then ran normally, with the new technology for treating the high concentration polluted wastewater–desulfurization wastewater formed.
000 tons of desulfurization wastewater was constructed, which then ran normally, with the new technology for treating the high concentration polluted wastewater–desulfurization wastewater formed.
1 Introduction
Coke oven gas and gasification gas desulfurization and purification technology is a very important technology in the coking and coal gasification industry. At present, ammonia HPF wet oxidation desulfurization technology is widely used because of its high desulfurization efficiency and low cost. However, a large amount of desulfurization wastewater is generated during the desulfurization of coke oven gas by ammonia HPF wet oxidation.1,2 This desulfurization wastewater contains COD (>100000 mg L−1), sulfides (>2000 mg L−1), ammonia nitrogen (>20000 mg L−1), and salinity (∼200 g L−1), which is a very harmful pollutant. Much research has been done on trying to find a harmless treatment for this desulfurization wastewater. Fukuzaki Michiyuki et al.3 of Japan concentrated sulfur, ammonium thiocyanate, and ammonium thiosulfate, and decomposed the products in a combustion furnace with combustion gas. By oxidizing SO2 into SO3 to produce concentrated sulfuric acid, they put forward the Compacs method to treat desulfurization wastewater. In the Hirohax method by Ozaki Satoyoshi,4,5 under a temperature of 273–275 °C and 7000–7500 kPa, ammonium salts and sulfur in the desulfurization wastewater were oxidized into ammonium sulfate in the oxidation tower and then sent to an ammonium sulfate section to produce ammonium sulfate. Although these two methods have certain economic benefits, they both also have obvious disadvantages, such as harsh conditions, large investment, and high energy consumption. Based on the principle of a three element phase diagram, Fengmin Li6 considered the desulfurization wastewater to be treated as a NH4CNS–(NH4)2S2O3–H2O system. According to the solubility difference of ammonium thiocyanate and ammonium thiosulfate, the crystallization is carried out step by step, but the exact proportion of ammonium thiocyanate to ammonium thiosulfate in the desulfurization wastewater must be strictly met, and the energy consumption in the production process is high. Further, the purity of the obtained salt was low. Shunxian Zhang et al.7 used the phase diagram of (NH4)2S2O3 and NH4SCN aqueous solution in desulfurization wastewater to study the crystallization and salt extraction from desulfurization wastewater. By evaporating the desulfurization solution into the crystalline region of (NH4)2S2O3, it could be separated into the solid phase, but the difference between the solubility of NH4SCN and (NH4)2S2O3 is relatively small and the separation of the two was difficult, so the purity of the product was not high and the recovery rate was low. Shensheng Zheng et al.8 used a D201 anion exchange resin to exchange SCN− in desulfurization wastewater; the anion exchange resin was then washed with ammonia; finally, the crystallized eluate was concentrated, and the NH4SCN product was obtained. However, there were some limitations with the method, such as the high resin price, small exchange capacity, long time use, and as it was easy to cause resin damage. Na Yin et al.9 integrated a ceramic ultrafiltration membrane, nanofiltration and reverse osmosis membrane to deal with desulfurization wastewater. The results showed that the nanofiltration membrane could effectively separate (NH4)2S2O3 and NH4SCN, whereby the former had a rejection rate of 95%, while the latter was more than 100%, and the total rejection rate of four grade reverse osmosis to NH4SCN was 99%; moreover, the ceramic ultrafiltration membrane could retain 100% of the sulfur in desulfurization wastewater. This method could not only separate the (NH4)2S2O3 and NH4SCN in the sub salt, but also recycle sulfur in the desulfurization wastewater with high efficiency, but it was only laboratory research and needs further study in a production environment. Yunsheng Yan et al.10 used coking desulfurization wastewater mixed into coking coal, followed by cracking and treatment with the high temperature and reducing atmosphere produced by the coal coking process. Without affecting the coke quality, the amount of desulfurization wastewater treated was up to 40–50 t d−1, but there were clear problems with environmental pollution; in particular, leakage and waste liquid penetration often occurred, which affected the workers' working environment and also had hidden dangers of causing water pollution. There are many problems in these existing desulfurization wastewater treatment technologies, such as large investment for equipment, high operating cost, harsh technological conditions, and it being easy to produce secondary pollution.11
In view of the problems in the existing desulfurization wastewater treatment technology, this paper puts forward a new technical scheme involving the pyrolysis treatment of desulfurization wastewater by waste heat from coke-oven raw gas.13–16 The new technology utilizes the high-temperature waste heat (about 750 °C) of the raw gas in the coke oven riser, which takes up about 33.76% of the total waste heat in the process of coking.12 In this paper, a thermal gravity analyzer (TGA92) and the Shanxi coke group's Yixing coking plant's (hereinafter referred to as the Yixing coking plant) 4.3 meter coke oven no. 114 single riser and its additional equipment were used as the pyrolysis device. The pyrolysis characteristics of the mixed salt in the desulfurization wastewater were analyzed by thermogravimetry, and the spraying time and location of the desulfurization wastewater were also recorded. The effects of the spray amount of the desulfurization wastewater on the outlet temperature and on the concentration of ammonium thiocyanate were analyzed, and the amount of the maximum waste liquid in the single riser was determined. Also, the industrial test equipment for treating 12000 tons of desulfurization wastewater in a year was tested to ensure its normal operation and to form a new technology for treating high concentration polluted wastewater, i.e., the desulfurization wastewater.
2 Experimental section
2.1 Reagents and samples
The test reagents mainly included ammonium thiocyanate, ammonium thiosulfate, ammonium sulfate, aluminium oxide, sodium hydroxide (granule), iodine (granular), soluble starch, cadmium chloride, concentrated hydrochloric acid, zinc acetate, potassium iodate, sodium chloride, 5-(4-dimethylaminobenzylidene)rhodanine, and silver nitrate. All the above reagents were analytically pure. The solutions were prepared using deionized water.The desulfurization wastewater used in the experiment was the desulfurization wastewater discharged during the desulfurization of coke-oven raw gas by ammonia HPF wet oxidation in the Yixing coking plant, and the data related to the inorganic components and content came from the production operation's daily reports obtained from the analysis and test center of the plant. Table 1 shows the main inorganic components and their components in the desulfurization wastewater, while Table 2 shows the organic components and their contents in the desulfurization wastewater.
| Waste water sample | 1 | 2 | 3 | Mean value |
|---|---|---|---|---|
| Ammonium thiosulfate g L−1 | 27.31 | 36.41 | 28.82 | 30.85 |
| Ammonium thiocyanate g L−1 | 132.55 | 137.94 | 130.24 | 133.58 |
| Suspended sulfur g L−1 | 0.01 | 0.07 | 0.06 | 0.05 |
| PDS (ppm) | 67.16 | 76.24 | 62.68 | 68.69 |
| Free ammonia g L−1 | 9.16 | 7.93 | 8.04 | 8.38 |
| pH | 8.51 | 8.34 | 8.30 | 8.38 |
| Peak time (min) | Component | Content (%) | Matching rate (%) | Boiling point (°C) |
|---|---|---|---|---|
| 2.41 | 2,4-Dipentadinitrile | 3.88 | — | — |
| 2.92 | 4-Picoline | 0.12 | 144.9 | 93.13 |
| 2.99 | Dichloromethane | 0.36 | 39.8 | 85.00 |
| 3.13 | 4-Benzyl 2-chlorobenzaldehyde | 0.32 | — | — |
| 3.37 | 2-Methylpyridine | 0.26 | 129.5 | 93.13 |
| 4.10 | Phenol | 41.3 | 182 | 94.11 |
| 4.69 | 2-Cresol | 9.24 | 190.8 | 108.13 |
| 4.87 | 3-Cresol | 29.15 | 202.8 | 108.13 |
| 5.45 | 2,4-Dimethyl phenol | 3.77 | 211–212 | 122.16 |
| 5.68 | 2,3-Dimethyl phenol | 3.79 | 227 | 122.16 |
| 6.17 | Isoquinoline | 4.70 | 242–243 | 129.16 |
| 6.46 | Quinoline | 0.69 | 113–114 | 129.16 |
| 6.68 | Indole | 1.69 | 253–254 | 117.15 |
| 7.01 | 4-Bromine, 2-chlorine, aniline | 0.06 | — | — |
| 8.17 | 3,3-Propane nitrile | 0.20 | — | — |
| 8.19 | 1,5-Cyclocenediene (E, Z) | 0.12 | — | — |
| 8.26 | 5-Kwai acetylene | 0.22 | — | — |
| 10.08 | Carbazole | 0.11 | 355 | 167.21 |
2.2 Experimental installation
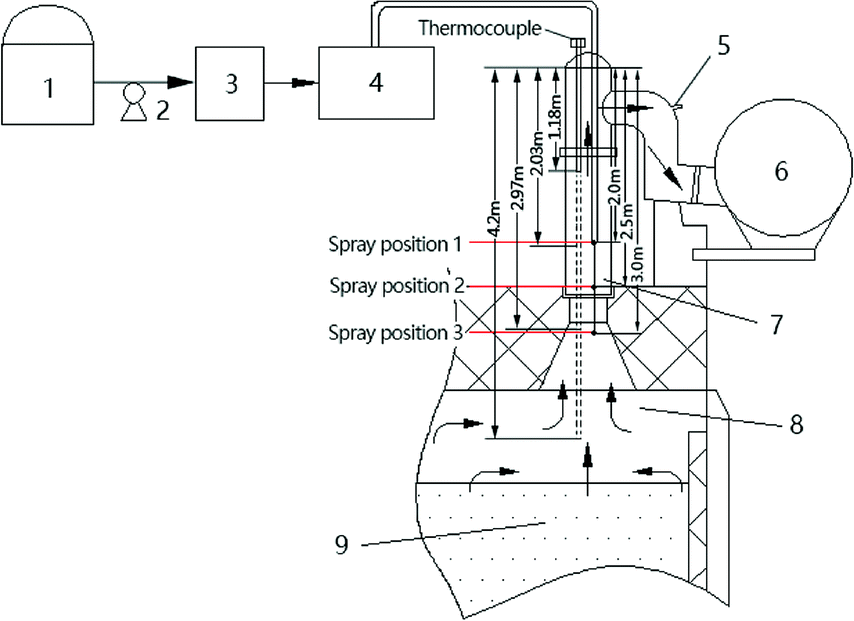 | ||
| Fig. 1 Experimental devices: (1) sample tank, (2) pressure pump, (3) filter, (4) pressure and flow control, (5) sampling point, (6) gas collector, (7) riser, (8) coke oven carbonization chamber – top space high-temperature waste gas entrance, (9) carbonization chamber. | ||
2.3 Analysis and detection
In the experiment, samples of the coke-oven raw gas collected at the bridge pipe were analyzed and tested.Spectrophotometry was used to measure the content of ammonium thiocyanate.17 A 723N-type visible spectrophotometer with the wavelength range of 325–1000 nm and a wavelength accuracy of ±1 nm was utilized. The content of ammonium thiocyanate was measured based on the good linear relationship between the absorbance of the red complex formed by SCN− and Fe3+ and the concentration of SCN− in a certain range.
The content of hydrogen cyanide was measured by silver nitrate titration.18 The sample was titrated with a silver nitrate standard solution. Then, soluble silver cyanide complex ions [Ag(CN)2]− were formed by the reaction between cyanide ions and silver nitrate. The reaction end point was when the solution turned from yellow to orange as a result of the reaction between excessive silver ions and the p-dimethylaminobenzalrhodanine indicator.
The hydrogen content was measured by iodometry.19,20 Alkali liquid at a certain of pH was used to absorb the H2S and to measure the content of the sulfide of the water sample through the conversion method by iodometry.
3 Results and discussion
3.1 Pyrolysis characteristics of the mixed salt in desulfurization wastewater
The solid mixed salt of desulfurization wastewater obtained by evaporative drying is mainly composed of ammonium thiosulfate, ammonium thiocyanate, ammonium sulfate, hydroquinone, suspended sulfur, and the catalyst PDS.21 Thermogravimetric analysis of the solid mixed salt in a simulated coke oven gas atmosphere (55% H2 + 6% CO + 25% CH4 + 14% Ar) was carried out. The analysis results are shown in Fig. 2. The curve shows that the pyrolysis behavior of the solid mixed salt with high contents of ammonium thiosulfate, ammonium thiocyanate, and ammonium sulfate affects the pyrolysis behavior of solid mixed salts.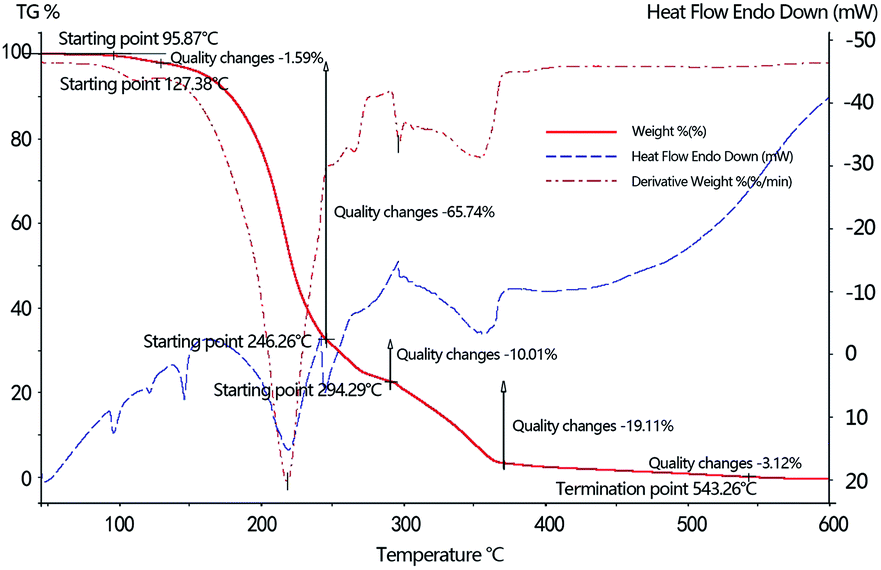 | ||
| Fig. 2 Thermogravimetric analysis of solid mixed salts of desulfurization wastewater obtained by evaporation drying in a simulated atmosphere of coke oven gas. | ||
It can be seen from the diagram that the pyrolysis process of the solid mixed salt of desulfurization wastewater obtained by evaporation drying in the simulated coke oven gas (55% H2 + 6% CO + 25% CH4 + 14% Ar) could be divided into five stages, which occur at 95.87–127.38 °C, 127.38–246.26 °C, 246.26–290.45 °C, 294.29–375.15 °C, and 375.15–543.26 °C, respectively. The corresponding mass loss was 1.59%, 65.74%, 10.01%, 19.11%, and 3.12%, respectively, and the accumulated weight loss was 99.57%, and the decomposition of the mixed salt was completed.
According to TG-DTG-DS analysis, there are two endothermic peaks in the first stage at 95.87–127.38 °C, appearing at 95.30 °C and 120.25 °C, respectively, belonging to the crystalline transition of ammonium thiocyanate,22 the transformation of monoclinic crystal to the orthogonal crystal, and the transition from the orthogonal crystal to the orthotropic phase; the second stage of mixed salt pyrolysis also contains two peaks at 127.38–246.26 °C, corresponding to the endothermic peaks at 145.49 °C and 218.33 °C, respectively. The former relates to the isomerization of ammonium thiocyanate to thiourea,27 while the latter is the thermal decomposition peak of ammonium thiosulfate. The third phase of the pyrolysis of the mixed salt corresponds to the endothermic peak at the position of 244.05 °C, which relates to the co-pyrolysis of ammonium thiocyanate and ammonium thiosulfate. At this stage, the ammonium sulfate shows almost no decomposition, while the pyrolysis of ammonium thiocyanate is basically completed, and the main pyrolysis products include HNCS, H2S, NH3, and CS2. The fourth and fifth stages of the mixed salt pyrolysis are mainly attributed to the decomposition of ammonium thiosulfate and ammonium sulfate. The production products mainly include NH3, H2O, SO2 and some N2, and at the end of the fourth stage (375 °C), the weightlessness of the desulfurization wastewater is 96.87%. With the increase in pyrolysis temperature, other components and some organic compounds in the mixed salt were pyrolyzed and volatilized, and the total weight loss of pyrolysis reached 99.57% at the final temperature of 540 °C. Compared with the experiment involving the pyrolyzation of the desulfurization wastewater under an argon environment carried out by Shuting Zhang et al.27 and others, the temperatures required by the salt-mixture to begin and complete pyrolyzation were both lower than the temperature required by the pyrolyzation under the argon environment, and furthermore, the pyrolyzation was more thorough. The main pyrolysis equations of desulfurization wastewater solid mixed salts under simulated coke oven gas atmosphere are as follows.
| 4NH4CNS + 12H2 = 2H2S + 8NH3 + CS2 + 3CH4 |
| (NH4)2S2O3 + 4H2 = 2H2S + 2NH3 + 3H2O |
| (NH4)2SO4 = NH4HSO4 + NH3↑ |
| 2NH4HSO4 = (NH4)2S2O7 + H2O↑ |
| 3(NH4)2S2O7 = 2NH3↑ + 2N2↑ + 6SO2↑ + 9H2O↑ |
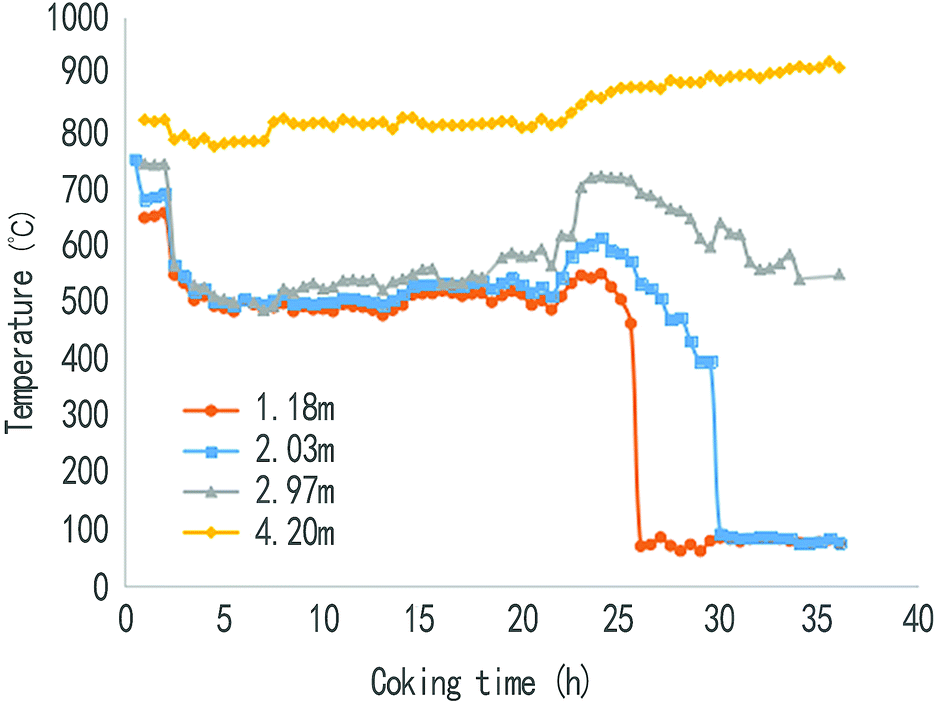
3.2 The influence of coking time on the temperature distribution of the riser
A different thermocouples with a length of 4.2 m, 2.97 m, 2.03 m, or 1.18 m was inserted into the rising pipe from the top of the water seal at the top of the riser, as shown in Fig. 1. A temperature distribution curve of the riser at different coking times (Fig. 3) was formed through measurement of the temperatures at all points of the single riser at different coking times.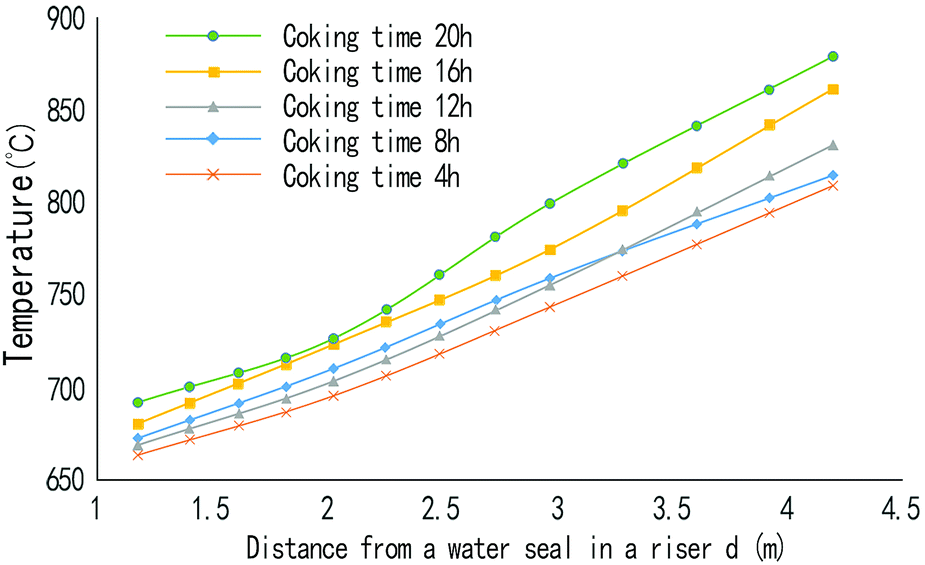 | ||
| Fig. 3 Temperature distribution curve of the riser at different coking times. | ||
From Fig. 3, we can see that the farther from the water seal cap on the top of the riser, the higher the temperature in the riser is; that is, the temperature in the riser increases with the decrease in the location. With the increase in coking time, the temperature in the riser will also increase, and the temperature difference between the top and bottom of the riser will also increase.
3.3 Optimization of the spraying time and its effect on H2S and HCN contents in coke-oven raw gas
Fig. 4 and 5 show that the changing law of the coke temperature at different heights in the rising pipe before and after spraying. It can be seen from Fig. 4 that in the whole coking period, the temperature at 4.2 m and 2.97 m from the top of the water seal in the rising pipe was basically stable, albeit showing a tendency to rise gradually, and the temperature was reduced slightly only after the coking time reached 25 h. However, the temperature at 2.03 m and 1.18 m from the water seal cap began to decrease when the coking time was 20 h, and then the temperature dropped rapidly when the coking time was about 22 h. This was mainly because the temperature in the riser was mainly supplied by the heat from the coke-oven raw gas. At the end of the carbonization, with the completion of the coking process, the amount of gas is gradually reduced, and the heat of the raw gas is then greatly reduced. In the riser near the carbonization chamber, the heat is supplied by the heat discharged from the raw gas, while the thermal radiation of the carbonization chamber wall also provides some heat.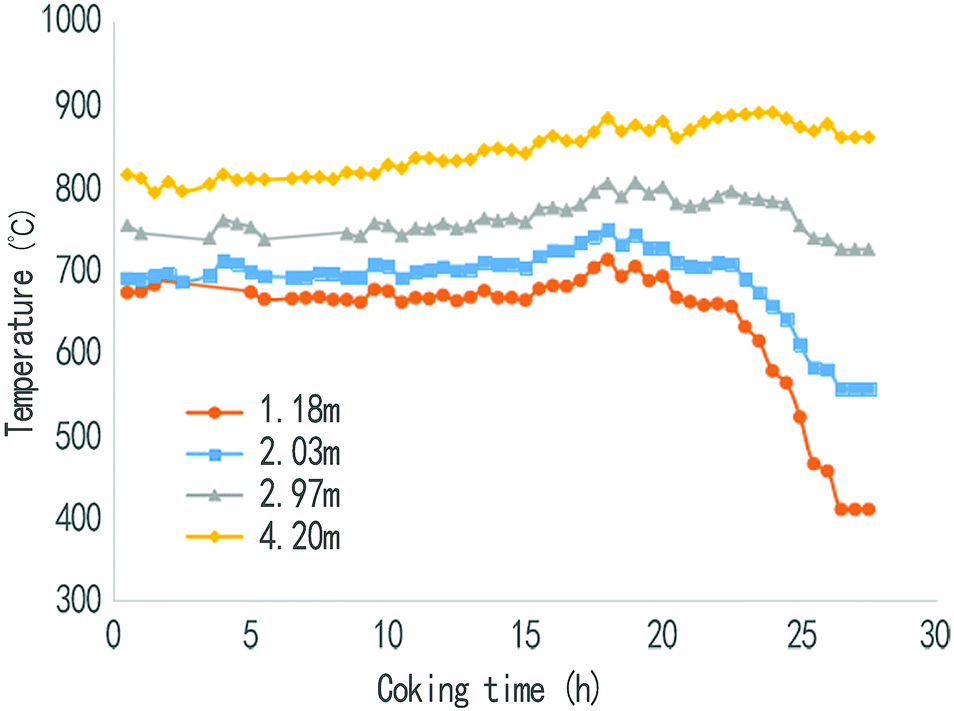 | ||
| Fig. 4 Variation of the temperature in the riser before spraying. | ||
 | ||
| Fig. 5 Variation of the temperature in the riser after spraying. | ||
As can be seen from Fig. 5, the desulfurization wastewater is sprayed after 10 min of coal loading, and then within the beginning of the sprayed 20 h, the temperature at 1.18 m, 2.03 m, and 2.97 m from the water seal cap begins to decrease continuously from a coking time of 2 h, from an average temperature of 700 °C to 500 °C, and then stabilizes in the range of 480–530 °C. The temperature at the 4.2 m point from the water seal cap was maintained at about 800 °C, and then the temperature gradually rises, which is basically the same as that of the no substance case (waste liquid or steam). This shows that the desulfurization wastewater after atomization was completely pyrolyzed before reaching the position of 4.2 m, and it also shows that any desulfurization wastewater that is injected in will not affect the furnace wall and coke in the carbonization room. In the position of 1.18 m to 2.97 m, the temperature in the riser was stable at 480–530 °C, which ensures the high efficiency pyrolysis of the waste liquid and ensures that the tar is not condensed before the bridge is entered. But when the coking time was 22 h, with the decrease in gas production, the amount of heat carried was greatly reduced, and the temperature of the coke-oven raw gas dropped rapidly when the desulfurization wastewater was sprayed in the riser. After 25 h of coking, since the pyrolysis of coking basically ends, the output of the coke-oven raw gases and the heat quantity of the gases largely decrease, which result in a sharp temperature fall at the points 1.18 m and 2.03 m away from the water sealed cover. The influence of the thermal radiation of the walls of carbonization chamber is larger when the distance away from the water sealed cover is longer. The place 2.97 m away from the cover is less influenced by the heat resulting from the coal gases, therefore the temperature fall is smaller. Also, the place 4.2 m away from the cover basically feels no influence. This shows that the spraying position of the desulfurization wastewater should be chosen as close as possible to the top space of the carbonization chamber, and spraying in the late coking period should be avoided. The spraying time should be controlled within 20 h of the coking process, and the temperature of the riser should be no less than 450 °C.
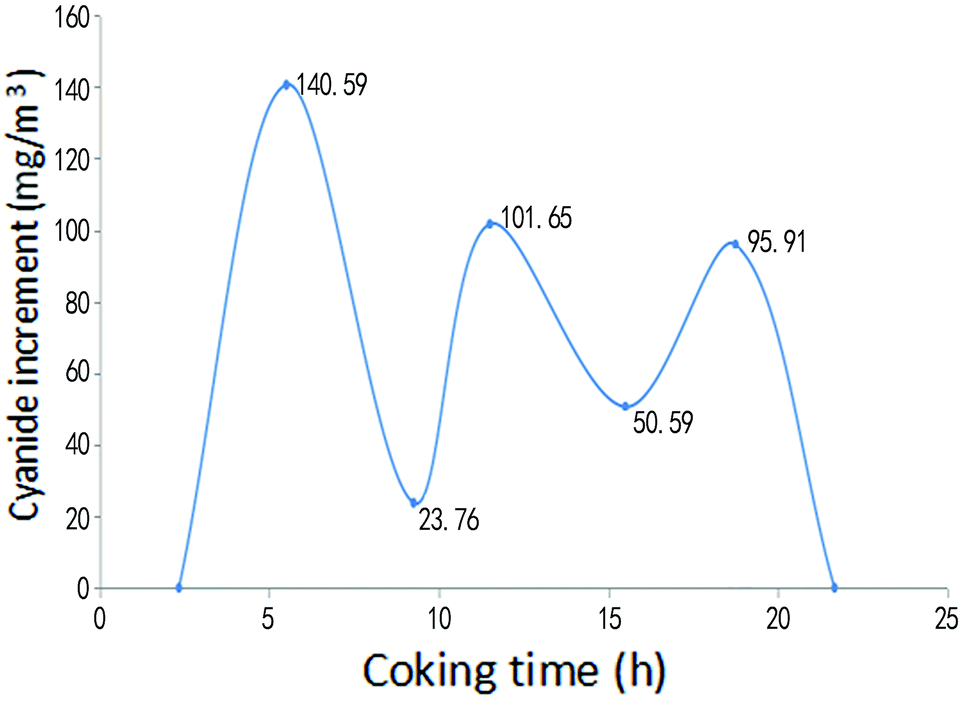
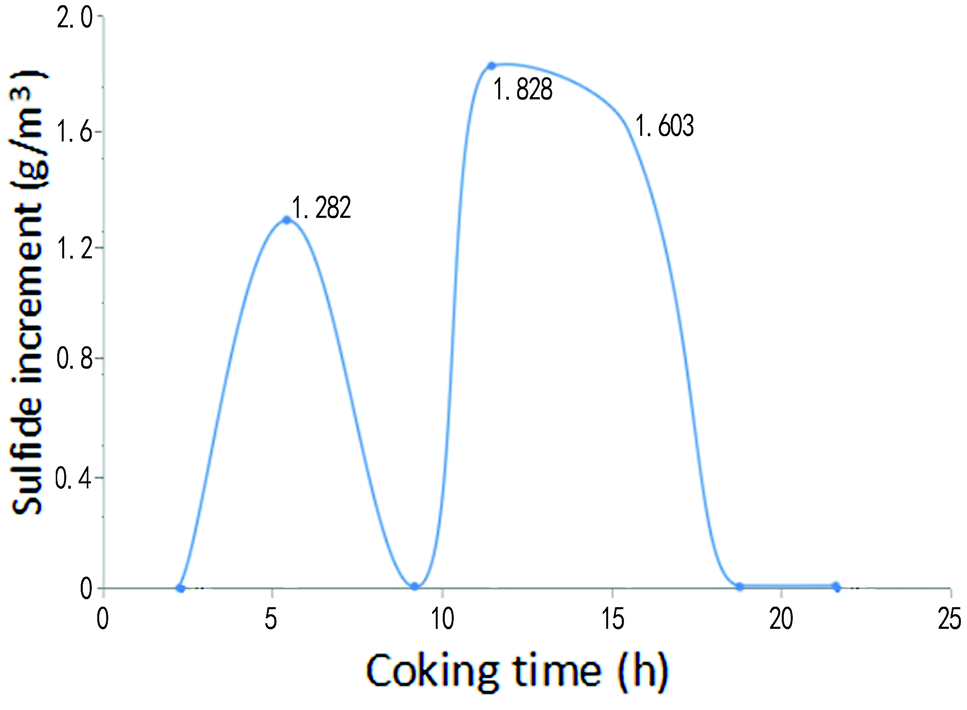
Fig. 6 and Fig. 7 give the changes of hydrogen sulfide and hydrogen cyanide content in the coke-oven raw gas at the bridge pipe before and after pyrolysis of the desulfurization wastewater in the above spraying time period. As can be seen from Fig. 6 and 7, within the spraying time of 21.67 h, the content of hydrogen sulfide and hydrogen cyanide in the coke-oven raw gas was increased after pyrolysis of the desulfurization wastewater in the riser, where the content of hydrogen cyanide increased by an average of 58.9286 mg m−3 and the content of hydrogen sulfide increased on average by 0.6732 g m−3. It was estimated that the hydrogen cyanide and hydrogen sulfide in the total amount of gas increased by 8.42 mg m−3 and 96.17 mg m−3 respectively by installing the desulfurization wastewater pyrolytic device on the 1/7 riser pipes in the whole plant. However, for the content of hydrogen cyanide 1–2.5 g m−3 and hydrogen sulfide from 6–30 g m−3 in the normal coke-oven raw gas,23 the increase of hydrogen cyanide and hydrogen sulfide was about 0.5894% and 0.9617% of the content before spraying, which is negligible and can be ignored. The high-temperature pyrolytic cracking adopted by Yubing Cao et al.28 to treat the desulfurization wastewater has the disadvantage of causing an increase in the content of H2S and thus increasing the load of the desulfuration. Using a pyrolysis method that uses the waste heat of the coke-oven raw gas to spray desulfuration wastewater during the optimized spraying time has little influence on the contents of the hydrogen cyanides and hydrogen sulfides in the gas.
 | ||
| Fig. 6 Changes of hydrogen cyanide content in the gas before and after pyrolysis of the desulfurization wastewater. | ||
 | ||
| Fig. 7 Variation of the hydrogen sulfide content in the gas before and after pyrolysis of the desulfurization wastewater. | ||
3.4 Effect of spraying location on the ammonium thiocyanate content of coke-oven raw gas in the riser outlet
The length of the sprinkler tube was increased in turn, from 2.0 m, to 2.5 m and 3.0 m distance from the top of the water seal cap at the top of the riser, respectively (Fig. 1). Under the spraying pressure of 1 MPa, 66–103 L h−1 desulfurization wastewater was sprayed into the riser, and the ammonium thiocyanate in the coke-oven raw gas was measured by sampling at the bridge tube, while the concentration of ammonium thiocyanate in the waste liquid used for spraying was 109.76 g L−1. The conditions and results of the pyrolysis test of the desulfurization wastewater at different spraying positions of the riser are shown in Table 3.| Distance from the top of the water seal at the top of the riser (m) | Coking time (h) | Spray amount (L h−1) | Concentration of ammonium thiocyanate at export (mg m−3) |
|---|---|---|---|
| 2.0 | 8.50 | 66 | 18.60 |
| 9.00 | 67 | 27.00 | |
| 2.5 | 8.00 | 66 | 6.60 |
| 11.70 | 71 | 4.80 | |
| 3.0 | 8.15 | 103 | 1.85 |
| 9.00 | 82 | 0.00 |
From Table 3, we can see that the concentration of ammonium thiocyanate decreased as the spraying position gradually moved down. When the same coking time was about 8 h, the spray was sprinkled at a distance of 2.0 m from the top of the water seal cap at the top of the riser, and the amount of the spray was 66 L h−1 and the concentration of ammonium thiocyanate after decomposition was up to 18.6 mg m−3; alternatively the spray at a distance of 2.5 m from the top of the water seal at the top of the riser was 66 L h−1, and the concentration of the exportation of ammonium thiocyanate was only 6.6 mg m−3, while when spraying at a distance of 3.0 m from the top of the water seal cap at the top of the riser, the spray amount was increased to 82 L h−1, but ammonium thiocyanate was not detected at the sampling site of the bridge. The cause of the decomposition is related to the temperature of the coke-oven raw gas in the riser and the residence time of the waste liquid: on the one hand, as the spraying position moves down, the temperature of the gas is increased gradually; while on the other hand, the removal of the spray position also prolongs the retention time of the desulfurization wastewater in the high-temperature coke-oven raw gas. These two functions promoted the pyrolysis of desulfurization wastewater. It can be seen that the optimal location of the desulfurization wastewater in the riser was 3 m from the top of the water seal cap at the top of the riser.
3.5 Influence of the spraying amount on the temperature at the gas outlet and calculation of the maximum desulfurization wastewater handling capacity of the single riser
Fig. 8 shows the effect of the amount of desulfurization wastewater spray on the outlet temperature of the rising gas. As shown in the picture, the gas outlet temperature decreases with the increase in the spray amount of the desulfurization wastewater. When the spray amount was 40 L h−1, the gas outlet temperature was only 76.4 °C, down compared with the pre spray temperature. With the increase of the spray amount, the gas outlet temperature gradually decreased. When the spray amount was 96 L h−1, the outlet temperature of the gas was 450 °C; whereas when the temperature of the coke-oven raw gas was below 450 °C, tar can precipitate, causing blockage of the riser and so on.24 The spraying amount was therefore controlled within 95 L h−1, and the waste heat of raw gas in riser causes the desulfurization wastewater to evaporate and pyrolyze.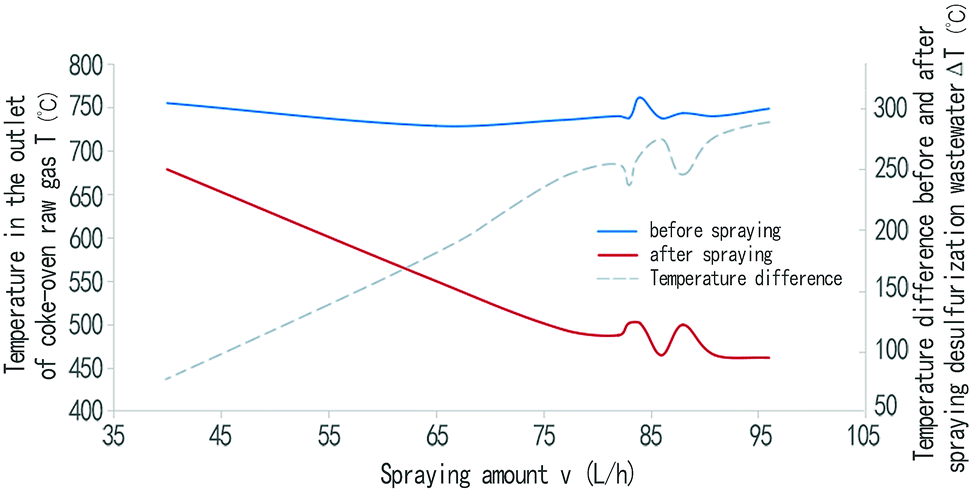 | ||
| Fig. 8 Influence of the spraying amount of desulfurization wastewater on the outlet temperature of coke-oven raw gas in riser. | ||
From Fig. 8, it can also be seen that the temperature difference (ΔT) between before and after the spray desulfurization wastewater is directly proportional to the spray amount (v); that is, the greater the amount of desulfurization wastewater sprayed, the faster the temperature is reduced. This is because the desulfurization wastewater is vaporized and dried in the form of fog droplets sprayed into the rising pipe of coke-oven raw gas. NH4SCN and NH4S2O3 in the waste liquid will be pyrolyzed. These processes are endothermic processes, making the temperature of the riser gas go down.
The data processing showed that the relationship between the temperature difference (ΔT) before and after the desulfurization wastewater was sprayed and the spray amount (v) can be described in the following way:
| ΔT = −2.939v |
| T2 = T1 + ΔT = T1 − 2.939v |
With 1 ton of dry coal pyrolysis was used as the benchmark, the temperature of the raw gas was reduced from 750 °C to 500 °C, and the total heat released during the cooling process includes: the explicit heat released from the raw gas, the explicit heat released from the tar, the explicit heat from the release of water vapor, the explicit heat of the release of benzene hydrocarbon, the explicit heat of the release of ammonia, and the release of hydrogen sulfide, for a total figure of 229737.73 kJ. The 1 ton of dry coal corresponds to the desulfurization wastewater generated by pyrolysis treatment of about 0.0077 t. The amount of heat absorbed by the decomposition of the desulfurization wastewater includes: the heat absorption of water, latent heat of water vaporization, heat absorption of steam heating, heat absorption of ammonium thiocyanate, heat absorption of ammonium thiocyanate decomposition, heat absorption of ammonium thiosulfate, heat absorption of ammonium thiosulfate decomposition, heat absorption of ammonium sulfate, and heat absorption of ammonium sulfate decomposition, and all the above needs to absorb the heat of 26688.33 kJ. According to the calculation, based on the 1 ton dry coal, the high-temperature gas produced in the process of dry distillation is calculated to be 15% of the heat loss in the rising pipe. The heat released from the temperature from 750 °C to 500 °C can decompose about 2.45 kg h−1 desulfurization wastewater. For a 4.3 m coke oven, the single hole carbonization chamber loading 23 tons, for a coking time of 22 h, can spray desulfurization wastewater for 20 h (little gas produced in the late coking, stop spraying), so that the maximum waste liquid of a single riser in a 4.3 m coke oven is 61.98 kg h−1.
3.6 Effect of the spraying amount on the ammonium thiocyanate content of coke-oven raw gas in the riser outlet
In the experiment, the best spraying location 3 (Fig. 1) was selected as the spraying point, and the relationship between the amount of spraying and the concentration of ammonium thiocyanate in the coke-oven raw gas outlet was measured (Fig. 9). It can be seen from the diagram that ammonium thiocyanate can be effectively decomposed when the spray amount is below 84 L h−1, and ammonium thiocyanate is not detected in the outlet gas. When the spray amount increases from 84 L h−1, the ammonium thiocyanate is detected in the coke-oven raw gas after the pyrolysis. When the spray amount is 86–96 L h−1, the concentration increases from 1.85 mg m−3 to 7.4 mg m−3. From this, we can get the equation between the concentration of ammonium thiocyanate (c) and the spray amount (v):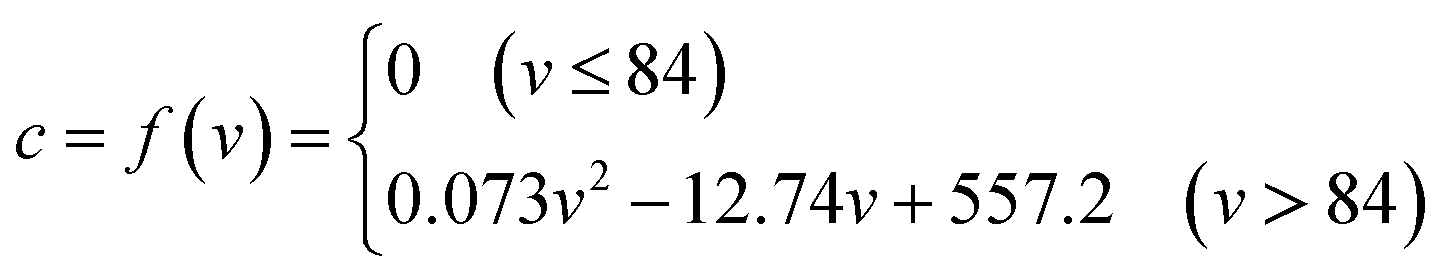
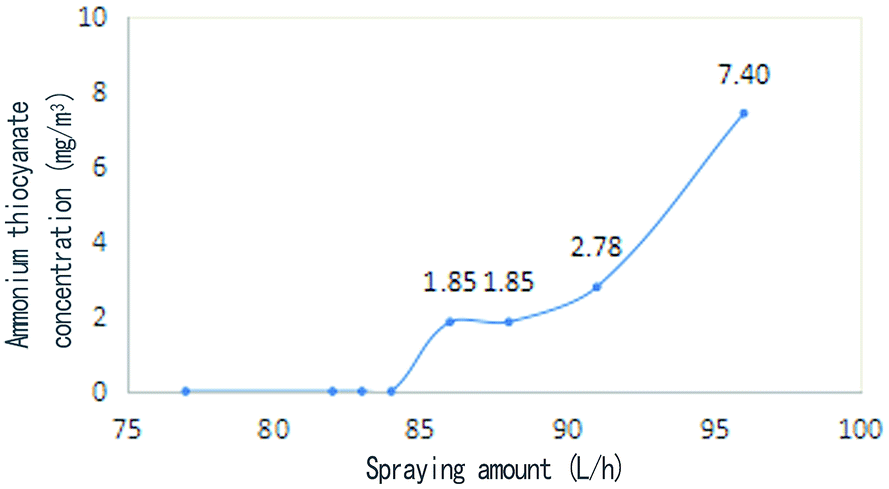 | ||
| Fig. 9 Relationship between the spraying quantity and ammonium thiocyanate concentration at the coke-oven raw gas outlet. | ||
Therefore, when the desulfurization wastewater is sprayed, the spray amount should be controlled between 50–55 L h−1 and no more than the maximum amount of waste liquid of 61.98 kg h−1, to ensure complete pyrolysis of the desulfurization wastewater.
3.7 Main process of pyrolysis desulfurization wastewater by coke-oven raw gas in the riser and the influence of pyrolysis products on the ammonia distilled wastewater and coke
Based on the above research, the main chemical treatment process of pyrolysis desulfurization wastewater by waste heat from the coke-oven raw gas in riser is shown in Fig. 10. An industrial test system of 12000 tons of desulfurization wastewater was established in the Yixing coking plant according to the process in Fig. 10. In this system, the desulfurization wastewater produced by the desulfurization section is filtered and pressurized to 0.7–1.0 MPa, and then pretreated by preheating, after the controller and the ejector; then it is sprayed into the high-temperature coke-oven raw gas in the riser, and the spray droplets are mixed with the high temperature 750–850 °C raw gas countercurrent. After the droplets of the waste liquid are heated by heat exchange, evaporation, and drying, the substances such as NH4SCN, (NH4)2S2O3, and (NH4)2SO4 begin to pyrolyze. When the temperature reaches 375 °C, gases such as H2S, NH3, and N2 produced by decomposition are all released. The pyrolysis products and vaporized water vapor of the desulfurization wastewater with the high-temperature coke-oven raw gas in the riser are cooled with high-pressure ammonia water sprayed from the ammonia spray nozzle in the bridge tube (to 80 °C). The cooled mixture passes through a gas collecting tube, and the liquid mixture is separated after entering the gas–liquid separator, the primary condenser, the air blower, and the electric tar precipitator, and then enters the ammonia water–tar separator. The ammonia water becomes the circulating ammonia water and residual ammonia water after being separated from the tar. The circulating ammonia water is pumped into the bridge tube for cycled use and the residual ammonia water is treated by the ammonia distillation process; the decomposition of the H2S and NH3 and other substances, except for a small part, go into the residual ammonia or circulating ammonia water, while most of the gas together with the coke-oven raw gas goes into the subsequent purification section. H2S is mainly recovered in the form of sulfur in the process of desulfurization, while NH3 is recovered in the form of ammonium sulfate or ammonia in the ammonium sulfate section or the water washing section. After the separation of ammonia tar, the organic tar substance is recovered in tar form in a tar ship.
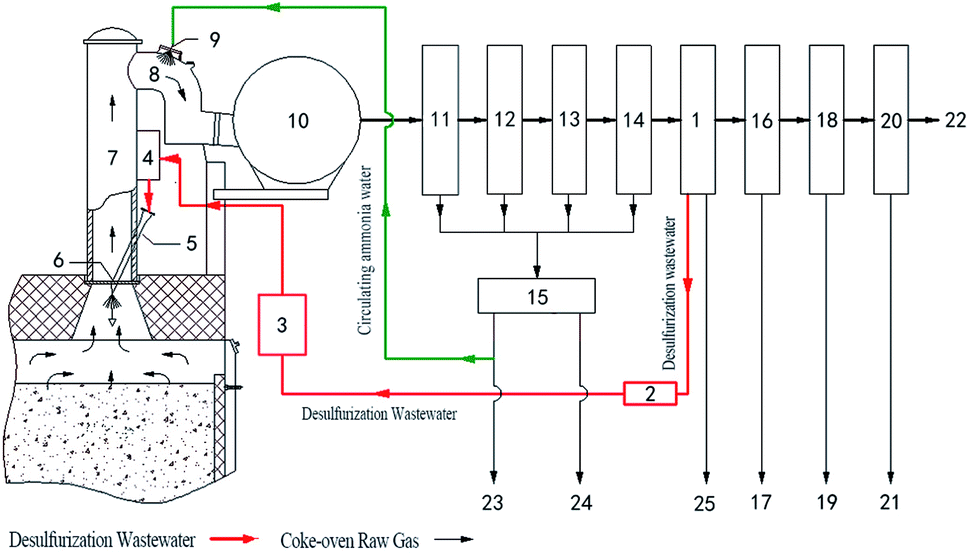 | ||
| Fig. 10 Process of pyrolysis of desulfurization wastewater by waste heat from the coke-oven raw gas in the riser in coking plant chemical production and the recovery process system: (1) desulfurization section, (2) filter, (3) pressure, (4) preheater, (5) controller, (6) desulfurization wastewater ejector, (7) riser, (8) bridge pipe, (9) ammonia water jet, (10) gas collector, (11) gas–liquid separator, (12) primary condenser, (13) air blower, (14) electric tar precipitator, (15) sulfur, (16) ammonia removal, (17) ammonium sulfate, (18) naphthalene removing purification, (19) crude naphthalene, (20) benzene removal, (21) crude benzene, (22) net gas, (23) residual ammonia water vapor ammonia, (24) tar, (25) sulfur. | ||
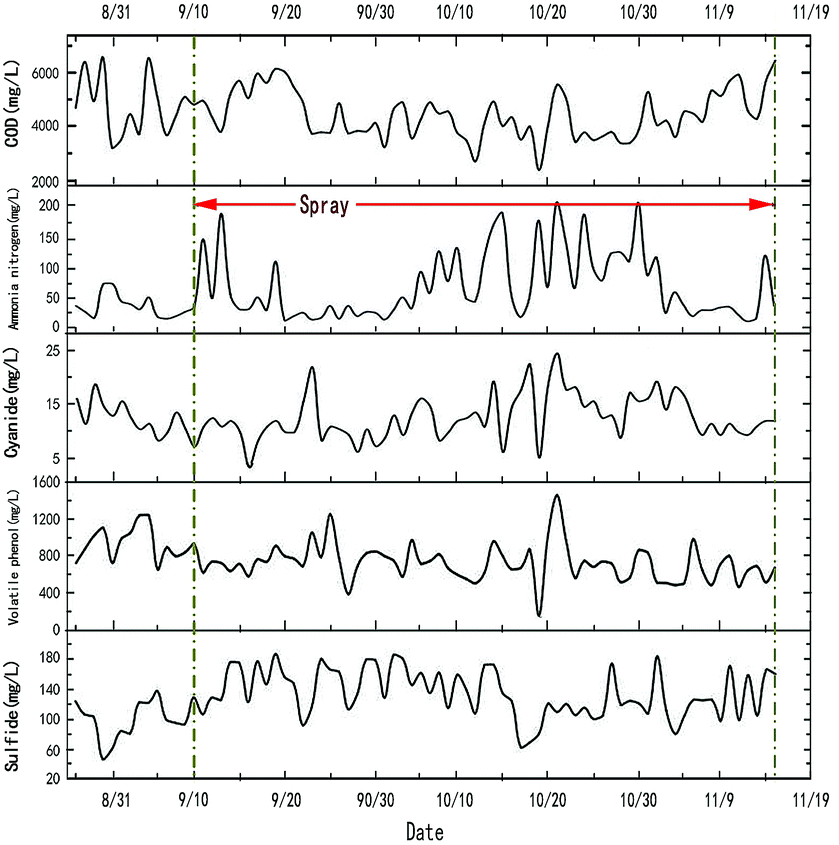
In the process of the pyrolysis of desulfurization wastewater by waste heat from the coke-oven raw gas in the riser, the main products that may be affected are ammonia distilled wastewater and coke. Fig. 11 shows the change curve of the ammonia distilled wastewater from August 26th to November 15th. It can be seen from the figure that the content of ammonia nitrogen and sulfide is increased by about 95.66% and 35.42%, while the other components are not much affected. This is caused by the decomposed water and the small part of the H2S, NH3, and other substances that entered into the residual ammonia or the circulating ammonia water, and then the steam and ammonia with the residual ammonia into the ammonia distilled wastewater. At present, coking enterprises can reduce ammonia nitrogen and sulfide by adjusting the biochemical treatment methods, so that ammonia distilled wastewater can meet discharge standards.25 A process of the deep treatment of ammonia distilled wastewater by the process of manganese catalytic oxidation is being developed. The experiment has proved that the reduction of ammonia nitrogen and sulfide by this method is very obvious. Further relevant articles will be published later about this study.
 | ||
| Fig. 11 Index change curve of ammonia distilled wastewater. | ||
Fig. 12 shows the change curve of the coke index from February 2nd to April 25th. From Fig. 12, during the stage of spraying desulfurization wastewater (March 21st to April 25th), the desulfurization wastewater was completely pyrolyzed in the first 21 days (March 21st to April 10th), and there was little effect on the quality of coke. (The sulfur content in coke increased during the period from April 10th to April 25th, which was caused by the adjustment of coal blending and the increased sulfur content.) In the past, Yunsheng Yan,10 Yubing Cao,28 and others adopted the method of blending coal for coking to treat the desulfuration wastewater, but some sulfur would be left in the coke, which would result in an increase in the sulfur content in the coke. But the sulfides can be completely pyrolyzed before entering the coke when using the waste heat of the coke-oven raw gas to pyrolyze the desulfuration wastewater. The coke quality will not be influenced.
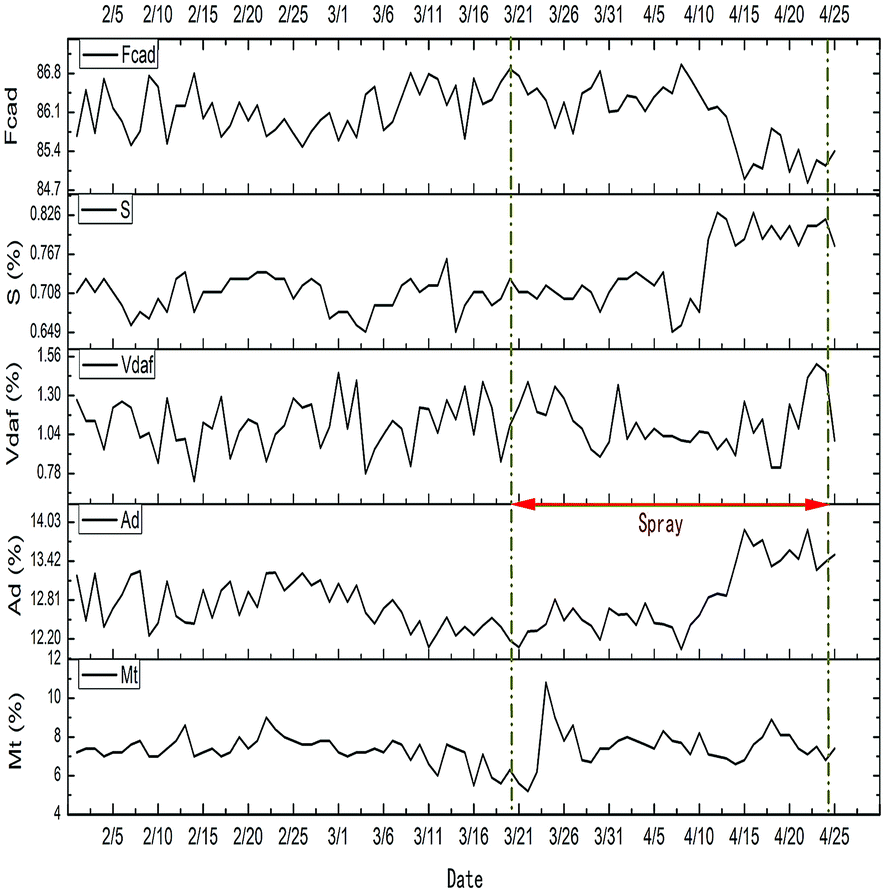 | ||
| Fig. 12 Change curve of coke index of the belt. | ||
4 Conclusions
(1) The pyrolysis process of the solid mixed salt of desulfurization wastewater obtained by evaporation drying could be divided into five main stages in the simulated coke oven gas atmosphere (55% H2 + 6% CO + 25% CH4 + 14% Ar). At the temperature of 95.87–127.38 °C, the crystalline transformation of ammonium thiocyanate occurs, the monoclinic crystal is transformed into orthogonal crystal and the transformation of the orthogonal crystal to the orthotropic phase; the isomerization of ammonium thiocyanate to thiourea and the thermal decomposition of ammonium thiosulfate occurred at 127.38–246.26 °C; the co-pyrolysis of ammonium thiocyanate and ammonium thiosulfate was performed at 246.26–290.45 °C; the decomposition of ammonium thiosulfate and ammonium sulfate mainly occurred at 294.29–375.15 °C and 375.15–543.26 °C. The cumulative weight loss reached 99.57% at the final temperature of 540 °C.(2) The optimum conditions for the sprays of the riser were as follows: a spraying position 3 m from the water seal cap of the riser, a spraying amount of 50 L h−1-55 L h−1, and a spraying time less than 20 h after the coal loading and 10 min to the coking process. Under the above spraying conditions, the temperature of the riser was not less than 450 °C. The desulfurization wastewater injected into the riser will not have a negative effect on the temperature of the carbonization chamber, the furnace wall, or the smooth export of the gas in riser.
(3) In the single riser, when the spray amount of desulfurization wastewater was 40–96 L h−1, the temperature of the riser was reduced by 76–287 °C, and the relationship between the spraying amount (v) and temperature difference (ΔT) was ΔT = −2.939v. The relationship between the spraying amount (v) and the concentration of ammonium thiocyanate (c) at the outlet of the high-temperature raw gas was c = f(v), and the maximum desulfurization wastewater treatment volume of the 4.3 m single riser was 61.98 kg h−1.
(4) Based on the single riser system research, an industrial test system for treating 12000 tons of desulfurization wastewater has been built. When the system is running normally, it has no effect on the coke oven body and coke quality. Although the ammonia nitrogen and sulfide content in the ammonia distilled wastewater is increased during the operation of the system, the export wastewater can reach the relevant emission standard by adjusting the biochemical process operation.
Conflicts of interest
There are no conflicts to declare.Acknowledgements
This research was supported by Coal Based Key Program of the Scientific and Technological Project of Shanxi Province, China (2014), Technology Development and Engineering Demonstration of Coke Oven Gas Desulfurization Wastewater Resource Utilization (MJH2014-09) and Taiyuan University of Technology Youth Fund (2015QN093).Notes and references
- Z. G. Zhang and X. J. Bao, et al., The seventh (2009) China Iron and steel annual conference, 2009, pp. 179–184 Search PubMed.
- J. J. Li, F. Zhou, X. D. Tang, T. Hu and J. Cheng, RSC Adv., 2016, 6, 4803–4809 RSC.
- F. Michiyuki, CEER, Chem. Econ. Eng. Rev., 1977, 9(1), 26–32 Search PubMed.
- O. Satoyoshi, McMaster Symp. Iron Steelmaking, [Proc.], 1977, 5, 1–21 Search PubMed.
- A. Bhattacharyya, Ironmaking Conf. Proc., 1987, 46, 51–57 Search PubMed.
- F. M. Li, Fuel and Chemical Industry, 2001, 32(1), 33–34 Search PubMed.
- S. X. Zhang, Fuel and Chemical Industry, 2011, 42(3), 63 Search PubMed.
- S. S. Zheng, X. H. Zhou and X. Chen, Chemical Industry and Engineering Technology, 2007, 28(4), 12–15 Search PubMed.
- N. Yin, F. Liu and W. H. Xing, Membr. Sci. Technol., 2010, 30(6), 75–78 Search PubMed.
- Y. S. Yan, X. Z. Jia and H. Q. Shi, Science & Technology of Baotou Steel Corporation, 2009, 35(3), 69–71 Search PubMed.
- B. Hu, Y. Yi, C. M. Yang, L. N. Zhang and L. R. Yang, RSC Adv., 2016, 6, 113703–113711 RSC.
- X. C. Cao, L. Y. Cheng and Y. M. Liu, Metallurgical Energy, 2017,(1), 11–13 Search PubMed.
- Y. F. Zhang, G. Q. Li, L. R. Jing, M. Zhang and W. Q. Chen, CN Pat., CN103571503A, 2014.
- Y. F. Zhang, G. Q. Li and X. K. Ding, CN Pat., CN203683454U, 2014.
- G. Q. Li, L. Chen, L. R. Jing, Y. L. Shi, H. Y. Li, Y. F. Zhang and Y. L. Sun, CN Pat., CN103571505A, 2014.
- Y. F. Zhang, G. Q. Li, R. J. Jing, Y. L. Shi, L. Wang, Y. Z. Wang and W. Q. Chen, CN Pat., CN103588339A, 2014.
- G. Q. Li, Z. Z. Li and Y. L. Shi, et al., Ind. Water Treat., 2013, 33(9), 10–15 Search PubMed.
- S. D. Wu, Water and wastewater monitoring and analysis methods, China Environmental Science Press, 4th edn, 2002, pp. 132–141 Search PubMed.
- Determination of sulfides by iodometry, HJ/T 60-2000 Search PubMed.
- L. Wang, G. Q. Li and Y. F. Zhang, et al., Ind. Water Treat., 2013, 33(11), 79–81 Search PubMed.
- D. M. Xu, H. Wang, J. Gao, G. F. Yuan, X. W. Zhou and D. Y. Ji, Modern Chemical Industry, 2015, 35(11), 64–68 Search PubMed.
- D. Dey, S. Pal, H. R. Yadav, P. S. Sengupta, A. R. Choudhury, N. Kolea and B. Biswas, RSC Adv., 2015, 5, 42681–42688 RSC.
- J. P. He and H. Li, Coking chemical product recovery technology, Beijing, Metallurgical Industry Press, 2006, pp. 183–213 Search PubMed.
- W. Zhang, C. Wei and C. Feng, et al., Water Sci. Technol., 2013, 68(2), 433–440 CrossRef PubMed.
- C. Lin, X. R. Zhuo, X. B. Yu, M. Y. Yuan and C. H. Wei, RSC Adv., 2015, 5, 43786–43797 RSC.
- G. Q. Li, PhD thesis, Taiyuan University of Technology, 2014.
- S. T. Zhang, G. Q. Li, H. Y. Wang, C. Li, T. Li and Y. F. Zhang, J. Anal. Appl. Pyrolysis, 2018 Search PubMed , in press.
- Y. B. Cao and W. B. Ding, Gas and Heat, 1997, 18(3), 17–19 Search PubMed.
| This journal is © The Royal Society of Chemistry 2018 |