
 Open Access Article
 This Open Access Article is licensed under a Creative Commons Attribution-Non Commercial 3.0 Unported Licence
Nanostructured WO3/graphene composites for sensing NOx at room temperature
Parag V. Adhyapak *a,
Amruta D. Banga,
Pooja Moreb and
N. R. Munirathnama
*a,
Amruta D. Banga,
Pooja Moreb and
N. R. Munirathnama
aCentre for Materials for Electronics Technology, Panchawati, Pashan Road, Pune 411008, India. E-mail: adhyapak@cmet.gov.in
bSavitribai Phule Pune University, Pune, 411007, India
First published on 4th October 2018
Abstract
WO3 has emerged as an outstanding nanomaterial composite for gas sensing applications. In this paper, we report the synthesis of WO3 using two different capping agents, namely, oxalic acid and citric acid, along with cetyltrimethyl ammonium bromide (CTAB). The effect of capping agent on the morphology of WO3 material was investigated and presented. The WO3 materials were characterized using X-ray diffraction analysis (XRD), field emission transmission electron microscopy (FETEM), field emission scanning electron microscopy (FESEM), particle size distribution (PSD) analysis, and UV-visible spectroscopic analysis. WO3 synthesized using oxalic acid exhibited orthorhombic phase with crystallite size of 10 nm, while WO3 obtained using citric acid shows monoclinic phase with crystallite size of 20 nm. WO3 obtained using both capping agents were used to study their gas sensing characteristics, particularly for NOx gas. The cross sensitivity towards interfering gases and organic vapors such as acetone, ethanol, methanol and triethylamine (TEA) was monitored and explained. Furthermore, the composites of WO3 were prepared with graphene by physical mixing to improve the sensitivity, response and recovery time. The composites were tested for gas sensing at room temperature as well as at 50 °C and 100 °C. The results indicated that the citric acid-assisted WO3 material exhibits better response towards NOx sensing when compared with oxalic acid-assisted WO3. Moreover, the sensitivity of the WO3/graphene nanocomposite was better than that of the pristine WO3 material towards NOx gas. The WO3 composite prepared using citric acid as capping agent and graphene exhibits sensing response and recovery time of 29 and 24 s, respectively.
1 Introduction
In power stations, the main component of the released exhaust gases is a mixture comprising 90% NO and NO2 at different ranges of ppm levels. NOx has been the cause for calamities such as acid rain, smog and ozone depletion. The Threshold Limit Value (TLV) for NO and NO2 estimated by environmental monitoring organizations is 3 and 25 ppm, respectively. Looking at these facts, many researchers tried to fabricate gas sensors using different sensing materials such as ZnO, SnO2, WO3, TiO2, and Fe2O3.1,2 All these compounds have a non-stoichiometric structure and therefore, electrical conductivity is observed due to the presence of free electrons resulting from oxygen vacancies. When an oxidizing or reducing gas comes in contact with the semiconducting nanocompounds, their resistivity changes accordingly; hence, they can act as a sensor for the gas. Even though the same working mechanism exists for adsorption and desorption in all the above mentioned compounds such as ZnO, SnO2, and WO3, the operating temperature and voltage required by WO3 for gas sensing is lower than that of the other compounds.3The nanostructured4,5 WO3 powder with different morphologies have been synthesized by various methods such as hydrothermal method, acidification, atmospheric plasma spray method, solvothermal method, sol spin coating, template-directed wet chemical synthesis, thermal evaporation, and reactive DC magnetron sputtering.4–8 Meng et al. synthesized flower-like WO3 nanostructure using citric acid as a capping agent, which exhibited sensing response towards ethanol at 250 °C.9 Su et al. also reported WO3 nanoplates with square morphology using citric as well as tartaric acid.10 Wang et al. synthesized WO3 nanorods with high crystallinity by hydrothermal method from ammonium meta-tungstate and citric acid. It was also reported that citric acid plays a major role in determining the morphology. With the increase in concentration of citric acid, there was growth observed along [202] and [220] crystallographic directions, resulting in the formation of nanorods.11 Patil et al. synthesized WO3 nanorods using oxalic acid by the hydrothermal method, and the role of oxalic acid in synthesis was explained.12 Similarly You et al. synthesized oxalic acid-assisted WO3 nanoparticles, which showed good response to NOx at 125 °C.13
Considering the variations in morphologies yielded by two dicarboxylic acids, namely, citric and oxalic acid, with different experimental conditions, we selected these dicarboxylates for the synthesis of WO3. Furthermore, the as-synthesized WO3 was blended with graphene to increase its effective sensitivity. Thus, we achieved maximum sensitivity for WO3 with lesser response and recovery time at room temperature for NOx when compared with WO3 synthesized with earlier published literature.
2 Experimental
All the chemicals used in the experiment are of AR grade.2.1 Synthesis of nanostructured WO3
Sodium tungstate dihydrate was dissolved in water to form 20 mL 3 mM solution. To this solution, 2 M HCl was added dropwise to form a pale yellow precipitate. The precipitate was centrifuged and dissolved in 1 M citric acid solution. To the above solution, 4.5 mM CTAB was added and the resultant mixture was diluted to 40 mL. The reaction mixture was further transferred to a Teflon-lined stainless steel autoclave and heated at 180 °C for 12 h in an oven. The autoclave was naturally cooled to room temperature. The intermediate products were collected after centrifugation (5000 rpm) and dried at 80 °C for 4 h. The as-prepared precursors were sintered at 600 °C for 2 h to obtain the final oxides. WO3 obtained using citric acid is labelled as PA1. Similar experiment was conducted to synthesize WO3 by using oxalic acid instead of citric acid. WO3 obtained using oxalic acid is labelled as PA2.2.2 Synthesis of WO3/graphene nanocomposite
The nanocomposite of WO3 and graphene was prepared using a physical mixture method. Initially, 1% graphene was taken in 10 mL ethanol and sonicated for 20 min. To this solution, the as-synthesized WO3 powder was added and further sonicated for 1 h. The resultant WO3/graphene nanocomposite solution was allowed to evaporate at room temperature to form a paste, which was then applied on the substrate.2.3 Physicochemical characterization
The crystalline structures of the resultant powders were characterized by XRD on a Rigaku Miniflex diffractometer using CuKα radiation (λ = 1.5405 Å; nickel filter). The crystallite size was estimated using the Scherrer's formula. Optical absorption spectrum was recorded on a Hitachi UV-Visible Spectrophotometer (model U-3210). Morphological studies were conducted using FE-SEM (Hitachi Model 5890). FETEM analysis was performed using an FETEM analyzer (JEOL JEM 220Ks model). PSD analysis was conducting via a dynamic light scattering method using a submicron particle size analyzer, PSS-Nicomp-380 (Santa Barbara, California, USA).2.4 Gas sensing characterization
The gas sensing measurements were performed for WO3 and WO3/graphene nanocomposite products. Planar interdigitated electrode14 arrays are a commonly used electrode configuration for conductimetric sensing applications. The electrodes were fabricated in-house using a thick film paste. The design of the interdigitated electrode structure is illustrated in Fig. 1a. At one end of the structure, there is a set of interdigitated electrodes that occupy an area of 8 × 8 mm. The width of the digits is 1 mm and the space between them is 0.5 mm. Alumina substrate (0.6 mm thick and 10 × 10 mm area) was used for the fabrication of interdigitated electrodes. Screen-printing technique was used for the printing of the electrode pattern on the substrate. Silver paste was screen-printed on the substrate. The thickness of the silver pattern was 8 μm. The gas sensing measurements were performed using a set-up (shown in Fig. 1c) as reported earlier.15,16 It essentially consists of a circular platform with a place for mounting the substrate and sensing material. The platform was covered with a glass dome to house it in inert atmosphere and to protect it from other gaseous disturbances. The process conducted was as follows. Initially, 25 mg each of the WO3 (WO3 prepared using oxalic acid and citric acid) were taken in a mortar and pestle. Then, 0.5 mL ethanol was added to form a paste. The semi-liquid paste was then drop casted on an alumina substrate with silver electrodes patterned on it. The substrate was then dried at 60 °C for 1 h.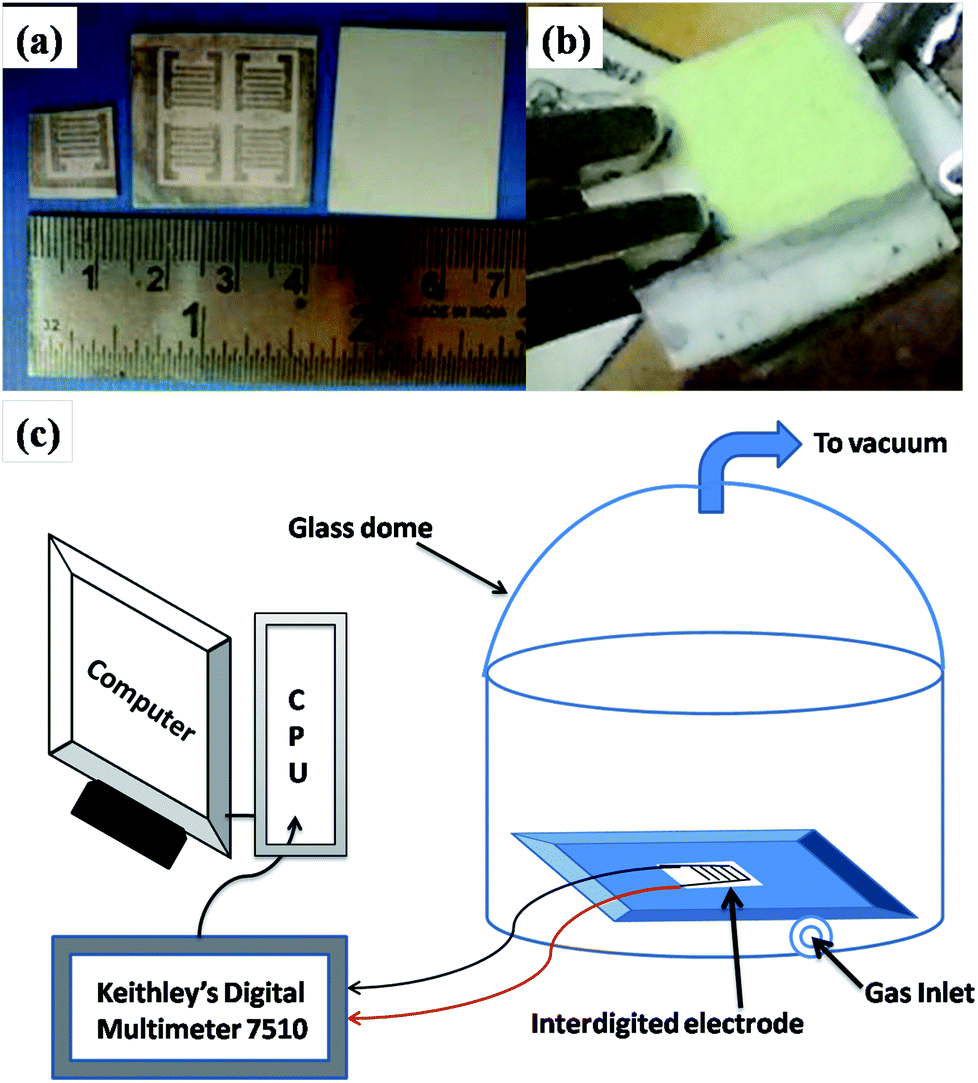 | ||
| Fig. 1 (a) Photograph of an interdigitated electrode. (b) Photograph of the material drop-casted on the electrode. (c) Schematic of the gas sensing set up. | ||
The WO3-coated substrate was kept inside the dome and a provision was made to inject the gas in the dome. For measuring the change in resistance, a Digital Multimeter (Keithley model 7510) was used.
3 Results and discussion
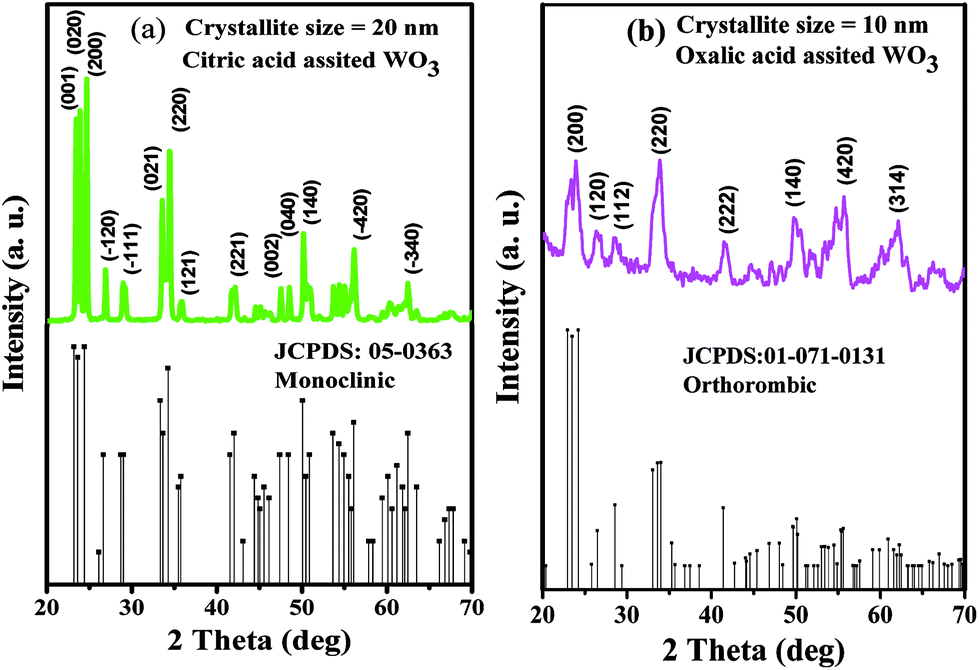
The particulate properties of the nanostructured WO3 were studied via XRD, FESEM, FETEM, UV-visible spectroscopy and PSD. The diffraction patterns of the WO3 products obtained using citric acid and oxalic acid as capping agents exhibited sharp crystalline peaks. The diffraction pattern of WO3 obtained using citric acid perfectly matches with the JCPDS card no. 05-0363, confirming the formation of the monoclinic phase (Fig. 2a). The prominent peaks were observed at 2θ values of 23.4, 23.86, 24.64, 26.85, 28.93, 33.54, 34.45, 35.88, 42.12, 47.52, 48.49, 50.18, 53.69, 54.41, 54.99, 56.16, and 62.47 corresponding to (001), (020), (200), (−120), (−111), (021), (220), (121), (221), (003), (040), (140), (022), (041), (−240), (−420), and (−340) diffraction planes, respectively.17 All the observed XRD peaks were found to be shifted to higher 2θ values (∼0.2°) than those in the reported JCPDS data with lattice parameter values a = 7.2850, b = 7.5170, and c = 3.8350. The mean crystallite size calculated using Scherrer's equation (0.9λ/β![[thin space (1/6-em)]](https://www.rsc.org/images/entities/char_2009.gif) cosθ) was found to be 20 nm.
cosθ) was found to be 20 nm.
 | ||
| Fig. 2 X-ray diffraction pattern of the as-synthesized WO3 samples prepared using (a) citric acid (PA1) and (b) oxalic acid (PA2). | ||
Similarly, XRD pattern of the WO3 product obtained using oxalic acid (Fig. 2b) matches with the JCPDS card no. 01-071-0131, depicting the orthorhombic phase. The major diffraction peaks are observed at 2θ values of 23.37, 23.90, 26.35, 28.44, 33.88, 41.48, 44.68, 45.61, 49.75, 51.65, 54.76, 55.70, and 62.12 corresponding to (020), (200), (120), (112), (220), (222), (132), (312), (140), (303), (214), (420), and (314) diffraction planes, respectively. The lattice parameters match with the standard values, with a = 7.3410, b = 7.5700, and c = 7.7541, and are in accordance with the literature.17,18 The mean crystalline size calculated is around 10 nm. No other impurity peaks were observed in both the XRD patterns.
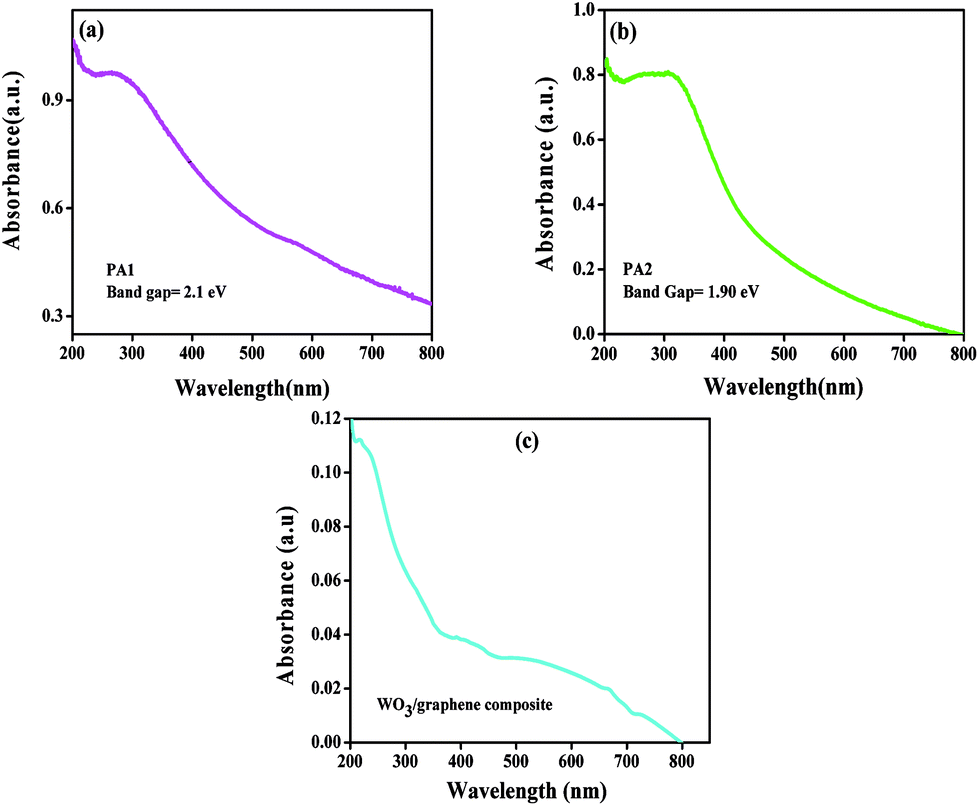
The optical absorption spectra of WO3 obtained using citric acid and oxalic acid as capping agents are displayed in Fig. 3a and b The inset shows the plot of absorbance vs. energy. The band gap energy was calculated by extrapolating the straight line portion of the curve on the energy axis. The band gap for both the products obtained using citric acid and oxalic acid was recorded as 2.1 eV and 1.9 eV, respectively. The particle sizes were also calculated from optical absorption spectra19 and were found to be 4.52 nm and 4.18 nm for PA-1 and PA-2, respectively.
 | ||
| Fig. 3 Optical absorption spectrum of WO3 obtained using (a) citric acid (PA1) and (b) oxalic acid (PA2). (c) Optical absorption spectrum of PA1/graphene composite. | ||
The optical absorption spectra of WO3/graphene composite are as shown in Fig. 3c. It could be observed that there is a change in the optical absorption spectrum after addition of graphene. The band located at 250 nm is due to the π–π* transition of graphene.20
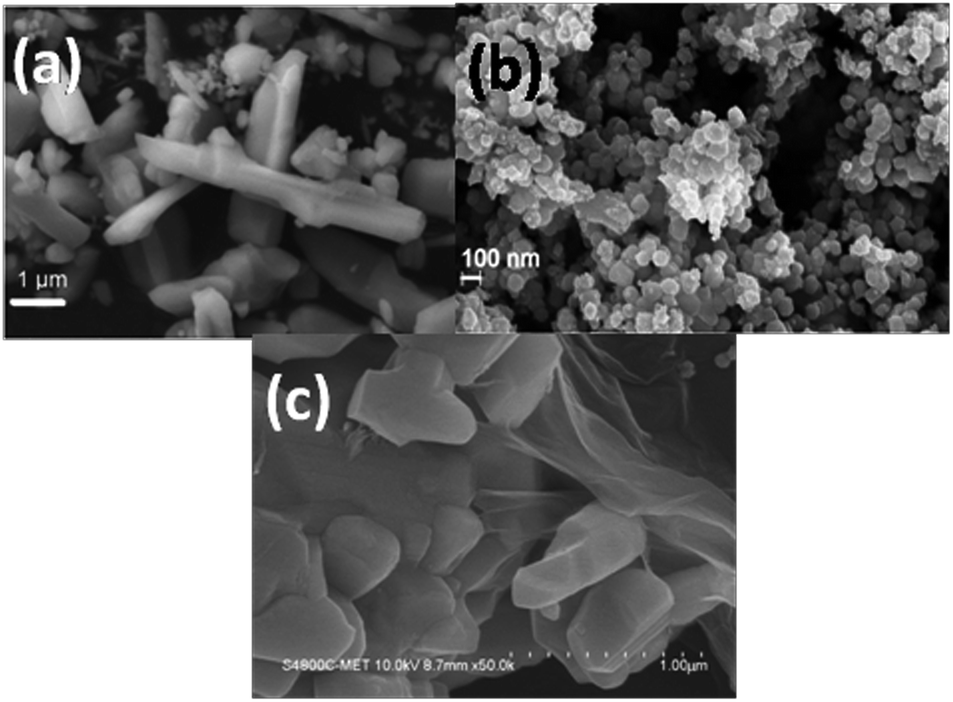
The SEM and FESEM photomicrographs obtained using citric acid and oxalic acid-assisted WO3 are presented in Fig. 4. It can be observed that the citric acid-assisted WO3 product consists of a mixture of nanoparticles as well as rod-like structures (Fig. 4a). The rod-like structures were presumably formed by the agglomeration of nanoparticles and can be evidenced by FETEM analysis. The diameter of the nanorods is 90 nm and length is a few microns.
 | ||
| Fig. 4 SEM photograph of WO3 obtained using (a) citric acid (PA1) and (b) oxalic acid (PA2). (c) SEM photograph of PA1/graphene composite. | ||
In case of WO3 obtained using oxalic acid, clusters of nanoparticles are observed (Fig. 4b). The size of the nanoparticles is around 20–30 nm. The nanoparticles are intact and form an island of clusters all over.
The FESEM photomicrographs of WO3 (obtained using citric acid) and graphene composite are presented in Fig. 4c. It can be observed that the composite consists of WO3 nanoparticles well-wrapped with graphene sheets. The interface of WO3 and graphene can also be clearly seen.
Closer observations on morphological characterization were performed using FETEM analysis. The corresponding FETEM images are displayed in Fig. 5. The WO3 product obtained using citric acid shows spherical nanoparticles with size of around 60–70 nm, and were agglomerated to form rod-like structures (Fig. 5a). Fig. 5b illustrates the clusters of 10 to 20 nanoparticles with size varying from 20–50 nm. All these results are in accordance with the SEM observations. The inset shown in Fig. 5 is a clear crystallite diffraction pattern for both the products.
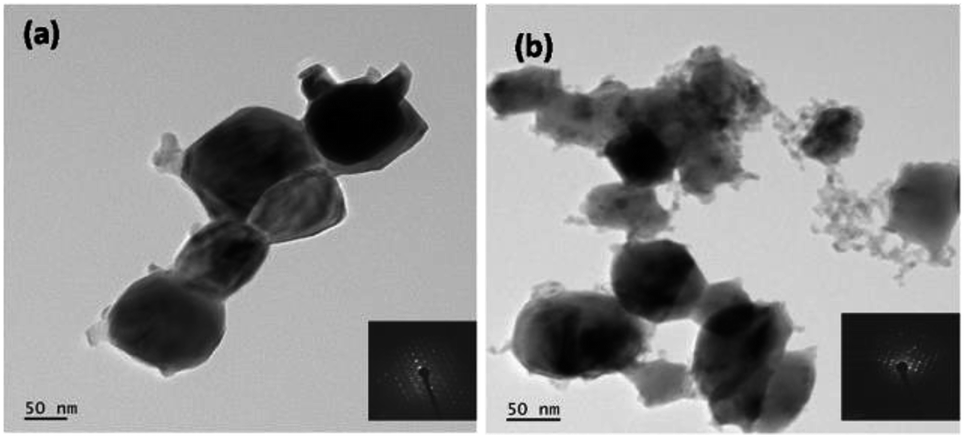 | ||
| Fig. 5 TEM images of WO3 obtained using (a) citric acid (b) oxalic acid (inset: electron diffraction patterns). | ||
The chemical reaction mechanism for the formation of WO3 using citric acid and oxalic acid is explained below. In the initial stage, sodium tungstate reacts with HCl to form tungstic acid and sodium chloride.
| Na2WO4 + 2HCl + H2O → H2WO4 + 2NaCl + H2O | (1) |
In case of citric acid-assisted WO3, the initially obtained precipitate was redissolved in 1 M citric acid solution. The probable reaction is given below:
| H2WO4 + C6H8O7 + H2O → WO3 + C6H8O7 + 2H2O | (2) |
Thus, WO3 formation takes place, and the growth of WO3 is controlled by citric acid. Citric acid acts as a shape modifier. The growth of the particles is controlled in citric acid by the coating of citric ions on the particles of WO3. However, after heating at 600 °C, the one directional growth accelerated, resulting in formation of the nanorods of WO3.21
The reaction with oxalic acid can be presented as follows:
| H2WO4 + C2H2O4 + H2O → WO3 + C2H2O4 + 2H2O | (3) |
Oxalic acid is a well-known chelating agent that can combine with WO42− ions and form WO3·OC2H4. Subsequent chelating forms WO3 after calcination at 600 °C. Thus, WO3 formed after calcinations at 600 °C exhibit distinct crystal growth. The WO3 nanocrystals formed are unidirectional and in the form of clusters.
3.1 Sensing characterization
Gas sensing measurements were performed to check the sensitivities using various gases such as NOx, acetone, ethanol, methanol, and TEA.The sensitivity was calculated using the formula:
| Sensitivity = (Rg/Ra) − 1, for oxidizing gases; |
| Sensitivity = (Ra/Rg) − 1, for reducing gases; |
The effect of morphologies of two different samples and the effect of graphene on the sensitivity of the gas sensing was studied. Due to its small band gap, WO3 shows a sensing response even at room temperature, and is the most desirable property of WO3. The sensitivity of both the WO3 samples was studied at room temperature for different gases such as NOx, acetone, ethanol, methanol, and TEA. As shown in the Fig. 6, the WO3 product sensitivity obtained using citric and oxalic acid is the highest towards NOx as compared with other gases.
 | ||
| Fig. 6 Room temperature sensitivity of WO3 obtained using (a) citric acid and (b) oxalic acid with different gases at 1000 ppm. | ||
WO3 obtained using citric acid has higher sensitivity than WO3 obtained using oxalic acid. In case of the product obtained using oxalic acid, even though the sensitivity for NOx is more, there is hardly any difference between the sensitivities of the five gases studied, as shown in Fig. 6.
To compare the sensitivity towards NOx, both the products were exposed to different concentrations of NOx, and the results are presented in Fig. 7. The concentration of NOx was varied from 200 ppm to 1000 ppm in steps of 200 ppm. At 200 ppm the response of both the products towards NOx is comparatively similar. However, as the concentration changes from 200 ppm to 500 ppm, the response of citric acid-assisted WO3 increases linearly up to 1000 ppm compared with oxalic acid-assisted WO3, which increases linearly up to 400 ppm and drops thereafter. Thus, the overall response of WO3 obtained using citric acid towards NOx was found to be better and higher when compared with oxalic acid-assisted WO3.
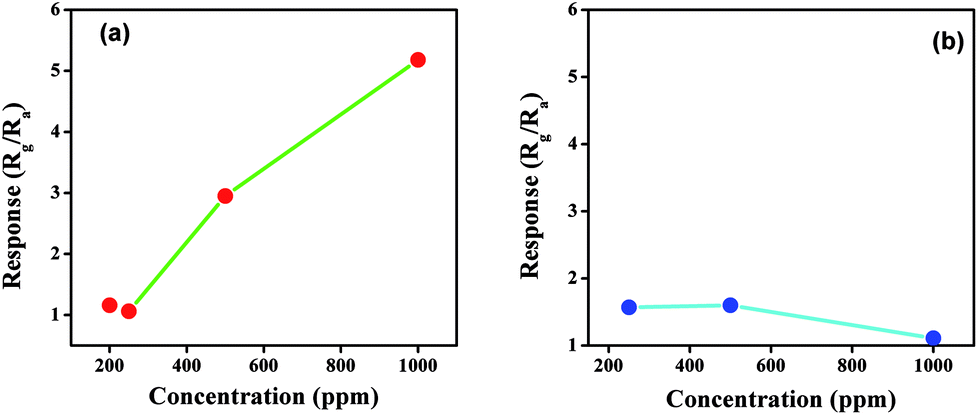 | ||
| Fig. 7 Response towards different concentration of NOx for WO3 obtained using (a) citric acid and (b) oxalic acid at room temperature. | ||
We can depict from the above study that the morphology of the material and band gap affects the sensing response considerably. It is further opined that smaller the band gap, higher would be the response at room temperature. Particle size also plays an important role. As shown in Fig. 7(a & b), it could be observed that oxalic acid-assisted WO3 has slightly greater response at lower concentration of NOx than the citric acid-assisted WO3, which can be attributed to the smaller particle size of oxalic acid-assisted WO3. As the overall sensitivity and response of WO3 obtained using citric acid is higher than that of the other product, the citric acid-assisted WO3 was selected for further studies.
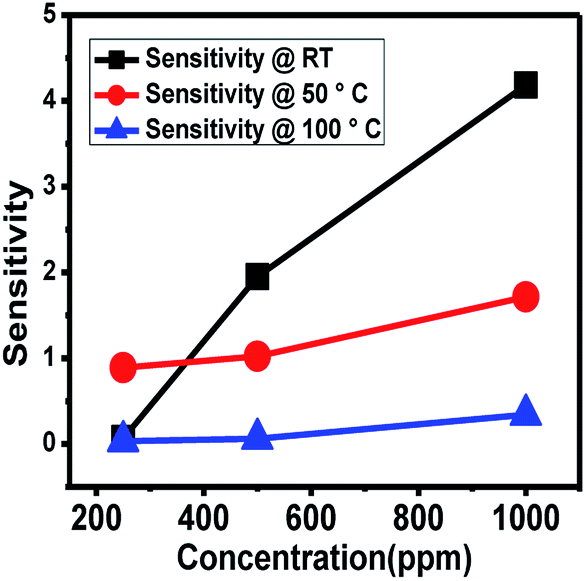
The NOx gas sensing experiment was performed with the citric acid-assisted WO3 at different temperatures namely, at room temperature, 50 °C and 100 °C (Fig. 8). For these three temperatures, the sensitivity towards NOx was found to increase with the increase in concentration of NOx.
 | ||
| Fig. 8 NOx sensing response of WO3 obtained using citric acid at different temperatures (RT, 50 °C and 100 °C) as a function of increase in concentration of NOx. | ||
As the temperature increases, the resistance of the material decreases and therefore, the change in resistance (ΔR) decreases, resulting in reduction in the sensitivity at higher temperature. Thus, the maximum sensitivity was observed at room temperature. Furthermore, to increase the sensitivity, graphene was introduced.
A gas sensing experiment in the concentration range of 10–200 ppm of NOx was performed for citric acid-assisted WO3 and graphene nanocomposite at room temperature and compared with pristine WO3 obtained using citric and oxalic acid (depicted in Fig. 9). As the concentration of gas increases in the range between 10 and 200 ppm, the sensitivity of WO3/graphene composite was found to be linearly increasing. However, in case of pristine WO3, the increase in sensitivity with respect to concentration is not clearly linear.
 | ||
| Fig. 9 Comparison of sensitivity of pristine WO3 (obtained using citric acid and oxalic acid) and WO3/graphene composite at room temperature. | ||
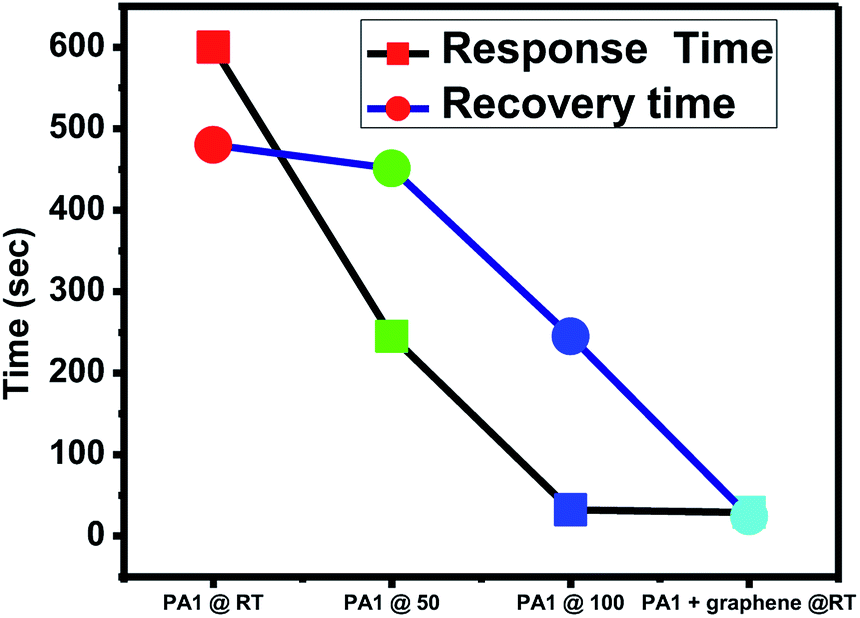
The response time and recovery time of the sensing material is also a crucial aspect. The composite was found to have a minimum response time of 29 s and recovery time of 24 s, as depicted from the graph (Fig. 10). The response and recovery time of the composite was compared with the reported literature. Qin et al.21 reported the NOx sensing response of solvothermally prepared WO3 nanowire and nanosheets. Their sensor worked at 200 °C and the response time and recovery time achieved were 19 s and 112 s, respectively. You et al.22 reported more sensitive square-like geometrical WO3 sheets, exhibiting NOx response at 150 °C with a response time of 300 s and recovery time of 30 s. You et al.13 tested the sensing response and recovery time for spherical WO3 nanoparticles at 125 °C. The response time observed was 180 s, while the recovery time was 90 s. Xia et al.23 synthesized ultrathin ZnO nanorods/reduced graphene oxide mesoporous nanocomposites for high-performance room-temperature NO2 sensors, showing response time of 75 s and recovery time of 132 s. Bai et al.24 doped WO3 nanoparticles with Sb, Cd and Ce to enhance the room temperature sensitivity of the material. They have also concluded that lowering the band gap of the material may result in an increase in its response towards NOx at room temperature. Hence, compared with the above mentioned reports, the composite of WO3 and graphene prepared in the present study shows a very good response and recovery time at room temperature. WO3 is generally immobilized on graphene, and the electrons generated are quickly transported to the surface due to graphene. Hence, graphene works as an electron transporter and shows good response. This can be attributed to its efficient functioning at room temperature. The mechanism of sensing is as follows. WO3 is an n-type semiconductor in which electrons are majority charge carriers responsible for sensing the gas molecules. NO2 is an oxidizing gas. When NO2 is adsorbed on the active sites of WO3, it captures the electrons from WO3, which in turn increases the resistance of WO3. In case of the WO3 graphene composite, graphene contributes to enhancement of sensitivity by (i) increasing the conductivity of the composite, (ii) facilitating the adsorption and diffusion of the gas molecule (due to the higher surface area), and (iii) specific capturing and migration of electrons from WO3 to graphene due to the Schottky barrier at the interface of graphene and WO3.20 The gas sensing experiments of the composite were also performed at specific time intervals to check its stability and reproducibility and the results were found to be consistent.
 | ||
| Fig. 10 NOx gas sensing response of WO3 and WO3/graphene nanocomposite at room temperature, 50 °C, and 100 °C. | ||
4 Conclusions
WO3 nanocomposites for sensing at room temperature were successfully synthesized by citric acid and oxalic acid. Nanorod structures caused by agglomeration of spherical particles were observed in citric acid-assisted WO3, whereas a uniformly distributed spherical particle structure was observed in oxalic acid-assisted WO3. The sensitivity of citric acid-assisted WO3 was higher at room temperature and it increases drastically when mixed with graphene. The composite of graphene and WO3 nanorods prepared by the physical mixture method showed a 29 s response time and 24 s recovery time at room temperature for 10 ppm. The increase in concentration of NOx resulted in a linear increase in sensitivity for 10, 25, 50, 100 and 200 ppm of NOx compared with the published study on WO3 sensors, indicating that both the response time and recovery time were better. We can also depict from this study that the morphology of the material and band gap affects the sensitivity response considerably. The overall results indicate that a room temperature NOx sensor could be fabricated using graphene and WO3 nanocomposite with better response and recovery time. Further studies to use the findings of this research to fabricate a NOx sensing device based on citric acid-assisted WO3 are in progress.Conflicts of interest
There is no conflict of interest.Acknowledgements
Dr Parag V. Adhyapak is grateful to ISRO, Bengaluru and VSSC, Thiruvananthapuram for financial support. Mrs Amruta Bang is thankful to ISRO and VSSC for award of JRF.References
- A. Afzal, N. Cioffi, L. Sabbatini and L. Torsi, Sens. Actuators, B, 2012, 171–172, 25–42 CrossRef CAS.
- D. Peeters, D. Barreca, D. Carraro, E. Comini, A. Gasparotto, C. Maccato, C. Sada and G. Sberveglieri, J. Phys. Chem. C, 2014, 118(22), 11813–11819 CrossRef CAS.
- Z. Hua, Y. Wang, H. Wang and L. Dong, Sens. Actuators, B, 2010, 150–2, 588–593 CrossRef.
- J. Zhang, W. Zhang, Z. Yang, Z. Yu, X. Zhang, T. C. Chang and A. Javey, Sens. Actuators, B, 2014, 202, 708–713 CrossRef CAS.
- E. Luévano-Hipólito, A. Martínez-de la Cruz, Q. L. Yu and H. J. H. Brouwers, Ceram. Int., 2014, 40–8, 12123–12128 CrossRef.
- F. Zheng, M. Zhang and M. Guo, Thin Solid Films, 2013, 534, 45–53 CrossRef CAS.
- Z. Wang, P. Sun, T. Yang, Y. Gao, X. Li, G. Lu and Y. Du, Sens. Actuators, B, 2013, 186, 734–740 CrossRef CAS.
- S. Moulzolf, S. Ding and R. Lad, Sens. Actuators, B, 2001, 77–1, 375–382 CrossRef.
- D. Meng, G. Wang, X. San, Y. Song, Y. Shen, Y. Zhang, K. Wang and F. Meng, J. Alloys Compd., 2015, 649, 731–738 CrossRef CAS.
- X. Su, F. Xiao, Y. Li, J. Jian, Q. Sun and J. Wang, Mater. Lett., 2010, 64–10, 1232–1234 CrossRef.
- X. Wang, H. Zhang, L. Liu, W. Li and P. Cao, Mater. Lett., 2014, 130, 248–251 CrossRef CAS.
- V. Patil, P. Adhyapak, S. Suryavanshi and I. Mulla, J. Alloys Compd., 2013, 590, 283–288 CrossRef.
- L. You, F. Yang, X. He, Y. Sun and G. Lu, Proc. 14th International Meeting on Chemical Sensors – IMCS, 2012, pp. 1081–1084 Search PubMed.
- N. F. Sheppard Jr, R. C. Tucker and C. Wu, Anal. Chem., 1993, 65(9), 1199–1202 CrossRef.
- S. Meshram, S. Balgude, I. Mulla and P. Adhyapak, Proc. 2nd International Symposium on Physics and Technology of Sensors, ISPTS, 2015, pp. 196–199 Search PubMed.
- P. Adhyapak, S. Meshram, A. Pawar, D. Amalnerkar, U. Mulik and I. Mulla, Ceram. Int., 2014, 40–8, 12105–12115 CrossRef.
- P. Gouma, A. Prasad and K. Iyer, Nanotechnology, 2006, 17–4, S48 CrossRef PubMed.
- S. Adhikari and D. Sarkar, RSC Adv., 2014, 4–39, 20145–20153 RSC.
- K. Nemade and S. Waghuley, Results Phys., 2013, 3, 52–54 CrossRef.
- A. Xiaoqiang, C. Yu Jimmy, Y. Wang, Y. Hu, X. Yu and G. Zhang, J. Mater. Chem., 2012, 22–17, 8525–8531 Search PubMed.
- Y. Qin, M. Hu and J. Zhang, Sens. Actuators, B, 2010, 150, 339–345 CrossRef CAS.
- L. You, Y. Sun, J. Ma, Y. Guan, J. Sun, Y. Du and G. Lu, Sens. Actuators, B, 2011, 157, 401–407 CrossRef CAS.
- Y. Xia, J. Wang, J. Xu, X. Li, D. Xie, L. Xiang and S. Komarneni, ACS Appl. Mater. Interfaces, 2016, 8–51, 35454–35463 CrossRef PubMed.
- S. Bai, Y. Ma, X. Shu, J. Sun, Y. Feng, R. Luo, D. Li and A. Chen, Ind. Eng. Chem. Res., 2017, 56–10, 2616–2623 CrossRef.
| This journal is © The Royal Society of Chemistry 2018 |