 Open Access Article
Synthesis and photoluminescence properties of novel far-red-emitting BaLaMgNbO6:Mn4+ phosphors for plant growth LEDs
Qi Sun,
Shaoying Wang,
Balaji Devakumar,
Bin Li,
Liangling Sun,
Jia Liang and
Xiaoyong Huang *
*
Key Lab of Advanced Transducers and Intelligent Control System, Ministry of Education and Shanxi Province, College of Physics and Optoelectronics, Taiyuan University of Technology, Taiyuan 030024, PR China. E-mail: huangxy04@126.com
First published on 10th August 2018
Abstract
A series of far-red-emitting BaLaMgNbO6:Mn4+ (BLMN:Mn4+) phosphors were successfully synthesized by a high-temperature solid-state reaction method. Crystal structure and luminescence properties of the obtained samples were systematically investigated. The emission spectra exhibited a strong narrow far-red emission band peaking at 700 nm with a full width at half-maximum (FWHM) of ∼36 nm under 360 nm excitation. The optimal Mn4+ concentration was about 0.4 mol%. The internal quantum efficiency and CIE chromaticity coordinates of the BLMN:0.4% Mn4+ phosphor were 52% and (0.7222, 0.2777), respectively. In addition, the luminescence mechanism has been analyzed using a Tanabe–Sugano energy level diagram. Finally, by using a 365 nm near-ultraviolet InGaN chip combined with BLMN:0.4% Mn4+ phosphors, a far-red LED device was fabricated.
Introduction
Light plays a key role in indoor plant cultivation, especially for plants that have a high demand for light.1,2 It is known that light controls the process of plant growth, because blue light around 450 nm (410–500 nm) promotes leaf growth, stomatal opening, and photosynthesis, and red light around 660 nm (610–700 nm) contributes to the growth of plant stems and phototropism, while far-red light around 730 nm (700–740 nm) modulates the process of plant germination and plant flowering time.3–6 Phytochrome regulates plant growth and development, which have two types – PR and PFR, PR absorbs red light peaked at 660 nm and PFR absorbs far-red light centered at about 730 nm.7,8 Compared to traditional incandescent and fluorescent lamps, light emitting diodes (LEDs) have become the promising candidates for artificial light sources for plant growth due to their extraordinary advantages such as the high luminescence efficiency, energy saving, and good stability.9–18 Especially, LEDs can adjust the spectral composition by using various phosphors to match with the spectrum of plant photosynthesis and photomorphogenesis. So, nowadays LEDs have been widely applied in indoor plant growth.19In recent years, non-rare-earth Mn4+ doped red-emitting phosphors for LEDs for plant growth have attracted tremendous attention, because the price for the rare-earth materials has been increasing sharply due to the shortage in the supply of rare-earth materials.20,21 It is well known that Mn4+ ion with the d3 electron configuration can emit red or far red luminescence with emission wavelengths ranging from 600 to 800 nm under ultraviolet (UV)/blue excitation, resulting from its 2Eg → 4A2g transition in a strong crystal field.22–25 Recently, Mn4+-activated red phosphors have been extensively studied.26 Mn4+ doped fluorides show intense excitation band located at ∼460 nm and sharp red emission centered at ∼630 nm.27–30 Unfortunately, the toxic HF solution used in preparation process is harmful to the environment and humans, and these fluorides have poor stability in moisture environment. As an alternative, Mn4+ doped oxides, such as Li2MgTiO4:Mn4+, Li2MgZrO4:Mn4+, and Ba2YNbO6:Mn4+ give rise to far-red emissions and have eco-friendly preparation process, which thus can be considered as potential red-emitting phosphors for LEDs.5,23,31,32 Thus, searching for appropriate hosts providing abundant octahedral sites for Mn4+ ions is urgent.
Compounds with perovskite structure are regarded as potential hosts owing to their good chemical stability and superior optical properties.33–40 Among the oxides, many niobate-based perovskite-structured phosphors, such as Ca2GdNbO6:Mn4+, Ba2YNbO6:Mn4+, Ba2GdNbO6:Mn4+, and Sr2LaNbO6:Mn4+, have attracted considerable attention.31,41–43 BaLaMgNbO6 (BLMN) has many [NbO6] octahedrons with a cubic crystal structure that are suitable for Mn4+ doping. In this present paper, we reported novel double-perovskite BLMN:Mn4+ far-red-emitting phosphors, which have been synthesized through high-temperature solid-state reaction in air. It was found that under 360 nm excitation, BLMN:Mn4+ phosphors showed an intense emission band centered at 700 nm between 650 and 800 nm, which was matched well with the absorption band of phytochrome PFR. The optimal doping concentration of Mn4+ was about 0.4 mol%. The CIE chromaticity coordinates and internal quantum efficiency (IQE) of BLMN:0.4% Mn4+ sample were (0.7222, 0.2777) and 52%, respectively. Moreover, the concentration quenching mechanism was discussed. In addition, the luminescence mechanism was explained by the Tanabe–Sugano energy level diagram. Thermal quenching characteristics were also analyzed. All these investigations demonstrated that BLMN:Mn4+ phosphors are promising far-red-emitting materials for far-red LEDs for plant growth.
Experimental
A series of BaLaMgNb1−xO6:xMn4+ (BLMN:xMn4+; x = 0.05%, 0.1%, 0.2%, 0.4%, 0.8%, and 1.0%) phosphors were successfully synthesized through a high-temperature solid-state reaction method. BaCO3 (analytical reagent, AR), La2O3 (99.99%), MgO (AR), Nb2O5 (AR), and MnCO3 (AR) were used as the raw materials. According to the stoichiometric ratio, these raw materials were weighted and ground in an agate mortar to achieve uniformity. The obtained mixtures were transferred to the alumina crucibles and pre-calcined at 500 °C for 3 h, then sintered at 1500 °C for 6 h in air. Finally, the samples were cooled to room temperature naturally in the furnace, and they were reground again to obtained final samples for further characterizations.The X-ray diffraction (XRD) patterns of the samples were recorded on a Bruker D8 X-ray diffractometer using Cu Kα radiation. The morphology properties of the samples were analyzed by using a field-emission scanning electron microscope (FE-SEM; TESCAN MAIA3). The photoluminescence (PL) and PL excitation (PLE) spectra and decay lifetimes were measured by an Edinburgh FS5 spectrometer equipped with a 150 W continued-wavelength xenon lamp and a pulsed xenon lamp, respectively. The IQE was measured by an Edinburgh FS5 spectrometer equipped with an integrating sphere coated with BaSO4.
Results and discussion
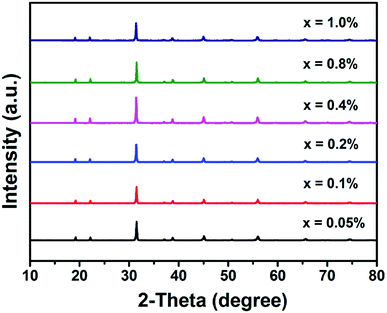
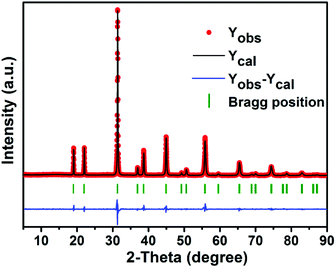
Fig. 1 shows the XRD patterns of the as-prepared BLMN:xMn4+ (x = 0.05%, 0.1%, 0.2%, 0.4%, 0.8%, and 1.0%) samples. It can be seen that all the samples exhibited similar diffraction patterns, indicating that increasing Mn4+ ions concentration does not significantly influence the crystal structure.To further analyze the crystal structure details of the as-prepared samples, Rietveld refinement of BLMN:0.4% Mn4+ was carried out. The refined results for the XRD profile of BLMN:0.4% Mn4+ are shown in Fig. 2, including the observed (dot), calculated patterns (black line), the difference between the experimental and calculated data (blue line), and the positions of Bragg reflection (short vertical green line). The final refinement data Rwp and Rp were determined to be 10.84% and 8.93%, respectively, indicating the refined results were reliable. The final refined crystallographic data were listed in Table 1.
| Formula | BLMN:0.4% Mn4+ |
| Crystal system | Cubic |
| Space group | Fm![[3 with combining macron]](https://www.rsc.org/images/entities/char_0033_0304.gif) m m |
| a = b = c | 8.0620 Å |
| α = β = γ | 90° |
| V | 523.99 Å3 |
| N | 4 |
| Rwp | 10.84% |
| Rp | 8.93% |
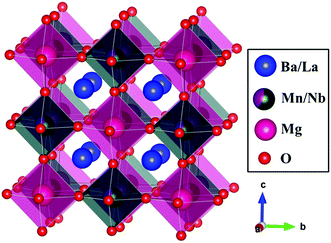
Fig. 3 presents the crystal structure of BLMN:0.4% Mn4+. The BLMN:0.4% Mn4+ belongs to double-perovskite oxide and has a cubic system with space group Fm![[3 with combining macron]](https://www.rsc.org/images/entities/char_0033_0304.gif) m. The lattice parameters are a = b = c = 8.0620 Å, V = 523.99 Å3, N = 4 and α = β = γ = 90°. It can be found that Nb5+ and Mg2+ ions occupy octahedral sites with six oxygen atoms surrounded. BLMN has many [NbO6] octahedral sites, which are suitable for Mn4+ ions doping. Mn4+ ions prefer to substitute for the Nb5+ ions over Mg2+, Ba2+ and La3+ ions owing to the similar ionic radii (0.53 Å for Mn4+, 0.64 Å for Nb5+, 0.72 Å for Mg2+, 1.35 Å for Ba2+ and 1.32 Å for La3+).44 As well-known, the radius percentage difference between the doped ions and the substituted ions should be less than 30%. The radius percentage difference between Mn4+ ions and Nb5+ ions can be estimated using the following equation:34
m. The lattice parameters are a = b = c = 8.0620 Å, V = 523.99 Å3, N = 4 and α = β = γ = 90°. It can be found that Nb5+ and Mg2+ ions occupy octahedral sites with six oxygen atoms surrounded. BLMN has many [NbO6] octahedral sites, which are suitable for Mn4+ ions doping. Mn4+ ions prefer to substitute for the Nb5+ ions over Mg2+, Ba2+ and La3+ ions owing to the similar ionic radii (0.53 Å for Mn4+, 0.64 Å for Nb5+, 0.72 Å for Mg2+, 1.35 Å for Ba2+ and 1.32 Å for La3+).44 As well-known, the radius percentage difference between the doped ions and the substituted ions should be less than 30%. The radius percentage difference between Mn4+ ions and Nb5+ ions can be estimated using the following equation:34
 | (1) |
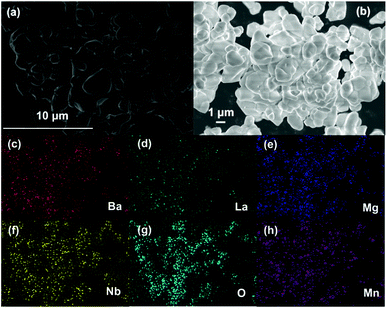
Fig. 4(a and b) shows the SEM images of the as-prepared BLMN:0.4% Mn4+ sample. It can be clearly seen that the obtain sample was agglomerated and the particle size ranged within 1–4 μm. Moreover, the corresponding element mapping results were shown in Fig. 4(c–h). The components of Ba, La, Mg, Nb, O, Mn elements were uniformly distributed on the surface of particles. The results further proved that the Mn4+ ions were well-doped in the BLMN host.45
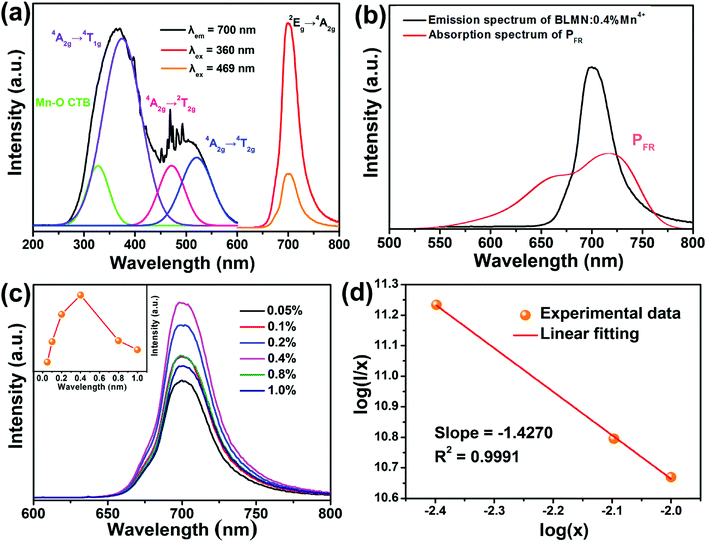
Fig. 5(a) shows the typical PLE and PL spectra of BLMN:0.4% Mn4+ sample. When monitored at 700 nm, the PLE spectrum exhibited two broad excitation bands in the region of 250 to 600 nm, which could be fitted by four Gaussian curves. The four deconvoluted Gaussian peaks centered at 327, 375, 472, and 520 nm could be ascribed to Mn–O charge transfer band (CTB), and the Mn4+ spin-allowed transitions of 4A2g → 4T1g, 4A2g → 2T2g, and 4A2g → 4T2g, respectively.46 The PLE spectrum indicated that the BLMN:Mn4+ phosphors can be efficiently excited by near-UV or blue LED chips. When excited at 360 nm and 469 nm, the BLMN:Mn4+ phosphors showed an intense far red emission peaking at 700 nm in the wavelength range of 650–800 nm, which was attributed to 2Eg → 4A2g transition of Mn4+ ions in the [MnO6]8− octahedral environment.47–50 Moreover, the full-width at half maximum (FWHM) was as narrow as ∼36 nm. Fig. 5(b) shows PL spectrum of BLMN:0.4% Mn4+ phosphors and the absorption spectrum of phytochrome PFR. An obvious overlap between the absorption spectrum of phytochrome PFR and the emissions spectrum of BLMN:0.4% Mn4+ phosphors was observed, which suggested the BLMN:Mn4+ phosphors could be used as far-red emitting materials for plant growth LEDs. Fig. 5(c) shows the PL spectra of BLMN:Mn4+ phosphors with different Mn4+ doping concentrations under 360 nm excitation. There was no change in peak shape and position with increasing Mn4+ concentration except for the emission intensity. It can be clearly seen that the PL emission intensity increased gradually with increasing the doping concentration until it reached a maximum at x = 0.4%, then began to decrease with further increasing Mn4+ content owing to the concentration quenching effect.51–53 With increasing the doping concentration, the distance between Mn4+–Mn4+ ions decreased, the possibility of energy transfer between the nearest Mn4+ ions increased, leading to lower the luminescence efficiency. In the BLMN:Mn4+ phosphors the energy transfer mechanism can not be the radiation reabsorption, because there is no overlap between PLE and PL spectra of Mn4+ ions.22 It might be related to exchange interaction or electric multipolar interaction. The critical distance (Rc) was roughly estimated by the following formula:54
 | (2) |
log(I/x) = A − (θ/3)log![[thin space (1/6-em)]](https://www.rsc.org/images/entities/char_2009.gif) x x
| (3) |
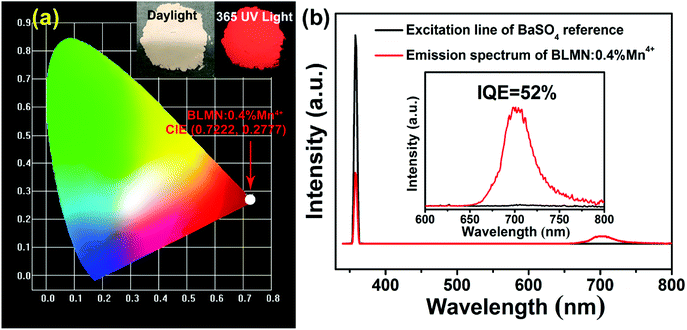
The Commission International de I'Eclairage (CIE) coordinates of the BLMN:0.4% Mn4+ sample were calculated on the basis of its PL emission spectrum and the corresponding results are displayed in Fig. 6(a). The CIE chromaticity coordinates of the BLMN:0.4% Mn4+ sample were determined to be (0.7222, 0.2777) under the excitation of 360 nm. The inset shows the digital images of the as-synthesized BLMN:0.4% Mn4+ sample under daylight and 365 nm UV light. The BLMN:0.4% Mn4+ sample showed a bright far-red light. These results revealed that the BLMN:Mn4+ phosphors may be promising candidates as far-red-emitting materials for plant growth LEDs. Under 360 nm excitation, the IQE of BLMN:0.4% Mn4+ sample was measured and illustrated in Fig. 6(b). The IQE value of the BLMN:0.4% Mn4+ sample was calculated by using the following equation:58
 | (4) |
Fig. 7 shows the decay curves of BLMN:xMn4+ (x = 0.05%, 0.1%, 0.2%, 0.4%, 0.8%, 1.0%) phosphors monitored at 700 nm with an excitation wavelength of 360 nm. All of the decay curves were fitted with a single-exponential equation:61
It = I0![[thin space (1/6-em)]](https://www.rsc.org/images/entities/char_2009.gif) exp(−t/τ) + A exp(−t/τ) + A
| (5) |
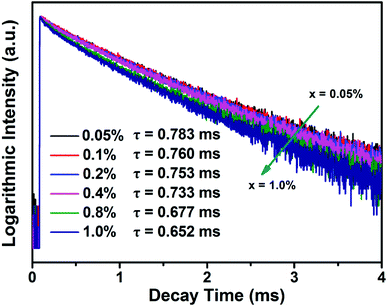 | ||
| Fig. 7 Decay curves of BLMN:xMn4+ (x = 0.05%, 0.1%, 0.2%, 0.4%, 0.8%, and 1.0%) phosphors monitored at 700 nm with an excitation wavelength of 360 nm. | ||
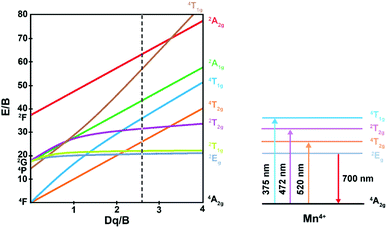
The luminescence mechanism has been analyzed by Tanabe–Sugano energy level diagram of Mn4+ ion in the octahedral site, as shown in Fig. 8. Mn4+ ion with a 3d3 electronic configuration belongs to transition metal ion. When excited at 375, 472, and 520 nm, the electrons at ground state 4A2g were pumped to the excited states 4T1g, 2T2g, and 4T2g, after that the excited electrons can relax to the lowest excited state 2Eg by non-radiative transition process. Finally, the electrons from the lowest excited state 2Eg back to ground state may occur, thus resulting in far-red light centered at 700 nm. Crystal field intensity (Dq) can be roughly calculated using the peak energy (19![[thin space (1/6-em)]](https://www.rsc.org/images/entities/char_2009.gif) 231 cm−1) of the 4A2g → 4T2g transition by the following equation:65–67
231 cm−1) of the 4A2g → 4T2g transition by the following equation:65–67
| Dq = E(4A2g → 4T2g)/10 | (6) |
 | (7) |
 | (8) |
![[thin space (1/6-em)]](https://www.rsc.org/images/entities/char_2009.gif) 667 cm−1) of 4A2g → 4T1g transition and 4A2g → 4T2g (19
667 cm−1) of 4A2g → 4T1g transition and 4A2g → 4T2g (19![[thin space (1/6-em)]](https://www.rsc.org/images/entities/char_2009.gif) 231 cm−1), the value of B was then determined to be 736 cm−1. Thus, Dq/B value can be calculated to be 2.61, which was beyond 2.2, indicating Mn4+ ions located in a strong crystal field. In additional, another Racah parameter C can be evaluated using following equation:70
231 cm−1), the value of B was then determined to be 736 cm−1. Thus, Dq/B value can be calculated to be 2.61, which was beyond 2.2, indicating Mn4+ ions located in a strong crystal field. In additional, another Racah parameter C can be evaluated using following equation:70
 | (9) |
![[thin space (1/6-em)]](https://www.rsc.org/images/entities/char_2009.gif) 286 cm−1) of 2Eg → 4A2g transition, the value for C was evaluated to be 2944 cm−1.
286 cm−1) of 2Eg → 4A2g transition, the value for C was evaluated to be 2944 cm−1.
According to the Tanabe–Sugano energy-level diagram, the wide variation in the energy of the 2Eg → 4A2g transition was barely dependent on crystal field strength. It should be determined mainly by the nephelauxetic effect, which was related to the variation in the Racah parameters B and C. Brik et al. introduced a new parameter that described the nephelauxetic effect β1.70,71
 | (10) |
![[thin space (1/6-em)]](https://www.rsc.org/images/entities/char_2009.gif) 261.92β1 ± σ, which the σ (332 cm−1) represents the root-mean square (rms) deviation of the data points from the fit line.72 The calculated 2Eg energy level was 13
261.92β1 ± σ, which the σ (332 cm−1) represents the root-mean square (rms) deviation of the data points from the fit line.72 The calculated 2Eg energy level was 13![[thin space (1/6-em)]](https://www.rsc.org/images/entities/char_2009.gif) 911–14
911–14![[thin space (1/6-em)]](https://www.rsc.org/images/entities/char_2009.gif) 575 cm−1. The experimental energy value for the 2Eg → 4A2g transition of Mn4+ in the BLMN host was 14
575 cm−1. The experimental energy value for the 2Eg → 4A2g transition of Mn4+ in the BLMN host was 14![[thin space (1/6-em)]](https://www.rsc.org/images/entities/char_2009.gif) 286 cm−1. Obviously, the result was in accord with the linear line and thus it was reliable.
286 cm−1. Obviously, the result was in accord with the linear line and thus it was reliable.
Fig. 9(a) shows the temperature-dependent emission spectra of BLMN:0.4% Mn4+ phosphors in the temperature range of 303–463 K under the excitation of 360 nm. It could be observed that with increasing the temperature, the peaks shape and position were almost similar. Moreover, the normalized intensity trend of the BLMN:0.4% Mn4+ was also shown in Fig. 9(b). With increasing temperature, the PL emission intensity decreased gradually due to the temperature quenching effect. To better understand the thermal quenching characteristics, the activation energy Ea was evaluated using the following equation:21
 | (11) |
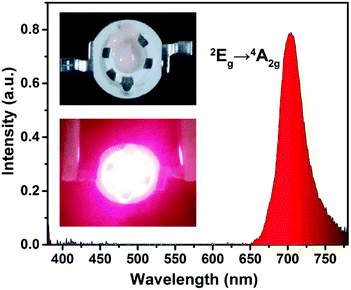
In order to further demonstrate the potential application value of the BLMN:Mn4+ phosphors in LEDs for indoor plant growth, a far-red LED device was fabricated by using as-obtained BLMN:0.4% Mn4+ phosphors coated onto a 365 nm near-UV InGaN chip. Fig. 10 shows the electroluminescent (EL) spectrum of the as-prepared LED device under the driven current of 60 mA. As shown in the inset of Fig. 10, it could be seen that the fabricated LED device clearly exhibited bright far-red light, which was attributed to a narrow emission band peaking at about 700 nm due to the 2Eg → 4A2g transition of Mn4+ ions in BLMN host. The CIE chromaticity coordinates of the LED was (0.7109, 0.2890). In this work, the device has low luminous efficacy of 0.02 lm W−1. Compared with plants, the ability of human eye to perceive of far red light is weaker, resulting in low luminous efficacy. These results indicated that the BLMN:Mn4+ could be considered as far-red-emitting phosphors for plant growth LEDs.
Conclusions
In summary, novel far-red-emitting BLMN:Mn4+ phosphors were successfully synthesized by the conventional high-temperature solid-state reaction method. The Rietveld refinement results indicated that the structure of sample was a cubic system in space group Fm![[3 with combining macron]](https://www.rsc.org/images/entities/char_0033_0304.gif) m. Monitored at 700 nm, two broad absorption bands were shown between 250 and 600 nm. With excitation of 360 and 469 nm, a far-red emission located at 700 nm within the range of 650–800 nm attributed to the 2Eg → 4A2g transition of Mn4+ ions, which was matched well with the absorption spectra of phytochrome PFR. The optimal Mn4+ doping concentration was about 0.4 mol%, and the concentration quenching mechanism of BLMN:Mn4+ was the non-radiative energy transfer among the adjacent Mn4+ ions. The CIE chromaticity coordinates and IQE of BLMN:0.4% Mn4+ sample were (0.7222, 0.2777) and 52%, respectively. In addition, the crystal field strength Dq, the Racah parameters B and C were calculated. The value of activation energy Ea was 0.411 eV. Finally, a far-red LED was fabricated by using BLMN:0.4% Mn4+ phosphors and a 365 nm near-UV LED chip. The obtained results demonstrate the BLMN:Mn4+ phosphors could be red-emitting phosphors for far-red LEDs for plant cultivation field.
m. Monitored at 700 nm, two broad absorption bands were shown between 250 and 600 nm. With excitation of 360 and 469 nm, a far-red emission located at 700 nm within the range of 650–800 nm attributed to the 2Eg → 4A2g transition of Mn4+ ions, which was matched well with the absorption spectra of phytochrome PFR. The optimal Mn4+ doping concentration was about 0.4 mol%, and the concentration quenching mechanism of BLMN:Mn4+ was the non-radiative energy transfer among the adjacent Mn4+ ions. The CIE chromaticity coordinates and IQE of BLMN:0.4% Mn4+ sample were (0.7222, 0.2777) and 52%, respectively. In addition, the crystal field strength Dq, the Racah parameters B and C were calculated. The value of activation energy Ea was 0.411 eV. Finally, a far-red LED was fabricated by using BLMN:0.4% Mn4+ phosphors and a 365 nm near-UV LED chip. The obtained results demonstrate the BLMN:Mn4+ phosphors could be red-emitting phosphors for far-red LEDs for plant cultivation field.
Conflicts of interest
There are no conflicts to declare.Acknowledgements
This work was supported by the National Natural Science Foundation of China (No. 51502190), the Program for the Outstanding Innovative Teams of Higher Learning Institutions of Shanxi, and the Open Fund of the State Key Laboratory of Luminescent Materials and Devices (South China University of Technology, No. 2017-skllmd-01).Notes and references
- N. Yeh and J.-P. Chung, Renewable Sustainable Energy Rev., 2009, 13, 2175–2180 CrossRef.
- Z. Zhou, J. Zheng, R. Shi, N. Zhang, J. Chen, R. Zhang, H. Suo, E. M. Goldys and C. Guo, ACS Appl. Mater. Interfaces, 2017, 9, 6177–6185 CrossRef PubMed.
- Z. Zhou, M. Xia, Y. Zhong, S. Gai, S. Huang, Y. Tian, X. Lu and N. Zhou, J. Mater. Chem. C, 2017, 5, 8201–8210 RSC.
- L. Li, Y. Pan, Z. Chen, S. Huang and M. Wu, RSC Adv., 2017, 7, 14868–14875 RSC.
- R. Cao, Z. Shi, G. Quan, T. Chen, S. Guo, Z. Hu and P. Liu, J. Lumin., 2017, 188, 577–581 CrossRef.
- J. Long, X. Yuan, C. Ma, M. Du, X. Ma, Z. Wen, R. Ma, Y. Wang and Y. Cao, RSC Adv., 2018, 8, 1469–1476 RSC.
- J. Xiang, J. Chen, N. Zhang, H. Yao and C. Guo, Dyes Pigm., 2018, 154, 257–262 CrossRef.
- Y. Zheng, H. Zhang, H. Zhang, Z. Xia, Y. Liu, M. S. Molokeev and B. Lei, J. Mater. Chem. C, 2018, 6, 4217–4224 RSC.
- X. Huang, H. Guo and B. Li, J. Alloys Compd., 2017, 720, 29–38 CrossRef.
- X. Huang, B. Li and H. Guo, Ceram. Int., 2017, 43, 10566–10571 CrossRef.
- P. Du, X. Huang and J. S. Yu, Chem. Eng. J., 2018, 337, 91–100 CrossRef.
- H. Guo, X. Huang and Y. Zeng, J. Alloys Compd., 2018, 741, 300–306 CrossRef.
- X. Huang, B. Li, H. Guo and D. Chen, Dyes Pigm., 2017, 143, 86–94 CrossRef.
- X. Huang, B. Li and H. Guo, J. Alloys Compd., 2017, 695, 2773–2780 CrossRef.
- X. Huang, S. Wang, B. Li, Q. Sun and H. Guo, Opt. Lett., 2018, 43, 1307–1310 CrossRef PubMed.
- B. Li, X. Huang, H. Guo and Y. Zeng, Dyes Pigm., 2018, 150, 67–72 CrossRef.
- H. Guo, B. Devakumar, B. Li and X. Huang, Dyes Pigm., 2018, 151, 81–88 CrossRef.
- L. Sun, B. Devakumar, B. Li, J. Liang, H. Guo and X. Huang, RSC Adv., 2018, 8, 23284–23293 RSC.
- X. Huang and H. Guo, Dyes Pigm., 2018, 152, 36–42 CrossRef.
- B. Li, S. Wang, Q. Sun, C. Lu, H. Guo and X. Huang, Dyes Pigm., 2018, 154, 252–256 CrossRef.
- H. Guo and X. Huang, J. Alloys Compd., 2018, 764, 809–814 CrossRef.
- B. Wang, H. Lin, J. Xu, H. Chen and Y. Wang, ACS Appl. Mater. Interfaces, 2014, 6, 22905–22913 CrossRef PubMed.
- Y. Jin, Y. Hu, H. Wu, H. Duan, L. Chen, Y. Fu, G. Ju, Z. Mu and M. He, Chem. Eng. J., 2016, 288, 596–607 CrossRef.
- F. Xue, Y. Hu, L. Chen, H. Wu, G. Ju, T. Wang and L. Yang, Ceram. Int., 2017, 43, 15141–15145 CrossRef.
- L. Meng, L. Liang and Y. Wen, J. Mater. Sci.: Mater. Electron., 2014, 25, 2676–2681 CrossRef.
- H. Chen, H. Lin, Q. Huang, F. Huang, J. Xu, B. Wang, Z. Lin, J. Zhou and Y. Wang, J. Mater. Chem. C, 2016, 4, 2374–2381 RSC.
- Y. Zhu, L. Cao, M. G. Brik, X. Zhang, L. Huang, T. Xuan and J. Wang, J. Mater. Chem. C, 2017, 5, 6420–6426 RSC.
- L. Huang, Y. Liu, J. Yu, Y. Zhu, F. Pan, T. Xuan, M. G. Brik, C. Wang and J. Wang, ACS Appl. Mater. Interfaces, 2018, 10, 18082–18092 CrossRef PubMed.
- M. Zhu, Y. Pan, L. Xi, H. Lian and J. Lin, J. Mater. Chem. C, 2017, 5, 10241–10250 RSC.
- M. Zhu, Y. Pan, Y. Huang, H. Lian and J. Lin, J. Mater. Chem. C, 2018, 6, 491–499 RSC.
- A. Fu, Q. Pang, H. Yang and L. Zhou, Opt. Mater., 2017, 70, 144–152 CrossRef.
- G. Jiang, B. Yang, G. Zhao, Y. Liu, J. Zou, H. Sun, H. Ou, Y. Fang and J. Hou, Opt. Mater., 2018, 83, 93–98 CrossRef.
- J. Zhong, D. Chen, X. Chen, K. Wang, X. Li, Y. Zhu and Z. Ji, Dalton Trans., 2018, 47, 6528–6537 RSC.
- J. Zhong, S. Zhou, D. Chen, J. Li, Y. Zhu, X. Li, L. Chen and Z. Ji, Dalton Trans., 2018, 47, 8248–8256 RSC.
- L. Li, W. Chang, W. Chen, Z. Feng, C. Zhao, P. Jiang, Y. Wang, X. Zhou and A. Suchocki, Ceram. Int., 2017, 43, 2720–2729 CrossRef.
- X. Huang, J. Liang, B. Li, L. Sun and J. Lin, Opt. Lett., 2018, 43, 3305–3308 CrossRef PubMed.
- J. Liang, L. Sun, B. Devakumar, S. Wang, Q. Sun, H. Guo, B. Li and X. Huang, RSC Adv., 2018, 8, 27144–27151 RSC.
- X. Huang, J. Alloys Compd., 2017, 690, 356–359 CrossRef.
- P. Du, L. Luo, X. Huang and J. S. Yu, J. Colloid Interface Sci., 2018, 514, 172–181 CrossRef PubMed.
- P. Du, X. Huang and J. S. Yu, Inorg. Chem. Front., 2017, 4, 1987–1995 RSC.
- Z. Lu, T. Huang, R. Deng, H. Wang, L. Wen, M. Huang, L. Zhou and C. Yao, Superlattices Microstruct., 2018, 117, 476–487 CrossRef.
- A. Fu, C. Zhou, Q. Chen, Z. Lu, T. Huang, H. Wang and L. Zhou, Ceram. Int., 2017, 43, 6353–6362 CrossRef.
- A. Fu, A. Guan, D. Yu, S. Xia, F. Gao, X. Zhang, L. Zhou, Y. Li and R. Li, Mater. Res. Bull., 2017, 88, 258–265 CrossRef.
- K. Li, H. Lian and R. V. Deun, J. Lumin., 2018, 198, 155–162 CrossRef.
- B. Li and X. Huang, Ceram. Int., 2018, 44, 4915–4923 CrossRef.
- Q. Sun, S. Wang, B. Li, H. Guo and X. Huang, J. Lumin., 2018, 203, 371–375 CrossRef.
- Q. Peng, R. Cao, Y. Ye, S. Guo, Z. Hu, T. Chen and G. Zheng, J. Alloys Compd., 2017, 725, 139–144 CrossRef.
- C. Yang, Z. Zhang, G. Hu, R. Cao, X. Liang and W. Xiang, J. Alloys Compd., 2017, 694, 1201–1208 CrossRef.
- S. Liang, M. Shang, H. Lian, K. Li, Y. Zhang and J. Lin, J. Mater. Chem. C, 2016, 4, 6409–6416 RSC.
- S. Liang, M. Shang, H. Lian, K. Li, Y. Zhang and J. Lin, J. Mater. Chem. C, 2017, 5, 2927–2935 RSC.
- R. Cao, Z. Shi, G. Quan, Z. Luo, P. Tang, H. Ao and X. Yu, Opt. Mater., 2016, 57, 212–216 CrossRef.
- R. Cao, X. Liu, K. Bai, T. Chen, S. Guo, Z. Hu, F. Xiao and Z. Luo, J. Lumin., 2018, 197, 169–174 CrossRef.
- R. Cao, X. Ceng, J. Huang, H. Ao, G. Zheng, X. Yu and X. Zhang, Opt. Mater., 2016, 62, 706–710 CrossRef.
- G. Blasse, Phys. Lett. A, 1968, 28, 444–445 CrossRef.
- D. L. Dexter, J. Chem. Phys., 1953, 21, 836–850 CrossRef.
- J. He, X. Guo, Y. Chen, R. Shi, Y. Huang, J. Zhang, Y. Wang and Z. Liu, Chem.–Eur. J., 2018, 24, 1287–1294 CrossRef PubMed.
- Q. Shao, H. Ding, L. Yao, J. Xu, C. Liang and J. Jiang, RSC Adv., 2018, 8, 12035–12042 RSC.
- X. Huang and H. Guo, Dyes Pigm., 2018, 154, 82–86 CrossRef.
- U. B. Humayoun, S. N. Tiruneh and D.-H. Yoon, Dyes Pigm., 2018, 152, 127–130 CrossRef.
- R. Cao, J. Zhang, W. Wang, Z. Hu, T. Chen, Y. Ye and X. Yu, Mater. Res. Bull., 2017, 87, 109–113 CrossRef.
- R. Cao, X. Ceng, J. Huang, X. Xia, S. Guo and J. Fu, Ceram. Int., 2016, 42, 16817–16821 CrossRef.
- X. Ding, Q. Wang and Y. Wang, Phys. Chem. Chem. Phys., 2016, 18, 8088–8097 RSC.
- S. Zhang, Y. Hu, H. Duan, L. Chen, Y. Fu, G. Ju, T. Wang and M. He, RSC Adv., 2015, 5, 90499–90507 RSC.
- G. Hu, X. Hu, W. Chen, Y. Cheng, Z. Liu, Y. Zhang, X. Liang and W. Xiang, Mater. Res. Bull., 2017, 95, 277–284 CrossRef.
- B. Wang, H. Lin, F. Huang, J. Xu, H. Chen, Z. Lin and Y. Wang, Chem. Mater., 2016, 28, 3515–3524 CrossRef.
- X. Zhang, J. Nie, S. Liu, Y. Li and J. Qiu, J. Am. Ceram. Soc., 2017, 101, 1576–1584 CrossRef.
- S. Zhang, Y. Hu, H. Duan, Y. Fu and M. He, J. Alloys Compd., 2017, 693, 315–325 CrossRef.
- S. Zhang and Y. Hu, J. Lumin., 2016, 177, 394–401 CrossRef.
- W. Chen, Y. Cheng, L. Shen, C. Shen, X. Liang and W. Xiang, J. Alloys Compd., 2018, 762, 688–696 CrossRef.
- M. G. Brik, S. J. Camardello, A. M. Srivastava, N. M. Avram and A. Suchocki, ECS J. Solid State Sci. Technol., 2016, 5, R3067–R3077 CrossRef.
- Y. Chen, K. Wu, J. He, Z. Tang, J. Shi, Y. Xu and Z. Liu, J. Mater. Chem. C, 2017, 5, 8828–8835 RSC.
- M. G. Brik, S. J. Camardello and A. M. Srivastava, ECS J. Solid State Sci. Technol., 2015, 4, R39–R43 CrossRef.
| This journal is © The Royal Society of Chemistry 2018 |

