 Open Access Article
Improved thermal properties of epoxy resin modified with polymethyl methacrylate-microencapsulated phosphorus-nitrogen-containing flame retardant
Lijie Qu a,
Chunling Zhang
 *a,
Peihong Li
 a,
Xueyan Dai
 a,
Tianlu Xu
 a,
Yanlong Suia,
Jinjia Gub and
Yanli Dou*a
aKey Laboratory of Automobile Materials, Ministry of Education, College of Materials Science and Engineering, Jilin University, Changchun 130025, P. R. China. E-mail: clzhang@jlu.edu.cn; douyl@jlu.edu.cn
bJiangsu Oseaguard Building Materials & Technology Development Co., Ltd, Nanjing 210000, P. R. China
First published on 23rd August 2018
Abstract
Epoxy resin (EP) composites with improved thermal resistance were fabricated. To solve the problem of low thermal resistance derived from phosphazene flame-retardant additives, we designed a system based on flame-retardant microcapsules P(H), with hexaphenoxycyclotriphosphazene as the core and polymethyl methacrylate as the shell. The core–shell structure was characterized and confirmed. The thermal resistance of the cured EP composites containing 1 wt% P(H) microcapsules was improved because of the increased glass transition temperatures. The P(2.75H)/EP composites can reach a limited oxygen index of 30.5% and V-1 rating in UL-94 tests. Heat and gas release rates were reduced during combustion tests. Residual images implied that the P(H) microcapsules may promote the formation of a flame-retardant char layer. Pyrolysis analysis demonstrated that the P(H) microcapsules can decompose in two procedures to produce flame-retardant gas components. Therefore, the flame-retardant mechanism involved the flame inhibition effect in the gas phase, and the charring effect in the condensed phase.
1. Introduction
Epoxy resin (EP) is a widely used thermosetting polymer with many desirable properties, such as high adhesion, good chemical and corrosion resistance, excellent dimension stability, and high tensile strength and modulus.1,2 These advanced characteristics enable various applications, including adhesives, surface coatings, laminated materials, and reinforced composites, for EP.3 However, the generally used EPs are inherently flammable, which limits the resins' further use.4 Traditionally, halogenated compounds are developed to prepare EPs with superior flame retardancy. Nevertheless, this kind of system containing bromine or chlorine involves corrosive or poisonous gas release during combustion.5 Given the pursuit of an environment-friendly society and human health, the development of halogen-free flame retardants has attracted great attention from the scientific and industrial fields.6In the past several years, phosphorus-containing compounds have been regarded as highly efficient and promising halogen-free flame retardants for modifying EPs. Phosphazene, a kind of cyclic compound containing phosphorus and nitrogen, has been reported to exhibit excellent flame retardancy because of the compound's synergies in the condensed phase and gas phase during the combustion process.7–9 Currently, a great interest is focused on the design of phosphazene and other derivative-containing systems through reactive or additive approaches. As depicted in some reports, incorporating active chemical units containing phosphazenes that can react with EPs during the curing process is considered as an effective route for imparting permanent flame retardancy.8,10–12 Nevertheless, the synthesis and characterization procedures of existing raw materials are exceedingly complicated. Many phosphazene flame-retardant additives are restricted by their poor compatibility with EPs because of the shortage of active groups or excessive addition that causes human disease.13–15 These drawbacks instigate decreases in the EP composites' thermal properties, including the deterioration of the glass transition temperature (Tg) relative to those of pure EPs; this deterioration limits the range of application of EP composites in practical life. For example, in our previous works, a cyclic phosphazene named as hexaphenoxycyclotriphosphazene (HPCTP) that contains phenoxyl groups was successfully synthesized and added to modified EPs separately9 or along with other flame-retardant additives.4,6 However, the Tg of the EP composites deteriorated distinctly. The search for an effective mean to use additive phosphazenes in manufacturing flame-retardant EP composites with guaranteed thermal resistance is highly worth studying.
Microencapsulation is a promising method for overcoming the above-mentioned difficulties. It is usually conducted by coating a layer of organic or inorganic shell materials over valid gas, liquid, or solid core materials. Not only can the technique change the apparent shape of core particles, it can also improve the typical properties, including the compatibility with composites, and maintain the interior chemical characteristics. Therefore, some studies have explored the fabrication of microencapsulated phosphazene additives to obtain effective flame retardants possessing solved compatibility with the matrix. Cao et al.15 reported an encapsulated HPCTP flame retardant with the polyamide, which was coded as MH and used to modify the bismaleimide resins; the outstanding flame retardancy was obtained without deteriorating the heat resistance. As a highly commonly utilized polymer shell material of microcapsules in recent years, polymethyl methacrylate (PMMA) has been widely applied for toughness modification along with inorganic nanoparticles on EPs because of its similar solubility parameters with EPs, the nontoxicity, good chemical resistance, and low price.16,17 However, the thermal or combustion performance of PMMA as a shell coated over an organic flame retardant has not been widely investigated.
In this paper, a flame-retardant microcapsule defined as P(H) was successfully synthesized by emulsion polymerization with HPCTP as core and PMMA as shell. The prepared microcapsules were investigated through characterization methods and used to fabricate EP composites via a filling modification. PMMA shells of the microcapsules played an important part in the heating and combustion process of the EP composites, and the thermal properties of the EP composites were notably improved with a low content of the flame-retardant microcapsules.
2. Experimental
2.1 Materials
HPCTP was commercially obtained from Zibo Lanyin Chemical Co., Ltd., China. Methyl methacrylate (MMA), 2,2′-azobisisobutyronitrile (AIBN), and ethylene glycol dimethyl acrylate (EGDMA) were purchased from Shisi Hewei Chemical Co., Ltd., China. Sodium dodecyl benzene sulfonate (SDBS) was purchased from Guangfu Jingxi Chemical Co., Ltd., China. Ethanol was acquired from Beijing Chemical Reagent Co., Ltd., China. Diglycidyl ether of bisphenol A (DGEBA; commercial named E-51) was supplied by Wuxi Dic Epoxy Co., Ltd., China. The curing agent 4,4′-diamino diphenylmethane (DDM) was supplied by Sinopharm Chemical Reagent Co., Ltd., China. All the reagents were used without further purification.2.2 Synthesis of P(H) microcapsule
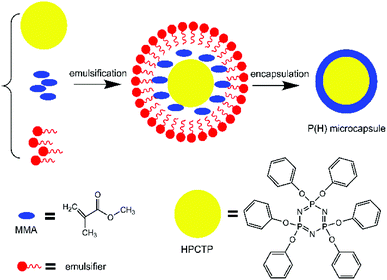
The microcapsules with PMMA as shell and HPCTP as core were synthesized by in situ emulsion polymerization of MMA monomers over the surface of HPCTP. First, specific contents of HPCTP (2.0, 2.25, 2.5, and 2.75 g) and emulsifier SDBS were dispersed in ethanol in a three-necked flask equipped with a mechanical stirrer at 85 °C. When the solution became homogeneous, the emulsion pH was adjusted to 4–5. After 30 min stirring, the core material MMA (25 mL) was dropwise added into the mixture, followed by initiator AIBN, and crossing agent EGDMA. Then, the suspension was stirred and heated at 75 °C for 4 h of polymerization. After the reaction was completed, the product was washed and dried under vacuum. The formation process of P(H) microcapsules is shown in Fig. 1.2.3 Preparation of P(H)/EP composites
The P(H)/EP composites were prepared via a thermal curing procedure. The P(H) microcapsules with a series amounts of HPCTP mentioned above were incorporated with EP monomers (DGEBA) at a content of 1 wt% through mechanical stirring at 105 °C. When the whole system became homogenous and transparent with a low viscosity, a stoichiometric amount of curing agent (DDM) was added into the dispersion through continuous stirring to obtain a homogenous solution. Afterward, the device was degassed at 85 °C under vacuum to remove all the bubbles produced in the system. Thereafter, the resulting mixture was transferred to aluminum molds preheated at 105 °C and coated with a release agent for curing. The curing process was set as follows: 105 °C for 2 h, 155 °C for 2 h, and 199 °C for 2 h. After the molds were slowly cooled to room temperature, the samples were retrieved for the following tests. HPCTP/EP and pure EP thermosets were prepared with the similar method.2.4 Characterization
The chemical compositions and functional groups of HPCTP and P(H) microcapsules were detected by Fourier transform infrared (FTIR) spectroscopy (Bruker Vertex 70, German) at room temperature. The samples were ground and mixed with potassium bromide powder and pressed into flasks.The surface morphological characteristics of P(H) microcapsules and residues of P(H)/EP composites were examined under scanning electron microscopy (SEM; FEI XL30 ESEM FEG, USA). The specimens were previously coated with a conductive layer of gold.
The encapsulation morphologies of the P(H) microcapsules were observed by a transmission electron microscopy (TEM; FEI Tecnai F30 G2, USA). The particles were dispersed in ethanol before they were transferred onto the top grids.
The thermal properties of P(H)/EP composites were analyzed by a differential scanning calorimetry (DSC; TA Q20, USA). In all cases, 2–5 mg samples were heated under a nitrogen atmosphere from ambient temperature to 250 °C at a heating rate of 10 °C min−1.
The thermal stabilities of P(H)/EP composites were studied by thermogravimetric analysis (TGA; Perkin-Elmer, USA). Approximately 10 mg samples were heated from 50 °C to 800 °C at a heating rate of 10 °C min−1 under a nitrogen atmosphere.
The limiting oxygen index values of P(H)/EP composites were measured using a limit oxygen index (LOI) meter (FESTEC JF-3, Korea) with sheet dimensions of 80 mm × 6.5 mm × 3.2 mm in accordance with ASTMD 2863-97.
The UL-94 vertical burning properties of P(H)/EP composites were examined on a vertical burning tester (Motis Fire Technology UL94-X, China) with sheet dimensions of 125 mm × 12.7 mm × 3.2 mm in accordance with ASTMD 3801.
Cone calorimetric measurements of P(H)/EP composites were conducted on a cone calorimeter (Fire Testing Technology FTT0007, UK) with flat dimensions of 100 mm × 100 mm × 3 mm in accordance with ISO 5660.
To recognize the pyrolysis fragments of P(H), EP, and P(H)/EP composites, we carried out Py-GC/MS analysis by gas chromatography-mass spectrometry (GC/MS, Agilent 5975, USA) equipped with a pyrolyzer (Shimadzu, Pyr-4A, Japan). Helium was utilized as carrier gas for the volatile products. The injector temperature was 250 °C, the temperature of the GC/MS interface was 280 °C, and the cracker temperature was 500 °C.
Dynamic thermomechanical properties of P(H)/EP composites were investigated via a dynamic thermomechanical analyzer (DMA, 01-db Metravib DMA+450, France). The composites were prepared into bars and heated from ambient temperature to 250 °C under a tension model of operation.
The mechanical properties of P(H)/EP composites were measured by an electronic universal testing machine (WSM-5KN, China) with a dumbbell-shaped specimen in accordance with GBT 2567-2008.
3. Results and discussion
3.1 Compositions and morphologies of P(H) microcapsules
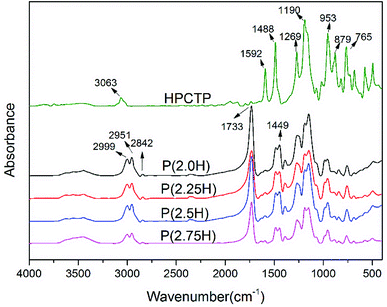
P(H) microcapsules were synthesized by emulsion polymerization using MMA monomers to react on the surface of HPCTP particles. The P(H) microcapsules containing different contents of HPCTP (2.0, 2.25, 2.5, and 2.75 g) were defined as P(2.0H), P(2.25H), P(2.5H), and P(2.75H), respectively. The chemical structures of HPCTP and P(H) microcapsules were confirmed through FTIR spectra in Fig. 2. In the spectrum of HPCTP, the distinct absorption peak at 1269 cm−1 belongs to the P![[double bond, length as m-dash]](https://www.rsc.org/images/entities/char_e001.gif) N stretching vibration of phosphazene rings. The peaks at 1190, 953, and 879 cm−1 were assigned to the P–O–C bond. Simultaneously, the presence of phenoxy groups was observed by the corresponding characteristic absorption peak at 3063 cm−1 for the C–H stretching vibration, at 1592 and 1488 cm−1 for the skeleton vibration, and at 765 cm−1 for the monosubstituted out-of-plane bending vibration. These peaks can be observed at the spectra of microcapsules, which indicate the intact structure of HPCTP. The typical peaks of PMMA successfully appeared in the spectra of microcapsules. The peak at 1733 cm−1 was caused by C
N stretching vibration of phosphazene rings. The peaks at 1190, 953, and 879 cm−1 were assigned to the P–O–C bond. Simultaneously, the presence of phenoxy groups was observed by the corresponding characteristic absorption peak at 3063 cm−1 for the C–H stretching vibration, at 1592 and 1488 cm−1 for the skeleton vibration, and at 765 cm−1 for the monosubstituted out-of-plane bending vibration. These peaks can be observed at the spectra of microcapsules, which indicate the intact structure of HPCTP. The typical peaks of PMMA successfully appeared in the spectra of microcapsules. The peak at 1733 cm−1 was caused by C![[double bond, length as m-dash]](https://www.rsc.org/images/entities/char_e001.gif) O stretching vibration. The bands from 2999 cm−1 to 2842 cm−1 and the peak at 1449 cm−1 were due to the vibration of methyls and methylenes on the chains of PMMA.9,18,19 The FTIR results clearly indicated the structural formation of shell material PMMA over the core material HPCTP.
O stretching vibration. The bands from 2999 cm−1 to 2842 cm−1 and the peak at 1449 cm−1 were due to the vibration of methyls and methylenes on the chains of PMMA.9,18,19 The FTIR results clearly indicated the structural formation of shell material PMMA over the core material HPCTP.
Fig. 3 illustrates the surface morphological characteristics of HPCTP and P(H) microcapsules in SEM images. The raw HPCTP particles exhibited smooth cuboid crystal features with sharp ends, a relative nonuniformity, and large sizes; the particles can hardly disperse throughout the EP matrix evenly (Fig. 3(a)).20,21 After being encapsulated by the PMMA shells (Fig. 3(b–e)), the particles acquired loose and crumby morphologies with shrunken diameters; the initial HPCTP crystals disappeared into the wraps. The P(2.0H) microcapsules yielded the smallest dimension among those of all the samples. However, the core–shell structures were not formed (Fig. 3(b)). As the content of HPCTP rose from 2.0 g to 2.75 g, the particle agglomeration phenomenon weakened, and the grain sizes gradually became well proportioned, with the same additions of other agents. A homogeneous particle distribution of additives can thoroughly reinforce the EP matrix. This observation suggests that PMMA shell materials formed over the surface of HPCTP cores to achieve the microcapsules.22
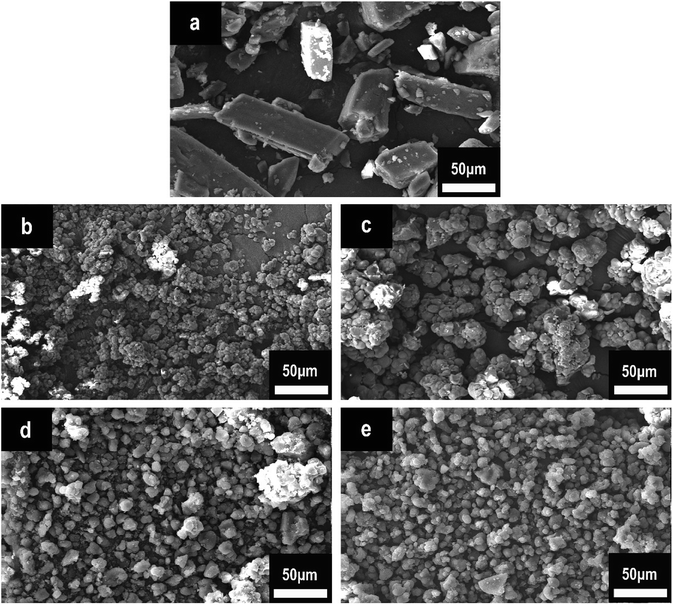 | ||
| Fig. 3 SEM images of HPCTP and P(H) microcapsules: (a) HPCTP, (b) P(2.0H), (c) P(2.25H), (d) P(2.5H), and (e) P(2.75H). | ||
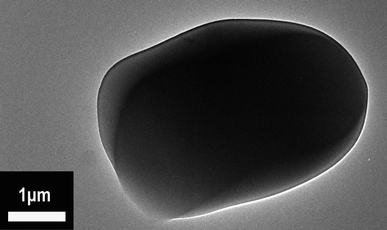
Fig. 4 reveals the TEM photograph of the P(2.75H) microcapsule. The dark HPCTP block inside is obviously crapped by a layer of lighter substance, which is the PMMA coating material. The difference between the shaded and light regions originate from the various masses and thicknesses of the core and shell materials of the sample; such difference is called mass thickness contrast in TEM images. The morphology indicates that our adopted encapsulation method is effective.23 According to the FTIR, SEM, and TEM results, the P(H) microcapsules have been successfully synthesized. The uniform sizes of core–shell particles are conducive in distributing evenly and maintaining the properties of EP composites, such as thermal properties, flame retardancy, and mechanical performances.
3.2 Thermal behaviors of P(H)/EP composites
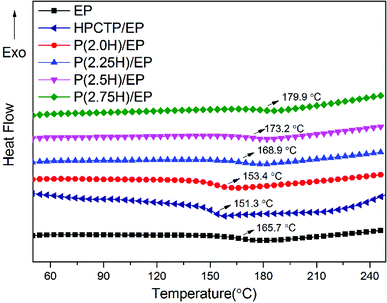
HPCTP and P(H) microcapsules were utilized to prepare EP composites at 1 wt% additive amount. Fig. 5 shows the DSC curves of pure EP, HPCTP/EP and P(H)/EP composites, and the Tg values of the samples were marked on the graph and listed in Table 1. In Fig. 5, all the samples were observed to be fully cured without any curing peaks and display single Tg values in the experimental temperature range. The pure EP shows a Tg value of 165.7 °C. With the 1 wt% blend of HPCTP, the Tg value decreases to 151.3 °C. The HPCTP without reactive groups enlarges the intermolecular distance and free volume of EP networks, thereby reducing the cross-linking density.| Samples | Tg (°C) | T5 wt% (°C) | T10 wt% (°C) | T50 wt% (°C) | Residue at 800 °C (wt%) |
|---|---|---|---|---|---|
| EP | 165.7 | 376.2 | 381.1 | 409.0 | 17.5 |
| HPCTP/EP | 151.3 | 367.8 | 378.1 | 409.1 | 18.4 |
| P(2.0H)/EP | 153.4 | 370.3 | 377.9 | 405.8 | 18.5 |
| P(2.25H)/EP | 168.9 | 371.9 | 379.4 | 410.0 | 19.6 |
| P(2.5H)/EP | 173.2 | 374.4 | 380.5 | 407.6 | 19.4 |
| P(2.75H)/EP | 179.9 | 376.6 | 382.3 | 410.2 | 19.9 |
The other samples with the same blend of P(H) microcapsules show a trend of promotion. For the epoxy sample with P(2.0H) microcapsules, Tg value improves to 153.4 °C, which is still lower than that of the pure EP. This phenomenon results from the incorporation of bulky HPCTP that have not been fully coated with PMMA layers. Therefore, the enhancement is unsatisfactory. Interestingly, the samples blended with the microcapsules containing 2.25, 2.5, and 2.75 g HPCTP achieved increasing Tg values as HPCTP increased, especially the 1 wt% blend of P(2.75H) microcapsule with a Tg value of 179.9 °C. The result differs from those of HPCTP/EP sample and previous references that showed distinct decreases when phosphazene flame retardants were added to EPs.4,6,9 By contrast, with high size uniformity among the microcapsules incorporated into the system, the particles can easily disperse evenly through the gaps of EP networks without regional agglomeration of HPCTP or PMMA. As a result, the cross-linking density of EP composites is improved. Besides, the PMMA chains possess similar solubility parameters and compatibility with EP matrixes. When blended into systems, the PMMA shells of P(H) microcapsules assembled with the matrixes and favorably promoted cross-linking to form a compact structure. Moreover, the PMMA-coated HPCTP exerts a heightened steric hindrance effect on polymer chains when heated; this phenomenon notably impedes the thermal movement of segments of the EP networks. All the reasons above contribute to the enhanced Tg values with increased HPCTP loadings observed in the P(H) microcapsules during the DSC tests.24 The DSC results also imply that after blending only 1 wt% P(H) microcapsules, the EP composites acquired a better thermal resistance than that of pure EP. This result also means that the P(H) microcapsules with PMMA shell materials impacted the glass transition behavior of the EP networks. Therefore, this microencapsulation method using PMMA as shell to coat the HPCTP flame retardant is greatly efficient in improving the thermal resistance and operating temperature of EP composites.
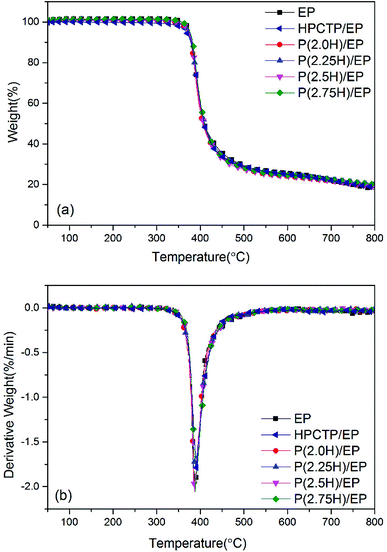
Fig. 6 presents the thermal stability of pure EP, HPCTP/EP and P(H)/EP composites as scrutinized by TGA test under a nitrogen atmosphere. The TGA curves and derivative TGA (DTG) curves are also summarized in Table 1. All the samples displayed only one sharp weight loss stage, beginning at approximately 355 °C, which corresponds to the breakdown of EP main chains. At a yield of 1 wt%, the additives did not change the thermal decomposition of EP because of hardly any distinction between the composites and the control. The weight loss temperatures corresponding to 5, 10, and 50 wt% (T5 wt%, T10 wt%, and T50 wt%) were lower than the data of pure EP, for the T5 wt% and T10 wt% data of HPCTP/EP especially; this decreased temperatures were attributed to the structurally unstable HPCTP, which primarily decomposes at P–O–C bonds (Table 1).25 However, for the other samples with P(H) microcapsules blended, this deterioration was not as distinct as those in the other studies shown.4,26,27 After PMMA polymers were used to cover the HPCTP particle surfaces, the additives were improved in thermal stability through the chemical polymeric long chains, which can protect the inner P–O–C structures from decomposing at high temperature. Besides, the T5 wt%, T10 wt%, and T50 wt% values in the P(H)/EP composites were observed to slightly rise with increasing HPCTP content in P(H) microcapsules. This phenomenon can be explained by the formation of further uniform sizes of P(H) microcapsules when the contents of HPCTP increased; this modification can thoroughly help reinforce the EP composites. An improvement in char yield of all the modified EPs at 800 °C was also noted. Higher char yields originate from a better capacity for residue formation; this capacity can afford EPs with the flame-retardant property.28 Overall, the P(H) microcapsules with PMMA shells can help maintain the thermal stability of EP composites. Given the DSC and TGA results, we believe that P(H) microcapsules with PMMA shells can enhance the thermal properties of EP composites.
3.3 Ignition behaviors of P(H)/EP composites
LOI and vertical burning tests (UL-94) are valuable methods for evaluating the ignition behavior of EP thermosets. The corresponding results are shown in Table 2. The LOI value of the control EP was 26.9%. With the blend of 1 wt% HPCTP, the LOI value was distinctly improved to 33.5%, which implied the excellent flame retardancy of HPCTP. For the P(H) microcapsules added EP composites, the LOI values were all lower than that of HPCTP/EP samples. Whereas, the data increased gradually as the increase of HPCTP amounts within the microcapsules, up to over 30%, corresponding to P(2.75H)/EP composite, and reaching approximately 30.5%. A similar relationship was observed in the case of UL-94 tests, although with only 1 wt% blend of additives. The pure EP began to dramatically burn after the initial 10 s fire ignition and continuously combusted until the whole specimen was consumed. Besides, along with the burning, a large amount of black smoke and evident dripping was observed. Given the additions of HPCTP and P(H) microcapsules, the composites exhibited an improved fire performance. With the blend of HPCTP, there was no dripping observed. In addition, in the case of P(2.75H)/EP, the fire changed smaller until it was extinguished in the first and second ignitions, which lasted for less than the standard durations without any dripping and reached a UL-94 V-1 rating. These phenomena indicate the beneficial effect of P(H) microcapsules on the flame properties of the EP composites.| Samples | LOI (%) | UL-94 (3 mm) | Dripping |
|---|---|---|---|
| EP | 26.9 | No rating | Yes |
| HPCTP/EP | 33.5 | No rating | No |
| P(2.0H)/EP | 27.9 | No rating | No |
| P(2.25H)/EP | 28.1 | No rating | No |
| P(2.5H)/EP | 29.8 | No rating | No |
| P(2.75H)/EP | 30.5 | V-1 | No |
3.4 Flame retardancy of P(H)/EP composites
To thoroughly explain the mechanism of flame retardancy enhanced by P(H) microcapsules, cone calorimeter tests were conducted on pure EP, HPCTP/EP, and P(2.75H)/EP composites. This method has been widely used to evaluate the fire behaviors of composites in true-world fire conditions, which can provide sufficient and quantitative analysis and data. The curves of heat release rate (HRR), total heat release (THR), carbon monoxide (CO) production, and carbon dioxide (CO2) production are shown in Fig. 7 and 8. The main characteristic parameters, such as the time to ignition (TTI), the peak of HRR (PHRR), THR, average of effective heat of combustion (av-EHC), and percentages of mass loss (ML) are summarized in Table 3.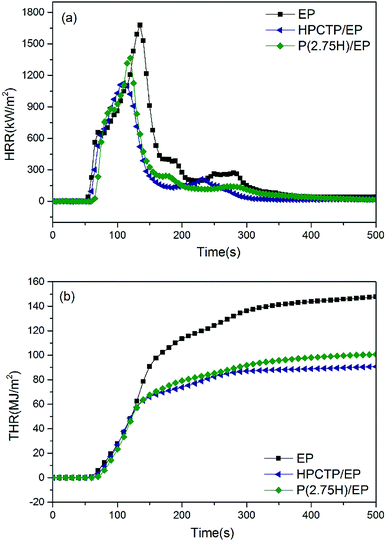 | ||
| Fig. 7 Heat release rate curves (a) and total heat release curves (b) of pure EP, HPCTP/EP, and P(2.75H)/EP composite. | ||
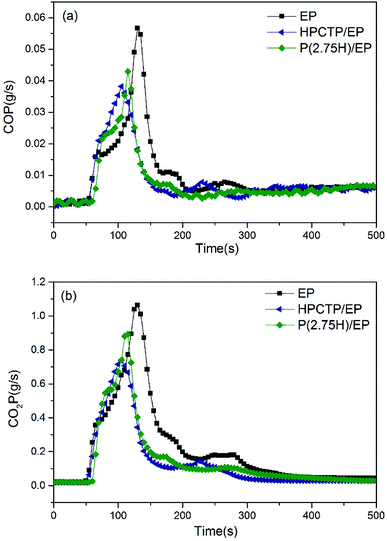 | ||
| Fig. 8 CO production curves (a) and CO2 production curves (b) of pure EP, HPCTP/EP, and P(2.75H)/EP composite. | ||
| Samples | TTI (s) | PHRR (kW m−2) | THR (MJ m−2) | av-EHC (MJ kg−1) | Mass loss (wt%) | FIE (%) | CE (%) | BAPE (%) |
|---|---|---|---|---|---|---|---|---|
| EP | 40 | 1677.9 | 148.0 | 33.7 | 93.3 | — | — | — |
| HPCTP/EP | 47 | 1125.5 | 90.8 | 25.7 | 87.9 | 23.7 | 5.8 | −9.3 |
| P(2.75H)/EP | 58 | 1365.1 | 100.7 | 26.2 | 90.2 | 22.2 | 3.3 | −19.6 |
TTI is used to determine the influence of flame retardant on ignitability.29 Compared with the control EP, the TTI values of the HPCTP/EP and P(2.75H)/EP composite were postponed from 40 s to 47 s and 58 s, which indicates the enhancement of thermal stability in actual flame environment (Table 3).
HRR is a highly important parameter for predicting fire hazard. Fig. 7(a) presents curves of HRR of pure EP, yielded 1 wt% HPCTP/EP, and P(2.75H)/EP composites. Pure EP burns rapidly after ignition, and HRR reaches a peak with a PHRR of 1677.9 kW m−2. With only 1 wt% incorporation of HPCTP, we noted an obvious decrease of PHRR to 1125.5 kW m−2, which is much lower than that of EP. However, the initial HRR time and the PHRR time were ahead of time than the data of pure EP, which might be attributed to the inner easily decomposed P–O–C structures of HPCTP. After incorporating 1 wt% P(2.75H) microcapsules, PHRR was increased to 1365.1 kW m−2, which was due to anti-fireproof PMMA shells, but still lower than the figure of pure EP samples. At the same time, the initial HRR time and the PHRR time were also altered in accordance with the TTI values. PMMA chains contain no flame-retardant groups, so P(2.75H) microcapsules yield worse flame retardancy than their core materials. However, on one side, PMMA shells covered flame retardants would defer the decomposition of HPCTP. On the other, PMMA chains with similar compatibility as EP macromolecules would facilitate the formation of compact structure, which would be hard to move when fire heating.30 At the same time, the THR value of the P(2.75H)/EP composite (100.7 MJ m−2) was also sharply decreased than that of pure EP (148.0 MJ m−2), and slightly worse than the effect of HPCTP/EP (90.8 MJ m−2), with a more mitigatory slope of the THR curve in Fig. 7(b). The reduction of HRR, PHRR, and THR compared with that of raw EP can be ascribed to the pyrolysis products of HPCTP from P(H) microcapsules. The interior core materials are obtained from P![[double bond, length as m-dash]](https://www.rsc.org/images/entities/char_e001.gif) N bonds that may decompose into PO2˙ and PO free radicals and react with flammable H˙ and OH˙ free radicals to prevent further flame. Nitrogen-containing pyrolysis gas becomes effective with the CO2 released from the PMMA shells and the matrix, and these gases dilute the concentration of flammable volatile matters. Therefore, the total heat released is suppressed during combustion.
N bonds that may decompose into PO2˙ and PO free radicals and react with flammable H˙ and OH˙ free radicals to prevent further flame. Nitrogen-containing pyrolysis gas becomes effective with the CO2 released from the PMMA shells and the matrix, and these gases dilute the concentration of flammable volatile matters. Therefore, the total heat released is suppressed during combustion.
The curves of CO and CO2 production can be utilized to describe the emission of gases generated by combustion. In Fig. 8(a), compared with the CO production curve of the control EP, the curve of HPCTP/EP shows an obvious decreased production at an advanced after ignition; this result indicates that the HPCTP additive might reduce the flammability and fire toxicity of the gases of EP, while it would shorten the escape time from poisonous gas. The P(2.75H)/EP performed a weaker reduction at a prolonged time after ignition; this result indicates that the P(2.75H) microcapsule might reduce the flammability to a certain extent, and postpone the release of toxic gas, which may contribute to the prolong of rescue time. A similar conclusion can be achieved from the CO2 production of samples from Fig. 8(b); the result implies the presence of less gas produced more slowly by completely burning samples. This finding suggests that incomplete combustion leads to increased CO production, which is highly hazardous for ignition in the environment. However, CO production is also decreased in Fig. 8(a) and shows the possible effect of the charring effect formed. Concurrently, the distinct reduction of av-EHC values can explain the changes in combustion products.31 Moreover, the reduced CO and CO2 production suggests that additional residual mass remains during testing; thus, the mass loss was decreased from 93.3 wt% to 90.2 wt% (Table 3).7,30
For more directly explaining the possible flame retardant synergistic effects, we referred to the former quantitative assessment methods to analyze the results from cone calorimeter tests.31,32 The flame-retardant effects on combustion can be concluded to three aspects in accordance with the parameters of flame-retardant EP (FREP) and EP: flame inhibition effect (FIE), charring effect (CE), and barrier and protective effect (BAPE). The first one is regarded in gas phase, and the other are in condensed phase. All those effects have been induced as the following three formulas (formula (1)–(3)), and the results are listed in Table 3.
| FIE = 1 − EHCFREP/EHCEP | (1) |
| CE = 1 − MLFREP/MLEP | (2) |
 | (3) |
In Table 3, the flame inhibition effect of P(2.75H)/EP system decreased to 22.2%, which was obvious inferior comparing with 23.7% of HPCTP/EP. The decrease implied that the worse flame retardancy in gas phase. Besides, the charring effect of P(2.75H)/EP was also slightly decreased to 3.3%, indicating a weaker charring effect in condensed phase. In terms of the barrier and protective effect of the samples, HPCTP/EP composites yielded a negative data according to the formula (3), which might be an implication of nonexistent barrier and protective impact. After covered by PMMA shells, the data of shield effect in condensed phase was further from positive number. A positive number of shield effect was presumed to root in the additional reduction of PHRR compared with that of THR, which would be a prove of the barrier and protective effect of the intumescent. Thus, there might not be any barrier and protective effect in condensed phase deriving from neither HPCTP nor P(H) microcapsules. In summary, the synergistic flame-retardant effects of P(2.75H) microcapsules in flame inhibition and charring effect exerted their actions and produced flame retardancy in both gas and condensed phases.31,32
From the results above, we infer that during the burning process, the PMMA shells in the P(H) microcapsules initially release the inner HPCTP cores of the microcapsules. HPCTP would decompose into phosphorous-containing free radicals and nitrogen-containing pyrolysis gases to inhibit flame combustion, and it also decompose the phosphorus-rich fragments in the condensed phase to react with other char matters and promote the formation of charring layers. All the results validated the efficiency of the flame-retardant P(2.75H) microcapsules for EP composites.
3.5 Morphologies of the residues from cone calorimeter tests
After the cone calorimeter tests, some meaningful information was observed for the char residues of samples. The residues from the pure EP are low in amount in a poorly broken status, through which the bottom of the mold can be observed easily (Fig. 9(a)). This result is due to the worse charring ability of the pure EP itself.31 On the contrary, a dense, compact, and firm char is formed with the incorporation of P(2.75H) microcapsule (Fig. 9(c)), which is firmer than that of HPCTP/EP (Fig. 9(b)). The rigid char structure might originate from phosphorus-rich pyrolysis fragments of core materials within microcapsules, which would promote the formation of charring layers in condensed phase when the fire is in contact with the materials.33 Given the visual observation analysis above, we concluded that the P(2.75H) microcapsules can effectively promote the flame retardancy of EP composites. | ||
| Fig. 9 Digital photographs of the char residues after cone calorimeter tests: (a) pure EP, (b) HPCTP/EP, and (c) P(2.75H)/EP composite. | ||
To further explore the flame-retardant charring mechanism, we conducted SEM analysis after cone calorimeter tests. Fig. 10 represents the SEM morphologies of pure EP (a and b), HPCTP/EP (c and d), and P(2.75H)/EP composite (e and f). In Fig. 10(a and b), the char of the control EP after cone calorimeter test shows numerous small through-holes with different sizes. These holes provide many channels for the combustible volatiles generated from the inner matrix to the gaseous phase and thereby increase the combustion intensity and the pyrolysis speed of the matrix.34 By contrast, the HPCTP/EP composite achieves a unique char layer with numerous integrated closed pores inside. Such honeycomb-like structure can be observed in the inner surface (Fig. 10(d)). The P(2.75H)/EP composite also presents a honeycomb-like char structure (Fig. 10(e)). This form serves as temperature grads in the char layer to avoid the feedback of heat from reaching the underlying material.9,35 The improved char structure may favor the subsequent char-forming process to prevent oxygen diffusion or the further decomposition of residue. Therefore, the charring effect might be certificated. The P(2.75H) microcapsules in heating conditions might originally liberate the internal HPCTP flame retardants that separated from PMMA shells. The special char structure was possibly attributed to the phosphorus-rich products with large molecular roots from HPCTP, which react with other combustion fragments and form charring layers in the condensed phase. Thus, the further combustion of composites becomes avoided from the inner substance. All the images and analyses correspond to the results of the cone calorimeter tests and imply that the P(2.75H) microcapsule can improve the flame retardancy of EP composites.
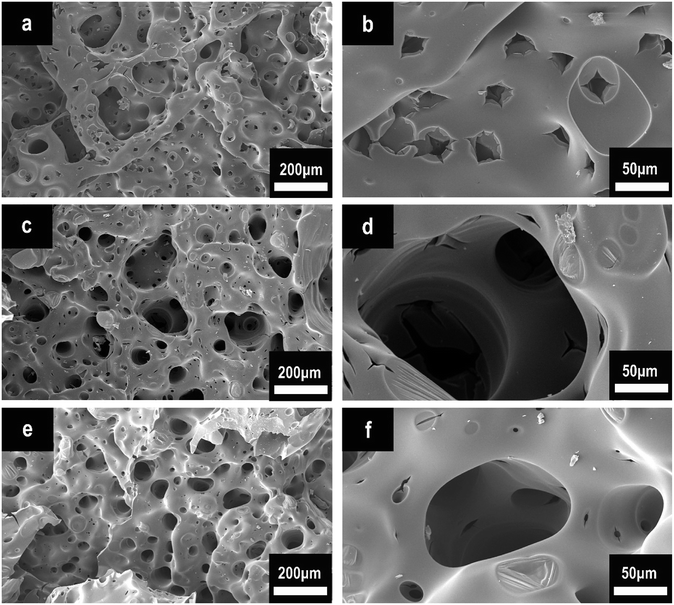 | ||
| Fig. 10 SEM images of char structures obtained by cone calorimeter tests: (a and b) pure EP, (c and d) HPCTP/EP, and (e and f) P(2.75H)/EP composite. | ||
3.6 Py-GC/MS analysis of P(H)/EP composites
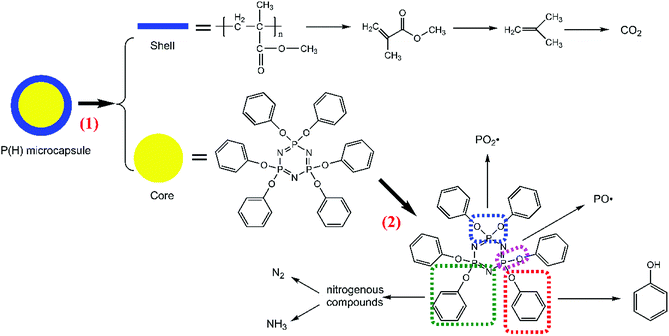
To further disclose the flame-retardant mechanism, we investigated the P(2.5H) microcapsules, pure EP, and P(2.75H)/EP composite by Py-GC/MS with a pyrolysis temperature at 500 °C. The gas chromatography spectra of the P(2.5H) microcapsules, pure EP, and P(2.75H)/EP composite are shown in Fig. 11. The probable chemical formulas are listed in Table 4. The deduced pyrolysis route of P(H) microcapsules is illustrated in Fig. 12.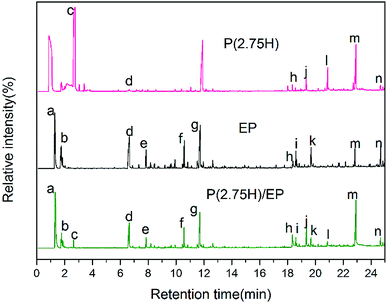 | ||
| Fig. 11 Gas chromatography spectra of the P(2.5H) microcapsules, pure EP, and P(2.75H)/EP composite. | ||
| No | m/z | Assigned formula | Relative area (%) | ||
|---|---|---|---|---|---|
| P(2.75H) | EP | P(2.75H)/EP | |||
| a | 44 | C2H4O | — | 5.291 | 4.137 |
| b | 58 | C3H6O | — | 3.117 | 2.039 |
| c | 100 | C5H8O2 | 39.236 | — | 2.066 |
| d | 94 | C6H6O | 0.286 | 17.57 | 12.356 |
| e | 108 | C7H8O | — | 4.565 | 2.892 |
| f | 136 | C9H12O | — | 7.521 | 5.43 |
| g | 134 | C9H10O | — | 18.305 | 14.131 |
| h | 212 | C15H16O | 0.975 | 2.797 | 3.695 |
| i | 211 | C15H17N | — | 3.624 | 2.448 |
| j | 226 | C16H18O | 1.968 | — | 6.722 |
| k | 225 | C15H15NO | — | 7.121 | 2.755 |
| l | 242 | C16H18O2 | 4.015 | — | 1.746 |
| m | 254 | C17H22N2 | 10.186 | 4.388 | 21.488 |
| n | 314 | C21H30O2 | — | 4.566 | 3.903 |
The peaks named a to n in Fig. 11 correspond to the main pyrolysis fragments of the P(2.75H)/EP composite. Among these peaks, peaks c, d, h, j, l, m, and n were derived from the P(2.75H) microcapsules, whereas the others resulted from pure EP matrix. In Table 4, we obtained the possible partial chemical formulas of the pyrolysis products of P(2.75H)/EP composite. The fragments c that decomposed from the P(2.75H) were the monomers of MMA (C5H8O2, m/z = 100); this result implies that the PMMA shells of the P(2.75H) microcapsules initially detached from the cores, and the chains ruptured into small molecules. The shells not only protected the inner flame retardants from being decomposed initially but also helped carry the HPCTP to rise to the fire of combustion and contributed to flame retardancy. Furthermore, the fragments d attributed to phenols (C6H6O, m/z = 94) should be noted. We proved that the P–O bonds in the HPCTP structures were broken. Aside from the phenols, phosphorus-containing radicals and nitrogenous fragments are also released into the gas phase of the burn system. Besides, the fragments j and l derived from P(2.75H) microcapsules are also found in the P(2.75H)/EP composite. These products are regarded as the derivatives of phenoxyl radicals of HPCTP structures. The relative area of fragments m containing nitrogen was observed to be higher than that of pure EP. This nitrogenous compound originated from P(2.75H) microcapsules and can be further decomposed to nonflammable gases, such as N2 and NH3. Along with CO2, these gases play a role in diluting flammable gases and oxygen during combustion.36
In conclusion, P(2.75H) microcapsules within the EP composites might mainly decompose in two procedures (Fig. 12). The first progress can be attributed to the separation and decomposition of PMMA shells. The MMA molecules further transform into CO2 gas. Meanwhile, HPCTP cores that have been protected eventually decompose into phenols, phosphorus-containing radicals, and nitrogenous fragments. Then, nitrogenous fragments further decompose into N2 and NH3 gases.
3.7 Flame-retardant mechanism of P(H)/EP composites
On the basis of the results obtained above, adding P(H) microcapsules can effectively enhance the fire-retardant properties of EP composites. The intrinsic flame-retardant mechanism can be conducted as that in Fig. 13. After ignition and heating, the P(H) microcapsules initially escape from the network of EP matrix and skip into independent shell and core materials. In the gas phase during the fire, the shell molecular chains can initially decompose into CO2 gas, anterior to the decomposition of HPCTP cores, and EP matrix. Then, the cyclic phosphazene cores decompose into substantial amounts of phosphorous free radicals and nitrogen nonflammable pyrolysis gas toward the gas phase because of the phosphazene structure. These pyrolytic PO2˙ and PO˙ free radicals react with the flammable radicals, such as H˙ and OH˙, to reduce the opportunity of combustion and produce a quenching effect. Meanwhile, the nonflammable CO2, N2, and NH3 gases decrease the concentration of flammable gas to produce a diluting effect.37 By contrast, in the condensed phase, the cyclic phosphazene structure becomes phosphorus-rich pyrolysis fragments and promote the formation of charring layers. Phosphorus-rich fragments with high molecular weights in the char will also improve the thermal stability of charring layers and prevent the further combustion of interior matrix in the condensed phase.7 All these reasons, including the quenching and diluting effects of flame inhibition effects in the gas phase, and the charring effect in the condensed phase, confirm the flame-retardant effectiveness derived from P(H) microcapsule addition.53.8 Mechanical performance of P(H)/EP composites
The dynamic mechanical behaviors of the EP thermosets were investigated by DMA tests. The storage modulus (E′) and loss factor (tan![[thin space (1/6-em)]](https://www.rsc.org/images/entities/char_2009.gif) δ) versus temperature plots are shown in Fig. 14. In Fig. 14(a), the E′ values of all the samples decreased as the temperature increased; this pattern indicates the softening effect of the polymer chains.38 The E′ values of all the HPCTP/EP and P(H)/EP composites were lower than that of pure EP at the whole testing temperature range from the environmental temperature to 250 °C. HPCTP/EP sample showed a decreased cross-linking density in accordance with the incompatible HPCTP. Given the reduced rigidity of materials, the low E′ values reflect the fact that the flexible PMMA structure improves the toughness and softness level of the whole molecules. However, the peak positions of tan
δ) versus temperature plots are shown in Fig. 14. In Fig. 14(a), the E′ values of all the samples decreased as the temperature increased; this pattern indicates the softening effect of the polymer chains.38 The E′ values of all the HPCTP/EP and P(H)/EP composites were lower than that of pure EP at the whole testing temperature range from the environmental temperature to 250 °C. HPCTP/EP sample showed a decreased cross-linking density in accordance with the incompatible HPCTP. Given the reduced rigidity of materials, the low E′ values reflect the fact that the flexible PMMA structure improves the toughness and softness level of the whole molecules. However, the peak positions of tan![[thin space (1/6-em)]](https://www.rsc.org/images/entities/char_2009.gif) δ are increased by the addition of P(H) microcapsules (Fig. 14(b)). These peak positions also represent the glass transition behaviors of the polymer thermosets as that in the DSC results called
δ are increased by the addition of P(H) microcapsules (Fig. 14(b)). These peak positions also represent the glass transition behaviors of the polymer thermosets as that in the DSC results called  . In comparison, the
  values were much higher than the Tg values and can be concluded to differ between the two measuring methods. Similarly, the
  values of P(H)/EP composites were observed distinctly to even exceed the value for the pure EP. With the incorporation of bulky P(H) microcapsules into epoxy networks, the mobility of macromolecular chains was inhibited. PMMA chains possess similar solubility parameters and compatibility with EP matrixes. When blended into the systems, the PMMA shells of P(H) microcapsules assemble with the matrixes and favorably promote cross-linking to form a compact structure. Besides, large microcapsules decrease the free volume between polymer chains and consequently cause a compact structure and increased crossing-link density of EP systems. Therefore, given the obviously raised
  values, adding P(H) microcapsules with PMMA shells can significantly enhance the heat resistance of EP composites and the usage temperature in dynamic mechanical conditions.2,5,38
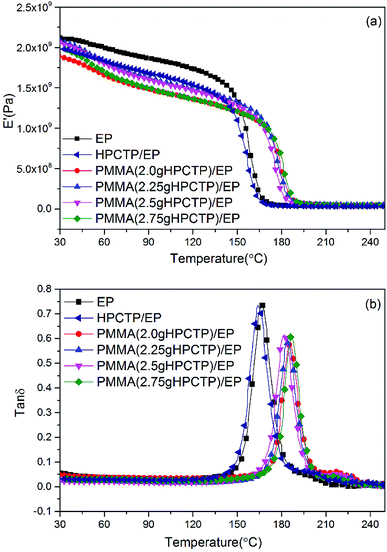 | ||
Fig. 14 DMA curves of pure EP, HPCTP/EP, and P(H)/EP composites: (a) storage modulus (E′) and (b) loss factor (tan![[thin space (1/6-em)]](https://www.rsc.org/images/entities/char_2009.gif) δ). δ). | ||
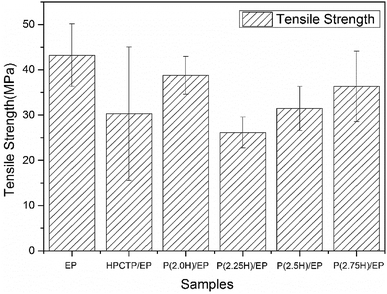
The mechanical performance of EP composites was investigated by tensile tests. The results of the tensile strength of pure EP, HPCTP/EP, and P(H)/EP composites were concluded in Fig. 15, and the fracture surfaces studied by SEM are shown in Fig. 16. As displayed by the chart, the tensile strength of EP composites decreased apparently with the blend of HPCTP because of the incompatible property. As the filling of HPCTP in P(H) microcapsules increased, different characteristics of the tensile strength data presented. The P(2.0H) microcapsules can cause a slight drop of tensile property. When P(2.25H) microcapsules were added, the specimens yielded the lowest strength at 26.2 MPa. However, as the amount of HPCTP improved, the P(H) microcapsule-reinforced composites acquired an enhanced tensile performance relative to that of the P(2.25H)/EP composites. The deterioration of the tensile performance was triggered by the microcapsules with PMMA as shell materials. The large-sized capsules can result in holes and microcracks (Fig. 16(d)) after tensile failures, which further generate concentration sites and secondary triggering sites that provide additional chances for damage to the composites.39 Particle size also plays an important part in the fracture behaviors of resin composites. In Fig. 16(a), pure EP exhibited smooth and river-like lines on its surface; this result indicates that the structural deformation was a typical brittle fracture. After the P(H) microcapsules were incorporated, the sections roughened with many cracks, and the mode of crack propagation was similar in Fig. 16(b–f). More specifically, the P(2.0H) microcapsules dispersed evenly in the composite, where tiny particles promoted the formation of numerous microcracks, and no severe deterioration was observed in the tensile data. This phenomenon is attributed to the fact that the P(2.0H) microcapsules yielded the smallest dimension of particles among those of all the P(H) microcapsules (Fig. 3(b)); such small dimension performs well in the dispersion process, although the core–shell structure has not taken shape. By contrast, the P(2.25H) microcapsules agglomerated into greater blocks; thus, on the fracture surface distinct agglomerations are found in Fig. 16(d). The large blocks in epoxied cross-linking networks inevitably accelerated the stress concentration and destruction.40,41 Therefore, the tensile strength of the P(2.25H)/EP composites was drastically lowered. When the microcapsules became homogeneous and uniform without aggregation hence evenly dispersed in the matrix (Fig. 16(e and f)), the mechanical performance improved. Overall, the P(2.75H) microcapsules with PMMA shells maintained the mechanical property of EP composites and retained the core–shell structure as flame-retardant microcapsules with potential applications.
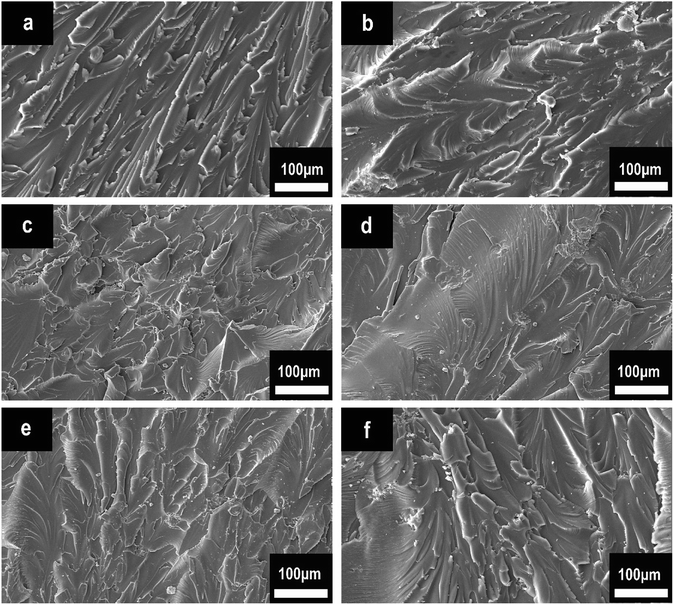 | ||
| Fig. 16 Tensile fracture surfaces of pure EP, HPCTP/EP, and P(H)/EP composites: (a) pure EP, (b) HPCTP/EP, (c) P(2.0H)/EP, (d) P(2.25H)/EP, (e) P(2.5H)/EP, and (f) P(2.75H)/EP. | ||
4. Conclusions
In this work, thermally resistant and flame-retardant microcapsules with PMMA as shell and HPCTP as core were synthesized and characterized. P(2.75H) microcapsules present uniform sizes and a core–shell structure. After being incorporated into the EP networks, the P(H) microcapsules increased the Tg value obviously and helped maintain the thermal stability of the EP composites. The P(2.75H)/EP composite reached up to a LOI value of 30.5% and V-1 rating in UL-94 tests. In the cone calorimeter tests, heat and gas release rates were reduced during combustion with the addition of P(2.75H) microcapsules. The analysis of residual chars indicates that the honeycomb structures formed with the presence of microcapsules, which may inhibit the exchange of gases in combustion. Pyrolysis analysis demonstrates that the P(H) microcapsules can decompose as two procedures to produce flame-retardant components. These results prove that P(H) microcapsules can effectively enhance the thermal resistance and flame retardancy of EP composites. We conclude that the reasons include the flame inhibition effect caused by the phosphorous-free radicals and the nonflammable pyrolysis gases in the gas phase, and the charring effect ascribed to the formation of phosphorus-rich residual char layer in the condensed phase. The P(H) microcapsules also raised the usage temperature in the dynamic mechanical conditions of the EP composites. This work provides a feasible method of microencapsulation for the flame-retardant enhancement of EP composites that ensures the flame retardancy and thermal resistance of the matrix.Conflicts of interest
There are no conflicts to declare.Acknowledgements
This work was supported by the Natural Science Foundation of Jilin Province (No. 20180101197jc).References
- Y. L. Liu, Polymer, 2001, 42, 3445–3454 CrossRef.
- L. L. Pan, J. F. Ban, S. R. Lu, G. X. Chen, J. Yang, Q. Y. Luo, L. Y. Wu and J. H. Yu, RSC Adv., 2015, 5, 60596–60607 RSC.
- S. Z. Haeri, B. Ramezanzadeh and M. Asghari, J. Colloid Interface Sci., 2017, 493, 111–122 CrossRef PubMed.
- M. Pan, C. L. Zhang, X. J. Zhai, L. J. Qu and J. X. Mu, High Perform. Polym., 2014, 26, 744–752 CrossRef.
- P. Wang, F. S. Yang, L. Li and Z. S. Cai, Polym. Degrad. Stab., 2016, 129, 156–167 CrossRef.
- C. L. Zhang, M. Pan, L. J. Qu and G. E. Sun, Polym. Adv. Technol., 2015, 26, 1531–1536 CrossRef.
- G.-R. Xu, M.-J. Xu and B. Li, Polym. Degrad. Stab., 2014, 109, 240–248 CrossRef.
- H. Liu, X. Wang and D. Wu, Polym. Degrad. Stab., 2014, 103, 96–112 CrossRef.
- M. Pan, R. Huang, T. T. Wang, D. Y. Huang, J. X. Mu and C. L. Zhang, High Perform. Polym., 2014, 26, 114–121 CrossRef.
- N. J. Kang, Z. J. Du, H. Q. Li and C. Zhang, Polym. Adv. Technol., 2012, 23, 1329–1334 CrossRef.
- V. Chandrasekhar and V. Krishnan, Adv. Inorg. Chem., 2002, 53, 159–211 CrossRef.
- Y. W. Chen-Yang, C. Y. Yuan, C. H. Li and H. C. Yang, J. Appl. Polym. Sci., 2003, 90, 1357–1364 CrossRef.
- B. Wang, H. Sheng, Y. Shi, W. Hu, N. Hong, W. Zeng, H. Ge, X. Yu, L. Song and Y. Hu, Polym. Degrad. Stab., 2015, 113, 96–109 CrossRef.
- L. Liu, Y. Zhang, L. Li and Z. Wang, Polym. Adv. Technol., 2011, 22, 2403–2408 CrossRef.
- T. T. Cao, L. Yuan, A. J. Gu and G. Z. Liang, Polym. Degrad. Stab., 2015, 121, 157–170 CrossRef.
- Z. F. Huang, X. Y. Qu and Z. Chen, J. Appl. Polym. Sci., 2015, 132, 41919 Search PubMed.
- T. Ashida, A. Katoh, K. Handa and M. Ochi, J. Appl. Polym. Sci., 1999, 74, 2955–2962 CrossRef.
- W. Z. Wang, C. H. Wang, Y. W. Zhang, Y. J. Liu, J. Yang and Y. H. He, J. Macromol. Sci., Part A: Pure Appl.Chem., 2017, 54, 164–170 CrossRef.
- M. Gao, Y. Wo and W. H. Wu, J. Appl. Polym. Sci., 2011, 119, 2025–2030 CrossRef.
- J. X. Ni, Q. L. Tai, H. D. Lu, Y. A. Hu and L. Song, Polym. Adv. Technol., 2010, 21, 392–400 Search PubMed.
- J. X. Ni, L. Song, Y. A. Hu, P. Zhang and W. Y. Xing, Polym. Adv. Technol., 2009, 20, 999–1005 CrossRef.
- M. Gao, W. H. Wu and F. C. Wu, J. Vinyl Addit. Technol., 2012, 18, 267 CrossRef.
- M. F. Liu, Y. Liu and Q. Wang, Macromol. Mater. Eng., 2007, 292, 206–213 CrossRef.
- M. Ciesielski, A. Schafer and M. Doring, Polym. Adv. Technol., 2008, 19, 507–515 CrossRef.
- R. Liu and X. D. Wang, Polym. Degrad. Stab., 2009, 94, 617–624 CrossRef.
- S. Yang, J. Wang, S. Huo, J. Wang and Y. Tang, Polym. Degrad. Stab., 2016, 126, 9–16 CrossRef.
- M.-J. Xu, G.-R. Xu, Y. Leng and B. Li, Polym. Degrad. Stab., 2016, 123, 105–114 CrossRef.
- L. P. Gao, D. Y. Wang, Y. Z. Wang, J. S. Wang and B. Yang, Polym. Degrad. Stab., 2008, 93, 1308–1315 CrossRef.
- Z. Q. Li and R. J. Yang, Polym. Degrad. Stab., 2014, 109, 233–239 CrossRef.
- J. S. Wang, Y. Liu, H. B. Zhao, J. Liu, D. Y. Wang, Y. P. Song and Y. Z. Wang, Polym. Degrad. Stab., 2009, 94, 625–631 CrossRef.
- J. Y. Wang, L. J. Qian, Z. G. Huang, Y. Y. Fang and Y. Qiu, Polym. Degrad. Stab., 2016, 130, 173–181 CrossRef.
- S. Brehme, B. Schartel, J. Goebbels, O. Fischer, D. Pospiech, Y. Bykov and M. Doring, Polym. Degrad. Stab., 2011, 96, 875–884 CrossRef.
- G. Y. Wang and Z. B. Nie, Polym. Degrad. Stab., 2016, 130, 143–154 CrossRef.
- L. J. Qian, Y. Qiu, N. Sun, M. L. Xu, G. Z. Xu, F. Xin and Y. J. Chen, Polym. Degrad. Stab., 2014, 107, 98–105 CrossRef.
- Y. Zhou, J. Feng, H. Peng, H. Q. Qu and J. W. Hao, Polym. Degrad. Stab., 2014, 110, 395–404 CrossRef.
- P. Wang and Z. S. Cai, Polym. Degrad. Stab., 2017, 137, 138–150 CrossRef.
- W. J. Liang, B. Zhao, P. H. Zhao, C. Y. Zhang and Y. Q. Liu, Polym. Degrad. Stab., 2017, 135, 140–151 CrossRef.
- K. Y. Teng, Y. Ni, W. Wang, H. B. Wang, Z. W. Xu, L. Chen, L. Y. Kuang, M. J. Ma, H. J. Fu and J. Li, Composites, Part A, 2017, 94, 178–188 CrossRef.
- N. I. Khan, S. Halder and M. S. Goyat, Mater. Chem. Phys., 2016, 171, 267–275 CrossRef.
- F. Awaja, S. N. Zhang, M. Tripathi, A. Nikiforov and N. Pugno, Prog. Mater. Sci., 2016, 83, 536–573 CrossRef.
- Q. Li, Siddaramaiah, N. H. Kim, D. Hui and J. H. Lee, Composites, Part B, 2013, 55, 79–85 CrossRef.
| This journal is © The Royal Society of Chemistry 2018 |

