
 Open Access Article
 This Open Access Article is licensed under a Creative Commons Attribution-Non Commercial 3.0 Unported Licence
Structural and metabolic adaptation of cellulolytic microcosm in co-digested Napier grass-swine manure and its application in enhancing thermophilic biogas production
Sarunyou Wongwilaiwalinab,
Wuttichai Mhuantong b,
Verawat Champredab,
Sithichoke Tangphatsornruangc,
Pornpan Panichnumsind,
Khanok Ratanakhanokchaie and
Chakrit Tachaapaikoon*ef
b,
Verawat Champredab,
Sithichoke Tangphatsornruangc,
Pornpan Panichnumsind,
Khanok Ratanakhanokchaie and
Chakrit Tachaapaikoon*ef
aThe Joint Graduate School of Energy and Environment, King Mongkut's University of Technology Thonburi, Bangkok 10140, Thailand
bEnzyme Technology Laboratory and BIOTEC-JGSEE Integrative Biorefinery Laboratory, National Center for Genetic Engineering and Biotechnology, Thailand Science Park, Pathumthani 12120, Thailand
cGenome Institute, National Center for Genetic Engineering and Biotechnology, Thailand Science Park, Pathumthani 12120, Thailand
dExcellent Center of Waste Utilization and Management, National Center for Genetic Engineering and Biotechnology at King Mongkut's University of Technology Thonburi, Bangkok 10150, Thailand
eSchool of Bioresources Technology, King Mongkut's University of Technology Thonburi, Bangkok 10150, Thailand. E-mail: chakrit.tac@kmutt.ac.th; Fax: +66-2470-7760; Tel: +66-2470-7766
fPilot Plant Development and Training Institute, King Mongkut's University of Technology Thonburi, Bangkok 10150, Thailand
First published on 22nd August 2018
Abstract
Biogas production from cellulosic wastes has received increasing attention. However, its efficiency is limited by the recalcitrant nature of plant cell wall materials. In this study, an active and structurally stable lignocellulolytic microcosm (PLMC) was isolated from seed culture in sugarcane bagasse compost by successive enrichment on Napier grass supplemented with swine manure, which is a mixture of highly fibrous co-digested waste under septic conditions. Tagged 16S rRNA gene sequencing on an Ion PGM platform revealed the adaptive merging of microorganisms in the co-digested substrates resulting in a stable symbiotic consortium comprising anaerobic cellulolytic clostridia stably co-existing with facultative (hemi)cellulolytic bacteria in the background of native microflora in the substrates. Ethanoligenens, Tepidimicrobium, Clostridium, Coprococcus, and Ruminococcus were the most predominant taxonomic groups comprising 72.82% of the total community. The remarkable enrichment of catabolic genes encoding for endo-cellulases and hemicellulases, both of which are key accessory enzymes in PLMC, was predicted by PICRUSt. PLMC was capable of degrading 43.6% g VS and 36.8% g VSS of the co-digested substrates within 7 days at 55 °C. Inoculation of the microcosm to batch thermophilic anaerobic digestion containing both substrates led to a 36.6% increase in methane yield along with an increase in cellulose removal efficiency. This study demonstrated structural and metabolic adaptation of the cellulolytic microcosms isolated in the background of native microflora from the co-digested wastes and its potent application in the enhancement of anaerobic digestion efficiency.
1. Introduction
Depolymerization of lignocelluloses is the main barrier in bioconversion of plant biomass in bio-industries due to the highly recalcitrant supra-molecular structure of the plant cell wall, comprising cellulose microfibers linked to networks of hemicellulose and shielded by lignin.1 This recalcitrant nature of cellulosic substrates represents a bottleneck and a rate-limiting step in the anaerobic digestion (AD) of fiber-rich cellulosic wastes in biogas production.2 Basically, AD comprises four metabolic stages: (i) hydrolysis, (ii) acidogenesis, (iii) acetogenesis and (iv) methanogenesis. These stages are performed by sequential and concerted actions of anaerobic and facultative bacteria together with methanogenic archaea. Searching for an efficient, eco-friendly and economically competitive strategy for increasing the efficiency of the breakdown of the lignocellulose structure is therefore a great challenge for improving the performance of biogas production processes from cellulosic wastes.Bio-augmentation utilizing microbial isolates, co-cultures, or complex communities has been reported as an efficient strategy for increasing the conversion efficiency of AD processes with advantages over non-biological options in terms of cost and environmental friendliness.3 In nature, lignocellulosic biomass is decomposed by the cooperative actions of a variety of prokaryotic and eukaryotic microorganisms capable of producing an array of cellulolytic, hemicellulolytic, and lignolytic enzymes, which work cooperatively via hydrolytic and non-hydrolytic mechanisms.4 Due to the complex nature of lignocelluloses, the use of cellulolytic microcosms in enhancing the degradation of fibrous materials in AD is considered advantageous compared to single microorganisms due to their high cellulose-degrading capability and avoidance of problems related to feedback inhibition and metabolite repression.5 The consortia can be obtained from the continuous sub-cultivation of seed cellulolytic microbes originating from various environmental sources active in lignocellulose degradation in a selective medium containing the target cellulosic substrate as the sole carbon source.5–7 The enriched consortia typically comprised cellulolytic anaerobic clostridia, which co-existed with various facultative members in a symbiotic manner where the facultative partners functioned in the generation of anoxic environment under controlled pH and with the removal of inhibitory metabolites.8 Enzyme activity profiles and specificities of the cellulolytic consortia were found to be influenced by the physical and chemical nature of the target substrates.9
The use of lignocellulolytic microbial consortia (LMCs) to enhance the digestibility of lignocelluloses in the AD of fiber-rich cellulosic substrates (such as cassava residues, swine manure and paper wastes), has been reported.10–12 This resulted in a varying degree of enhancement on the rate and yield of biogas production, which were related to the higher removal efficiencies of cellulose and hemicelluloses in the substrates. However, the stability of LMCs in AD processes was limited due to competition and incompatibility of members in LMCs with native microflora in the waste materials. Recently, in our previous study, a thermophilic, structurally-stable, lignocellulose-degrading consortium, namely, PLMC, was isolated from microflora in bagasse compost by successive sub-cultivation using Napier grass (NP) (a potential energy crop with high biomass productivity) as the main carbon source in the background of microflora in swine manure (SM) used as the co-digestion substrate.13 However, the isolated PLMC has not been explicitly characterized for its community structure, metabolic capability and performance in increasing the efficiency of the anaerobic co-digestion process. In this study, the structure and dynamics of PLMC were studied using tagged 16S rRNA gene sequencing on a next-generation sequencer, showing the adaptive shaping of the consortium structure and enrichment of catabolic genes related to plant polysaccharide degradation. The applicability of PLMC in enhancing the convertibility of the anaerobic co-digestion process is demonstrated, showing its potential as an additive for increasing the performance of the AD processes of the highly fibrous co-digested wastes.
2. Experimental
2.1 Material collections and preparation of NP sample
SM and NP were collected from a local farm in Ratchaburi province and UAC Global Public Company Limited, Chiang Mai, Thailand, respectively. SM and NP were analyzed for total solid (TS) and volatile solid (VS) content according to Standard Methods for the Examination of Water and Wastewater.14 The TS and VS contents of SM were 250 ± 2 and 186 ± 1 g kg−1 fresh material, respectively. The NP sample contained 320 ± 3 g kg−1 fresh material and 293 ± 2 g kg−1 of TS and VS, respectively. NP was cut and ground through a 0.5 mm sieve by an ultracentrifuge mill machine (ZM 200, Retsch, Dusseldorf, Germany) before use. The SM and NP samples were used with no pretreatment or sterilization. The samples were stored at −20 °C until use.2.2 Lignocellulolytic microbial consortium construction
The structurally stable symbiotic microbial consortium PLMC was constructed from seed cultures collected from decayed bagasse compost at Eastern Sugar and Cane in Sa Kaeo province, Thailand, as previously reported.13 In brief, the decayed bagasse was sub-cultivated in the PCS medium (containing 1 g L−1 yeast extract, 2 g L−1 CaCO3, 5 g L−1 NaCl, and 5 g L−1 peptone) using non-sterile NP (5% w/v) and SM (5% w/v) as the substrates, with a 1 × 10 cm filter paper strip (Whatman no. 1) as an indicator of cellulolytic activity. The culture was incubated at 55 °C under static, self-generated anoxic conditions. The consortium was sub-cultivated every 5 days until structural stability was achieved according to the 16S rRNA gene profile analyzed by denaturing gradient gel electrophoresis (DGGE). The consortium was kept at −20 °C in the presence of 10% glycerol for long-term storage.2.3 Tagged 16S rRNA gene sequencing
Metagenomic DNA of the lignocellulolytic consortium PLMC, SM and NP were extracted using the lysis buffer method described by Zhou et al. (1996).15 The purified metagenomic DNA was used as the template for amplification of the partial 16S rRNA gene using universal bacterial primers 785F (5′-ggattagataccctggtagtcc-3′) and 1081R (5′-ctcacgrcacgagctgacg-3′), including the five and six hypervariable regions in the prokaryotic 16S rRNA gene attached with tagged barcode sequences at the 5′-end. Polymerase chain reactions were performed using Pfu DNA polymerase (Fermentas, Vilnius, Lithuania) on a MyCycler thermocycler for 30 cycles of denaturation at 94 °C for 1 min, annealing at 60 °C for 1 min, and extension at 72 °C for 1 min. The amplicons were purified using a QIAGEN PCR purification kit (QIAGEN, Hilden, Germany) and quantified using a NanoDrop ND-1000 Spectrophotometer (ThermoScientific, Wilmington, DE, USA). The sequences were determined on the Ion PGM Sequencer System (Life Technologies, Grand Island, NY, USA) following the manufacturer's recommended protocols. The 16S rRNA sequences were deposited in the NCBI Sequence Read Archive (SRA) with the accession number SRP071041.2.4 Bioinformatics and statistical analysis
Data analysis was processed in QIIME version 1.9.1 (Quantitative Insights Into Microbial Ecology)16 for clustering sequences into Operational Taxonomic Units (OTUs), taxonomic classification, and alpha diversity analysis. The raw sequences were initially processed by removing low quality score reads with a cutoff of 20 for the Phred quality score and de-multiplexing them into specific groups based on their tagged sequences. Chimeric sequences were identified and removed by UCHIME17 using the referenced dataset from the Ribosomal Database Project (RDP).18 The OTUs were picked from the remaining sequences with an open-reference method (97% identity) using UCLUST.19 The representative sequence of each cluster was assigned a taxonomy using the Greengene database.20 In order to compare the bacterial diversity between the samples, alpha diversity index comprising the Shannon–Weaver index and the Chao1 richness estimator were calculated from the OTU table using a cutoff of 38![[thin space (1/6-em)]](https://www.rsc.org/images/entities/char_2009.gif) 489 reads per sample.
489 reads per sample.
Functional profiling of catabolic genes in the individual metagenomes was predicted through PICRUSt (Phylogenetic Investigation of Communities by Reconstruction of Unobserved States) version 1.0.0.21 The 16S copy number abundance was normalized by the script “normalize_by_copy_number.py”, and functional enzymes were predicted via the script “predict_metagenomes.py” in terms of KEGG category. The enrichment of genes encoding lignocellulosic enzymes between PLMC and the substrates (SM and NP) was assessed by Fisher's exact test. The P-values from Fisher's exact test and odd ratios were calculated using the module SciPy in Python (http://www.scipy.org/).
2.5 Substrate degradation and cellulolytic enzyme efficiency
The efficiency of PLMC in the decomposition of cellulosic substrates was assessed by inoculating 4 mL of the stable consortium cultivated for 7 days into 40 mL of freshly prepared PCS medium containing 2 g wet weight each of SM and NP. The control experiments (PC) with no added PLMC were included to determine the background activity of microflora in SM and NP in substrate degradation. All cultures were incubated under static anoxic conditions at 55 °C, and the samples were taken at specific intervals (0–21 days); the samples were collected 6 times on days 0, 2, 4, 7, 14 and 21. There were 18 separated batch tests in total for each sample since the experiments were performed in triplicate. The remaining solid fraction was analyzed for VS and volatile suspended solid (VSS) removal efficiency compared to the control using the standard method according to APHA, 2005.14 The liquid fractions after the separation of the cells and residual biomass (centrifuged at 7500 × g for 15 min) were collected for enzyme activity analysis. The enzyme assay was focused on lignocellulolytic enzymes including CMCase, xylanase, FPase and avicelase as described below.2.6 Enzyme activity assay
Lignocellulose degrading activities in the supernatant were analyzed based on the amount of reducing sugars liberated using the 3,5-dinitrosalicylic acid (DNS) method according to Rattanachomsri et al. (2009).22 100 μL reaction containing an appropriate dilution of the culture supernatant in 50 mM sodium phosphate buffer (pH 7.0) and 0.5% (w/v) of the substrate was incubated at 60 °C for 10 min. This was further used for filter paper hydrolysis (FPase) activity, where the reaction was conducted for 4 hours. Carboxymethyl cellulase (CMCase), avicelase, xylanase and FPase activities were measured using carboxymethyl cellulose, microcrystalline cellulose Avicel®, beechwood xylan and Whatman no. 1 filter paper as the substrates, respectively. The amount of reducing sugars was determined from the absorbance measurements at 540 nm and interpolated from a standard curve of the corresponding sugars. Assay reactions were performed in triplicate and the mean was reported with a standard deviation ≤ 5%. One unit (U) was defined as the amount of enzyme that produced 1 μmol of reducing sugar in 1 min.2.7 Biochemical methane potential (BMP) assay
Anaerobic biodegradability and methane production potential of the samples were studied in 120 mL-serum vials with a liquid volume of 80 mL. The co-digested substrate (1:1 SM and NP based on VS) was fixed at 1.6 g VS and mixed with PLMC inoculum in an inoculum to substrate ratio of 7:1 on a weight-to-weight basis (mg VSS/g VS). The PLMC inoculum was used in liquid form. The reaction volumes were made up to 80 mL of the working volume with PCS medium, with no pH adjustment and nitrogen flushing. The initial pH of the substrate was 7.15 ± 0.03 and the reaction was incubated at 55 °C. The control reaction was filled with sterile distilled water instead of PLMC inoculum. After 7 days, 20 mL of methanogen seed and 1% (w/v) of yeast extract were added to the vial as the nutrient supplement for methanogen. The hydrolysate in the vial was mixed with a total reaction volume of 100 mL. Nitrogen gas was flushed for 2 min to create anaerobic conditions. The experiments were performed in triplicate and the data were reported as average values with standard deviations. The reactions were monitored for the biogas production and biogas composition for 35 days of the incubation period after inoculating the methanogen seed and yeast extract. Volatile fatty acids (VFAs) concentrations, substrate removal efficiency, total alkalinity, and total volatile acid (TVA) concentrations were observed only during the first 7 days. These data represented characteristics of the substrates under PLMC treatment conditions before the addition of methanogen in BMP analysis.
2.8 Analytical methods
Volatile fatty acid (VFA) concentrations were measured on a Class-GC-FID-2010-Plus gas chromatograph equipped with a flame ionization detector (Shimadzu, Kyoto, Japan) and Rtx®-1 Crossbond® capillary column (Restek, Bellefonte, PA). The injector and column temperatures were maintained at 230 °C, while the detector temperature was 170 °C. Helium was used as the carrier gas at a flow rate of 50 mL min−1 and nitrogen was used as a make-up gas at a flow rate of 50 mL min−1. The biogas content was measured by water displacement method. The compositions of biogas were measured on a Class-GC 14B gas chromatograph (Shimadzu, Kyoto, Japan) equipped with a thermal conductivity detector and a Porapak-N column (Waters Corporation, Milfords, MA). The detector, injector, and column temperatures were maintained at 120 °C, 120 °C, and 70 °C, respectively. Purified helium was used as the carrier gas at a flow rate of 30 mL min−1. The data were reported as an average from a triplicate experiment with a standard deviation < 5%.3. Results and discussion
The thermophilic symbiotic cellulolytic consortium PLMC enriched in NP as the main carbon source in the presence of additional carbon and nitrogen substrates and rich background microflora from SM was previously isolated.13 According to analysis by DGGE, the consortium was stable in terms of community structure from the 12th generation under the selection force of the supplied carbon source and high temperatures under the self-generated anoxic conditions. Structural and metabolic adaptation of the bacteria from the heterogeneous microbial sources to the stable symbiotic cellulolytic consortium was further studied in the present work.3.1 Community structure of PLMC
The purified metagenomic DNAs of the environmental microflora in the substrates, i.e., SM and NP, and the cellulolytic consortium PLMC at 12th generation cultivated for 7 days were used as templates for the direct amplification of the partial 16S rRNA genes (approximately 300 bases) and analyzed on the Ion PGM sequencing platform. The reads were filtered to remove short sequences (<170 bases) and grouped according to their attached tag. In total, filtered reads were obtained with an average read length ranging from 254.3 to 261.3 and the number of reads obtained from different samples was in the range of 4–7 × 10⁴ per sample (Table 1). The average % GC content was 52.58% with minor variations in % GC among different samples (SD = 0.32).| NP | SM | PLMC | |
|---|---|---|---|
| a Dissimilarity level = 0.03. NP: Napier grass, SM: swine manure, PLMC: the structurally stable lignocellulosic microbial consortium grown in PCS-based medium, PCS: peptone cellulose solution (0.1% w/v yeast extract, 0.2% w/v CaCO3, 0.5% w/v peptone, 0.5% w/v NaCl), OTU: operation taxonomy unit, Chao1 and Shannon: names of non-parametric diversity indices used for estimating the population diversity between communities. | |||
| Number of reads | 65204 |
40869 |
70433 |
|
|||
| Sequence length | |||
| Average length (bp) | 261.3 | 254.3 | 256.9 |
| Standard deviation (bp) | 18.6 | 15.3 | 15.7 |
| Minimum length (bp) | 170 | 170 | 170 |
| Maximum length (bp) | 413 | 335 | 354 |
|
|||
| Alpha diversity indices | |||
| OTU | 977 | 2703 | 1280 |
| Chao1 | 1069 | 2746 | 1455 |
| Shannon | 3.34 | 9.39 | 5.01 |
| Good's coverage (%)a | 99.65 | 99.36 | 99.5 |
The clustering of similar sequences into OTUs using UCLUST revealed that the dataset represented 977-2703 OTUs per sample, with the highest OTU for the environmental microflora in SM and the lowest in NP (Table 1). The presence of 1280 OTUs in PLMC was much higher in number when compared with the results obtained by denaturing gel electrophoresis where only 9 major bands of 16S rRNA sequences were found,13 suggesting the presence of a variety of minor taxa as the background. The non-parametric diversity indices (Chao1 and Shannon) of PLMC were between those of SM and NP, showing its moderate biodiversity in terms of richness and distribution compared to those in the substrates. Good's coverage showed that the dataset covered more than 99% of the underlying bacterial diversity at a dissimilarity level of 0.03 (species) for all samples, suggesting substantial coverage of the sequence dataset for existing microbial diversity.
The number of shared OTUs among the three samples showed the enrichment and exclusion of specific groups of the original microflora in SM and NP adapted to co-exist in PLMC (Fig. 1). PLMC shared the majority of its OTU (56.09%) with SM, but contained a smaller overlapped fraction with NP (18.75%). The remaining 90 OTUs of PLMC with a redundancy >0.01% were unique in the stable consortium, suggesting their origin from the seed culture from bagasse compost. A substantial fraction of OTUs was found only in either SM or NP and was excluded during the selective enrichment process. Some shared OTUs between SM and NP were also found, although they originated from sources with different ecological habitats. Interestingly, 4.69% of the diversity was found in all samples, suggesting the adaptation of these bacterial groups from both co-digested substrates to exist in PLMC.
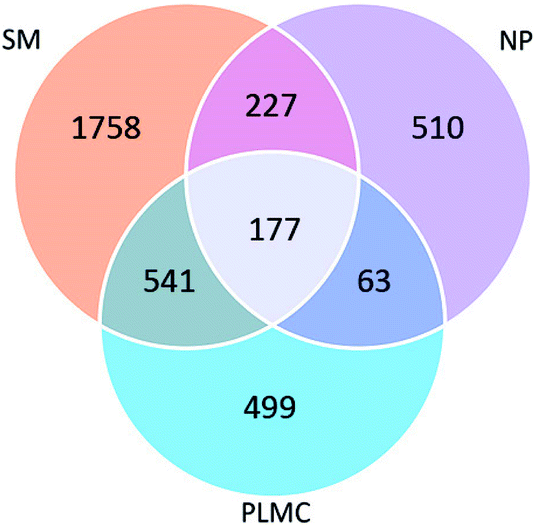 | ||
| Fig. 1 Venn diagram showing shared and unique OTUs in SM, NP, and PLMC. | ||
Taxonomic classification revealed that the NP sample was highly predominated by Firmicutes (Fig. 2A), particularly Bacilli. A diverse group of bacteria with different oxygen requirements was found in SM, where Firmicutes exists as the most abundant phylum (55.20%), followed by Bacteroidetes and Actinobacteria being 17.68% and 13.24%, respectively. Enrichment of anaerobic Firmicutes in class Clostridia was found in PLMC along with the respective reduction of other phyla originating from the co-substrates. This phenomenon strongly indicated that the microbial community could be changed after introduction of bio-augmented candidates into the system. The changes in the microbial community were probable not only due to the competition for substrate and/or special ecological niches between bio-augmented microorganisms and indigenous populations, but also by reducing inhibition from some types of metabolic inhibitors in the AD system.23
 | ||
| Fig. 2 Distribution of bacterial taxa in the cellulolytic consortia and the cellulosic substrates based on % relative abundance according to tagged 16S rRNA gene sequencing. (A) Phylum/class, (B) genus: the circle size indicates the relative abundance in genus level calculated as percentage of the total diversity. | ||
Focusing on a more refined taxonomic level (Fig. 2B), Actinobacteria in the genus Propionibacterium were the most abundant in SM, followed by Firmicutes (order Clostridiales in genera Corynebacterium and Prevotella); however, they accounted for less than 15% of the total diversity, reflecting the highly heterogeneous nature of the microbial community. The predominance of acid producing Propionibacterium together with a variety of bacteria capable of depolymerizing non-cellulosic polysaccharides and proteins reflected the complex digestion process in the digestive tracts of swine.24 However, the relatively low abundance of cellulolytic genera (e.g., Ruminococcus) would result in the low activity of the SM microflora in the decomposition of fiber-rich feedstuff.25 In contrast, the microbial community in NP was highly predominated by lactic acid bacteria in the family Lactobacillaceae, particularly the genus Lactobacillus, which accounted for 89.15% of its total diversity. The domination of lactic acid bacteria in NP reflected the in situ fermentation of the cellulosic material by the ensiling process, which led to an accumulation of organic acids under facultative anoxic conditions.26 Successive sub-cultivation led to the marked enrichment of the order Clostridiales in the symbiotic cellulolytic consortium PLMC. Ethanoligenens, Tepidimicrobium, Clostridium, Coprococcus, and Ruminococcus constituted the most predominant taxonomic groups, accounting for 72.82% of the total community. The consortium structure with reduced complexity indicated shaping of the heterogeneous bacterial community to more selected taxa capable of lignocellulose degradation under self-generated anoxic conditions along with the exclusion of Actinobacteria and Lactobacillus, originally presented as major taxa in the co-substrates. These enriched bacterial genera were substantially found in SM (8.59%), while they were present as minor taxa in NP (0.64%). The consortium structure of PLMC was markedly different from that of the cellulolytic consortium Np-LMC isolated from Napier grass solely under mesophilic conditions, which contained anaerobic/facultative bacteria Dysgonomonas and Sedimentibacter and aerobic Comamonas as the major genera together with various groups of cellulolytic Clostridium.27 This reflected differences in the originated seed culture, the background microflora in the co-digested substrate (SM), and the thermophilic subcultivation conditions for PLMC.
Clostridium are active cellulolytic bacteria that play a crucial role in the decomposition of lignocellulosic substrates under anaerobic conditions, e.g., in the digestive system of cattle28 and in AD processes operated upon cellulosic wastes using their efficient cell-bound cellulosomal systems.29 The enrichment of Clostridium has been reported in various LMCs isolated from cellulolytic seed cultures from different sources.9 Tepidimicrobium sp. has been reported for the production of a xylanolytic multi-enzyme complex with efficient capability regarding the degradation of hemicelluloses.30 A potential role of Coprococcus involving cellulose degradation was previously shown by cellulase gene mining using a metagenomic approach.31 In addition, few facultative cellulose-degrading bacteria, e.g., Bacillus, were also enriched in the consortium. These cellulolytic bacteria stably co-existed with various non-hydrolytic partners that could interact through complex metabolic interactions, e.g., in generating an anoxic environment, the removal of inhibitory intermediates, and the control of pH.8,32 Overall, this resulted in the stability of symbiotic LMCs. The overall community profiles thus suggest the adaptation of microbes from the cellulolytic seed culture from bagasse compost as well as from environmental microflora in both substrates. This reflected the influences of selective substrates and environmental conditions on shaping the composite bacterial profiles of the final stable consortia resulting from the merging of bacteria from these three independent sources.
3.2 Analysis of catabolic gene enrichment in PLMC
The adaptation of catabolic gene profile in PLMC during the enrichment process was determined using PICRUSt with particular focus on genes encoding enzymes related to the degradation of lignocelluloses. According to the odd ratios, the selective enrichment of specific groups of genes encoding for hydrolytic and non-hydrolytic enzymes (indicative of lignocellulose decomposition capability) was annotated in PLMC compared with SM and NP, where a lower abundance of these carbohydrate-processing enzymes was identified (Table 2). Marked enrichment of endo-glucanase and endo-xylanase, the key endo-acting hydrolytic enzymes involved in attacking the cellulose and xylan in lignocellulosic materials,33,34 was predicted in PLMC. This was accompanied by the increase in genes encoding for accessory enzymes involved in side chain cleavages of the hemicelluloses, particularly, α-arabinofuranosidases35 and α-galactosidase.36 α-Arabinofuranosidase has been reported as a key debranching enzyme that hydrolyzes terminal non-reducing α-arabinofuranose from arabinoxylan, which is the major hemicellulose in grass and other monocot plants,37 reflecting its role in the decomposition of NP. A marked increase in the abundance of genes encoding for levanase, which function in the hydrolysis of (2→6)-β-D-fructofuranosidic linkages in (2→6)-β-D-fructans (levans),38 was also observed in addition to the enrichment of glycolate oxidase, which is involved in lignin degradation.39 However, no enrichment of genes encoding proteins involved in the processing of downstream cellulose-degrading enzymes attacking cellobiose or cello-oligosaccharides in PLMC was found, suggesting the up-stream attack of (hemi)cellulose as the rate-limiting step in the decomposition of the lignocellulosic material in the co-digested substrates.| Group | KO | Odds ratios | Description | |
|---|---|---|---|---|
| PLMC vs. SM | PLMC vs. NP | |||
| Lignin | K00104 | 2.039 | 12.192 | Glycolate oxidase [EC:1.1.3.15] |
| K03781 | 0.309 | 0.421 | Catalase [EC:1.11.1.6] | |
| K03781 | 0.309 | 0.421 | Catalase [EC:1.11.1.6] | |
| K00432 | 0.733 | 0.400 | Glutathione peroxidase [EC:1.11.1.9] | |
| K00428 | 0.129 | 0.492 | Cytochrome c peroxidase [EC:1.11.1.5] | |
| K03564 | 0.834 | 3.846 | Peroxiredoxin Q/BCP [EC:1.11.1.15] | |
| K03386 | 0.728 | 0.558 | Peroxiredoxin (alkyl hydroperoxide reductase subunit C) [EC:1.11.1.15] | |
| (Hemi)cellulose | K11065 | 0.075 | 0.032 | Thiol peroxidase, atypical 2-cys peroxiredoxin [EC:1.11.1.15] |
| K03564 | 0.834 | 3.846 | Peroxiredoxin Q/BCP [EC:1.11.1.15] | |
| K03386 | 0.728 | 0.558 | Peroxiredoxin (alkyl hydroperoxide reductase subunit C) [EC:1.11.1.15] | |
| K11065 | 0.075 | 0.032 | Thiol peroxidase, atypical 2-cys peroxiredoxin [EC:1.11.1.15] | |
| K07405 | 0.021 | 0.700 | Alpha-amylase [EC:3.2.1.1] | |
| K07406 | 4.335 | 32.228 | Alpha-galactosidase [EC:3.2.1.22] | |
| K01209 | 1.708 | 10.872 | Alpha-N-arabinofuranosidase [EC:3.2.1.55] | |
| K01190 | 0.637 | 1.958 | Beta-galactosidase [EC:3.2.1.23] | |
| K01195 | 0.087 | 0.007 | Beta-glucuronidase [EC:3.2.1.31] | |
| K01192 | 1.042 | 9.986 | Beta-mannosidase [EC:3.2.1.25] | |
| K03927 | 1.414 | 5.141 | Carboxylesterase type B [EC:3.1.1.1] | |
| K03928 | 2.993 | 0.529 | Carboxylesterase [EC:3.1.1.1] | |
| K01181 | 2.131 | 41.661 | endo-1,4-Beta-xylanase [EC:3.2.1.8] | |
| K01190 | 0.637 | 1.958 | Beta-galactosidase [EC:3.2.1.23] | |
| K01212 | 1.959 | 11.843 | Levanase [EC:3.2.1.65] | |
| K01179 | 1.901 | 24.268 | Endoglucanase [EC:3.2.1.4] | |
| Cellobiose | K01222 | 1.935 | 4.382 | 6-Phospho-beta-glucosidase [EC:3.2.1.86] |
| K01223 | 1.002 | 0.124 | 6-Phospho-beta-glucosidase [EC:3.2.1.86] | |
| K01187 | 0.402 | 0.226 | Alpha-glucosidase [EC:3.2.1.20] | |
| K05350 | 2.742 | 0.867 | Beta-glucosidase [EC:3.2.1.21] | |
| K01188 | 0.533 | 0.425 | Beta-glucosidase [EC:3.2.1.21] | |
| K05349 | 0.654 | 1.582 | Beta-glucosidase [EC:3.2.1.21] | |
| K01182 | 1.766 | 0.536 | Oligo-1,6-glucosidase [EC:3.2.1.10] | |
| Cello-oligosaccharides | K01226 | 0.141 | 0.010 | Trehalose-6-phosphate hydrolase [EC:3.2.1.93] |
| K01232 | 1.463 | 0.124 | Maltose-6′-phosphate glucosidase [EC:3.2.1.122] | |
| K05989 | 0.758 | 2.683 | Alpha-L-rhamnosidase [EC:3.2.1.40] | |
| K01236 | 0.054 | 0.281 | Maltooligosyltrehalose trehalohydrolase [EC:3.2.1.141] | |
3.3 Substrate degradation efficiency
The efficiency of the degradation of cellulosic substrates by PLMC was determined based on volatile solid removal. According to Fig. 3, PLMC showed markedly higher VS and VSS removal efficiencies than the control experiment (PC), containing only the native microflora in SM and NP throughout the 20 days of batch cultivation. The highest VS removal of co-digested substrates by PLMC was observed at the end of incubation, which was 43.6 ± 2.4% higher than that observed for the control (Fig. 3A). However, the VSS removal efficiency of PLMC tended to stabilize after 7 days onwards, at which point it was 36.8 ± 1.2% higher than that of the control (Fig. 3B). These results showed that PLMC was capable of enhancing the degradation of the co-digested cellulosic substrates in the system. | ||
| Fig. 3 Substrate removal efficiency of the cellulolytic consortia. (A) % VS removal; (B) % VSS removal. | ||
Activities of key cellulolytic (CMCase, FPase, and avicelase) and hemicellulolytic (endo-xylanase) enzymes in the supernatant fraction of the PLMC consortium were determined (Fig. 4). Rapid increase in the CMCase and xylanase activities was observed during the first week. CMCase activity for the PLMC rapidly increased, reaching a peak activity level of 0.12 IU mL−1 on day 7 and then declined (Fig. 4A). This indicated the faster rate in CMCase induction for PLMC compared to the control, which reached the same level of activity after 2 weeks. The highest activity of xylanase of 0.09 IU mL−1 was also observed on day 7, which was 3 times higher than that of the control at the same time (Fig. 4B). Sharp increasing trends of FPase and avicelase activities, related to the hydrolysis of crystalline cellulose, were found during the first week for both PLMC and the control. These activities were then stabilized at 8 × 10⁻³ FPU mL−1 and 7 × 10⁻³ IU mL−1, respectively, for PLMC, which were slightly higher than those of the controls (Fig. 4C and D). The results thus supported the higher efficiencies of PLMC in the degradation of the fiber-rich wastes compared to native microflora in the substrates.
 | ||
| Fig. 4 Lignocellulolytic enzyme profiles in crude supernatants. The enzyme activities in the crude enzymes of PLMC and the control on different days of batch cultivation were determined using the DNS method. (A) CMCase, (B) xylanase, (C) FPase and (D) avicelase. | ||
3.4 BMP assessment
The efficiency of PLMC in increasing the conversion of co-digested substrates to biogas was studied using batch BMP analysis. The hydrolysis potential of the AD mixture inoculated with PLMC at 7 mg VSS/g VS of substrate was higher than that of the control with no consortium. The addition of PLMC led to an increase in total alkalinity with higher accumulation of propionic and butyric acids resulting from the conversion of complex organic molecules by PLMC (Table 3). The maximum amount of acetic acid was found on day 2 and then, the amount declined due to its conversion to methane, possibly via methanogens, which naturally occurred in PLMC, while the continuous accumulation of acetic acid was observed for the control with no inoculation of PLMC. After the addition of the methanogen seed on the 7th day, rapid increase in biogas and methane were found for the PLMC-inoculated reaction (Fig. 5). The maximum biogas and methane accumulation of 858.6 mL and 380.7 mL, respectively, were achieved at the end of the experiment (35 days), equivalent to 11.0% and 36.6% increase in biogas and methane accumulated volumes, respectively, compared to the control. Increasing rates in biogas and methane generation (12.26 and 5.44 cm3 dm−3 d−1, respectively) were obtained by the addition of PLMC, equivalent to 10.95% and 36.68% higher levels than the control. The higher conversion yields were related to the increased removal efficiencies of TS, VS, and VSS removal by the PLMC-inoculated mixture, reflecting the activity of the consortia in the degradation of the lignocellulosic substrates.| PC | PLMC | |||||||
|---|---|---|---|---|---|---|---|---|
| Day | 0 | 2 | 4 | 7 | 0 | 2 | 4 | 7 |
|
||||||||
| Liquid phase | ||||||||
| pH | 7.71 | 7.21 | 5.84 | 6.18 | 7.71 | 6.98 | 7.40 | 7.49 |
| Total alkalinity (mg L−1) | 1390 | 3101 | 3277 | 3528 | 1779 | 3809 | 3683 | 3930 |
| Total volatile fatty acid (mg L−1) | 1034 | 3026 | 4367 | 4284 | 1207 | 3361 | 2083 | 2090 |
| Acetate (mg L−1) | 432 | 1158 | 2259 | 2251 | 516 | 1221 | 375 | 312 |
| Propionate (mg L−1) | 388 | 617 | 711 | 786 | 469 | 811 | 881 | 1005 |
| Butyrate (mg L−1) | 936 | 1251 | 1319 | 1373 | 991 | 1445 | 1515 | 1520 |
|
||||||||
| Gas phase | ||||||||
| Total accumulated biogas production (mL) | 0 | 22 | 110 | 194 | 0 | 91 | 355 | 448 |
| Accumulated CH4 production (mL) | 0 | 4 | 31 | 65 | 0 | 36 | 117 | 160 |
| Accumulated CO2 production (mL) | 0 | 6 | 50 | 96 | 0 | 33 | 174 | 127 |
|
||||||||
| Solid phase | ||||||||
| % TS removal | 0 | 2.4 | 9.3 | 11.3 | 0 | 7.6 | 18.8 | 23.1 |
| % VS removal | 0 | 5.5 | 15.7 | 18.3 | 0 | 12.1 | 27.4 | 34.8 |
| % VSS removal | 0 | 9.6 | 14.7 | 17.0 | 0 | 2.5 | 17.1 | 29.0 |
 | ||
| Fig. 5 Effects of PLMC inoculum on the enhancement of biogas and methane production using SM-NP as co-digested substrates under 55 °C, analysed in intervals during the 35 days of incubation. | ||
The biological strategy used by microbial agents offers a cost-effective alternative for enhancing the digestibility and convertibility of cellulosic wastes in AD compared with chemical methods (e.g., alkali delignification and oxidation via the Fenton reaction, which suffers from waste treatment and energy intensive thermochemical methods like steam explosion).40 To date, several reports have demonstrated the successful anaerobic co-digestion of livestock wastes and agricultural residues such as animal manure and rice straw,41 chicken manure and corn stover,42 chicken manure and coconut/coffee grounds/cassava,43 chicken/dairy manures and wheat straw,44 and slaughterhouse wastewater and Napier grass.45 However, the co-digestion of swine manure with cellulosic wastes has been shown to be limited by the low hydrolytic activity of microflora in the manure.10 SM typically contains a high fraction of undigested lignocellulosic components owing to the inefficiency of microflora in the swine digestive tract to decompose lignocelluloses; however, it is considered a rich source of methanogens and nutrients required for co-digestion.46 Several approaches have been reported to increase the convertibility of SM co-digestion processes with lignocellulosic materials, but with variation in their efficiency, cost, and feasibility on up-scaling.1 The inoculation of a structurally stable LMC to SM was shown to result in 40% and 55% increase in biogas and methane production, respectively, compared to the control with no inoculum under mesophilic conditions.10 The increase in yields corresponded to 1.87- and 1.65-fold increase in cellulose and hemicellulose removal, respectively. The lower degree of biogas enhancement achieved in the present study would reflect the reduced microbial activity in the post-hydrolysis step under thermophilic conditions and the more recalcitrant nature of the non-pretreated Napier grass used as the co-substrate for enzymatic depolymerization compared to the use of alkaline pretreated cellulosic waste in the previous study. Although thermophilic conditions could lead to the higher degradation of lignocelluloses due to the increase in enzyme catalytic activities, high temperatures have been reported to inhibit the activity of acidogens and methanogens.47 Further studies on the long-term stability of PLMC in a continuous AD process and optimization of the process parameters, e.g., dosage of PLMC and dilution rate, are considered to be challenging in order to apply the microcosm for industrial implementation.
4. Conclusion
In summary, the structurally stable symbiotic thermophilic biomass-degrading bacterial consortium, resulting from the merging and adaptive selection of microbes in the cellulolytic seed culture and co-digested substrates under non-sterile conditions, has been reported for the first time in this study. The consortium could enhance the convertibility of cellulosic materials, which is the rate-limiting step in AD, resulting in higher biogas and methane productivity in batch reactions. Further optimization of the application of PLMC in continuous AD processes is warranted.Conflicts of interest
All authors declare that we have no conflicts of interest.Acknowledgements
The authors would like to thank The Joint Graduate School of Energy and Environment (JGSEE), KMUTT' 55th Anniversary Commemorative Fund of King Mongkut's University of Technology Thonburi (KMUTT), The National Center for Genetic Engineering and Biotechnology (BIOTEC), and Thailand Research Fund (RTA5980006) for the financial supports.References
- E. Bruni, A. P. Jensen and I. Angelidaki, Bioresour. Technol., 2010, 101, 8713–8717 CrossRef PubMed.
- Y. Zheng, J. Zhao, F. Xu and Y. Li, Prog. Energy Combust. Sci., 2014, 42, 35–53 CrossRef.
- W. Hui, L. Jiajia, L. Yicai, G. Peng, W. Xiaofen, M. Kazuhiro and C. Zongjun, Bioresour. Technol., 2013, 136, 481–487 CrossRef PubMed.
- L. R. Lynd, P. J. Weimer, W. H. Van Zyl and P. S. Pretorius, Microbiol. Mol. Biol. Rev., 2002, 66, 506–577 CrossRef PubMed.
- S. Haruta, Z. Cui, Z. Huang, M. Li, M. Ishii and Y. Igarashi, Appl. Microbiol. Biotechnol., 2002, 59, 529–534 CrossRef PubMed.
- P. Guo, K. Mochidzuki, W. Cheng, M. Zhou, H. Gao, D. Zheng, X. Wang and Z. Cui, Bioresour. Technol., 2011, 102, 7526–7531 CrossRef PubMed.
- S. Wongwilaiwalin, U. Rattanachomsri, T. Laothanachareon, L. Eurwilaichitr, Y. Igarashi and V. Champreda, Enzyme Microb. Technol., 2010, 47, 283–290 CrossRef.
- S. Kato, S. Haruta, Z. J. Cui, M. Ishii and Y. Igarashi, Appl. Environ. Microbiol., 2005, 71, 7099–7106 CrossRef PubMed.
- S. Wongwilaiwalin, T. Laothanachareon, W. Mhuantong, W. Tangphatsornruang, L. Eurwilaichitr, Y. Igarashi and V. Champreda, Appl. Microbiol. Biotechnol., 2013, 97, 8941–8954 CrossRef PubMed.
- S. Tuesorn, S. Wongwilaiwalin, V. Champreda, M. Leethochawalit, A. Nopharatana, S. Techkarnjanaruk and P. Chaiprasert, Bioresour. Technol., 2013, 144, 579–586 CrossRef PubMed.
- X. Yuan, Y. Cao, J. Li, B. Wen, W. Zhu, X. Wang and Z. Cui, Bioresour. Technol., 2013, 118, 281–288 CrossRef PubMed.
- Q. Zhang, J. He, M. Tian, Z. Mao, L. Tang, J. Zhang and H. Zhang, Bioresour. Technol., 2011, 102, 8899–8906 CrossRef PubMed.
- S. Wongwilaiwalin, W. Mhuantong, S. Tangphatsornruang, P. Panichnumsin, V. Champreda and C. Tachaapaikoon, Biomass Convers. Biorefin., 2016, 6, 421–426 CrossRef.
- APHA, Standard Methods for the Examination of Water and Wastewater, American Public Health Association, Washington, DC, 2005 Search PubMed.
- J. Zhou, M. A. Bruns and J. M. Tiedje, Appl. Environ. Microbiol., 1996, 62, 316–322 Search PubMed.
- J. G. Caporaso, J. Kuczynski, J. Stombaugh, K. Bittinger, F. D. Bushman, E. K. Costello, N. Fierer, A. G. Pena, J. K. Goodrich, J. I. Gordon and G. A. Huttley, Nat. Methods, 2010, 7, 335–336 CrossRef PubMed.
- R. C. Edgar, B. J. Haas, J. C. Clemente, C. Quince and R. Knight, Bioinformatics, 2011, 27, 2194–2200 CrossRef PubMed.
- J. R. Cole, Q. Wang, J. A. Fish, B. Chai, D. M. McGarrell, Y. Sun, C. T. Brown, A. Porras-Alfaro, C. R. Kuske and J. M. Tiedje, Nucleic Acids Res., 2014, 42, D633–D642 CrossRef PubMed.
- R. C. Edgar, Bioinformatics, 2010, 26, 2460–2461 CrossRef PubMed.
- D. McDonald, M. N. Price, J. Goodrich, E. P. Nawrocki, T. Z. DeSantis, A. Probst, G. L. Andersen, R. Knight and P. Hugenholtz, ISME J., 2012, 6, 610–618 CrossRef PubMed.
- M. G. I. Langille, J. Zaneveld, J. G. Caporaso, D. McDonald, D. Knights, J. A. Reyes, J. C. Clemente, E. Burkepile, R. L. V. Thurber, R. Knight, R. G. Beiko and C. Huttenhower, Nat. Biotechnol., 2013, 31, 814–821 CrossRef PubMed.
- U. Rattanachomsri, S. Tanapongpipat, L. Eurwilaichitr and V. Champreda, J. Biosci. Bioeng., 2009, 107, 488–493 CrossRef PubMed.
- S. Wei, Appl. Microbiol. Biotechnol., 2016, 100, 9821–9836 CrossRef PubMed.
- R. Isaacson and H. B. Kim, Anim. Health Res. Rev., 2012, 13, 100–109 CrossRef PubMed.
- C. González-Fernández and P. A. García-Encina, Biomass Bioenergy, 2009, 33, 1065–1069 CrossRef.
- Z. G. Weinberg, G. Ashbell and A. Azrieli, J. Appl. Bacteriol., 1988, 64, 1–7 CrossRef.
- P. Kanokratana, S. Wongwilaiwalin, W. Mhuantong, S. Tangphatsornruang, L. Eurwilaichitr and V. Champreda, J. Biosci. Bioeng., 2017, 4, 439–447 Search PubMed.
- A. Biddle, L. Stewart, J. Blanchard and S. Leschine, Diversity, 2013, 5, 627–640 CrossRef.
- H. Shiratori, H. Ikeno, S. Ayame, N. Kataoka, A. Miya, K. Hosono, T. Beppu and K. Ueda, Appl. Environ. Microbiol., 2006, 72, 3702–3709 CrossRef PubMed.
- P. Phitsuwan and K. Ratanakhanokchai, J. Mol. Catal. B: Enzym., 2015, 120, 28–37 CrossRef.
- K. Mewis, Z. Armstrong, Y. C. Song, S. A. Baldwin, S. G. Wihers and S. J. Hallam, J. Biotechnol., 2013, 167, 462–471 CrossRef PubMed.
- W. Wang, L. Yan, Z. Cui, Y. Gao, Y. Wang and R. Jing, Bioresour. Technol., 2011, 102, 9321–9324 CrossRef PubMed.
- Q. K. Beg, M. Kapoor, L. Mahajan and G. S. Hoondal, Appl. Microbiol. Biotechnol., 2001, 56, 326–338 CrossRef PubMed.
- G. Sulzenbacher, F. Shareck, R. Morosoli, C. Dupont and G. J. Davies, Biochemistry, 1997, 36, 16032–16039 CrossRef PubMed.
- A. Kaji and K. Tagawa, Biochim. Biophys. Acta, 1970, 207, 456–464 CrossRef.
- R. J. Desnick and Y. A. Ioannou, The Metabolic and Molecular Bases of Inherited Disease, McGraw-Hill, New York, 8th edn, 2001, pp. 3733–3737 Search PubMed.
- B. C. Saha, Biotechnol. Adv., 2000, 18, 403–423 CrossRef PubMed.
- E. Wanker, A. Huber and H. Schwab, Appl. Environ. Microbiol., 1995, 61, 1953–1958 Search PubMed.
- K. E. Hammel, M. D. Mozuch, K. A. Jensen and P. J. Kersten, Biochemistry, 1994, 33, 13349–13354 CrossRef PubMed.
- F. Monlau, A. Barakat, J. P. Steyer and H. Carrer, Bioresour. Technol., 2012, 120, 241–247 CrossRef PubMed.
- J. Ye, D. Li, Y. Sun, G. Wang, Z. Yuan, F. Zhen and Y. Wang, Waste Manage., 2013, 33, 2653–2658 CrossRef PubMed.
- Y. Li, R. Zhang, C. Chen, G. Liu, Y. He and X. Liu, Bioresour. Technol., 2013, 149, 406–412 CrossRef PubMed.
- F. Abouelenien, Y. Namba, M. R. Kosseva, N. Nishio and Y. Nakashimada, Bioresour. Technol., 2014, 159, 80–87 CrossRef PubMed.
- X. Wang, G. Yang, Y. Feng, G. Ren and X. Han, Bioresour. Technol., 2012, 120, 78–83 CrossRef PubMed.
- S. Sittijunda, KKU Research Journal, 2015, 20, 323–336 Search PubMed.
- P. Panichnumsin, A. Nopharatana, B. Ahring and P. Chaiprasert, Biomass Bioenergy, 2010, 34, 1117–1124 CrossRef.
- M. H. Gerardi, The Microbiology of Anaerobic Digesters, Wiley & Sons, Inc., Hoboken, New Jersey, 2003, pp. 89–92 Search PubMed.
| This journal is © The Royal Society of Chemistry 2018 |