DOI:
10.1039/C8RA05820B
(Paper)
RSC Adv., 2018,
8, 31213-31223
Physicochemical characterizations of novel dicyanamide-based ionic liquids applied as electrolytes for supercapacitors†
Received
8th July 2018
, Accepted 30th August 2018
First published on 5th September 2018
Abstract
Novel ionic liquids (ILs), containing a dicyanamide anion (DCA−), are synthesized and applied as suitable electrolytes for electrochemical double layer capacitors (EDLCs). The prepared ILs are either composed of triethyl-propargylammonium (N222pr+) or triethyl-butylammonium (N2224+) cations paired with the DCA− anion. The structure of the cation influences its electrostatic interaction with the DCA− anion and highly impacts the physical and electrochemical properties of the as-prepared ILs. The geometry and the length of the alkyl chain of the propargyl group in N222pr+ enhance the ionic conductivity of N222pr–DCA (11.68 mS cm−1) when compared to N2224–DCA (5.26 mS cm−1) at 298 K. It is demonstrated that the Vogel–Tammann–Fulcher model governs the variations of the transport properties investigated over the temperature range of 298–353 K. A maximum potential window of 3.29 V is obtained when N222pr–DCA is used as electrolyte in a graphene based symmetric EDLC system. Cyclic voltammetry and galvanostatic measurements confirm that both electrolytes exhibit an ideal capacitive behavior. The highest specific energy of 55 W h kg−1 is exhibited in the presence of N2224–DCA at a current density of 2.5 A g−1.
1. Introduction
Electrochemical capacitors are energy-storage devices characterized by their high-power densities, rapid charge and discharge rates, high specific capacitances and long cycle-lives. Their main applications include portable electronics, hybrid electric vehicles and memory backup systems.1,2 More specifically, electrochemical double layer capacitors (EDLCs) represent actually more than 80% of commercial supercapacitors.3 The charge storage mechanism in EDLCs relies on the reversible electrostatic adsorption of electrolyte ions at the electrode/electrolyte interface.4 Among the components of an EDLC device,5 the electrolyte plays a determinant role for the improvement of the delivered capacitance and overall charge storage properties. Typically, organic solutions are used as electrolytes in EDLC devices. They are mostly composed by tetraethylammonium tetrafluoroborate in acetonitrile or propylene carbonate.6 However, a significant interest is recently devoted to ionic liquids (ILs) as alternative candidates to organic electrolytes for EDLCs. ILs are solvent-free electrolytes with unique properties such as a high chemical stability, nonflammable nature, negligible vapor pressures and large operating potential windows.7 Comparatively to organic electrolytes, ILs present a better safety in EDLC devices and operate over a larger range of temperature (−50 to 90 °C).8 In the last decade, extensive efforts have been devoted to the synthesis of novel ILs as supporting electrolytes to enhance the electrochemical performance of EDLCs.4,9 The most employed ILs are composed by pyrrolidinium or imidazolium cations paired with fluorinated anions such as bis(trifluoromethane)sulfonimide (TFSI−) and tetrafluoroborate (BF4−). For example, in the presence of 1-methyl-3-ethylimidazolium tetrafluoroborate (EMIM-BF4) electrolyte, suitable performances were exhibited in terms of specific capacitance (94–230 F g−1), energy density (86 W h kg−1) and operating potential window (3.5–4 V).10,11 However, the application of aprotic tetralkylammonium based ILs in energy-storage devices is mostly limited by their high viscosities.6,7,12 Regarding the frequently used aprotic tetralkylammonium, the viscosity values are about 144.8 mPa s for trietlyl-butylammonium bis(trifluoromethane)sulfonimide (N2224–TFSI), 167 mPa s for trietlyl-hexylammonium bis(trifluoromethane)sulfonimide (N2226–TFSI), 202 mPa s for trietlyl-octyllammonium bis(trifluoromethane)sulfonimide (N2228–TFSI), 273 mPa s for trietlyl-butylammonium dimaleate (N2224–Dimaleate) and 439 mPa s for trietlyl-butylammonium acetate (N2224–CH3COO).13–15 Therefore, it is important to synthesis new aprotic ILs with lower viscosities while maintaining a good electrochemical performance of the EDLC device. Previous studies demonstrated that DCA-based ILs are suitable electrolytes for electrochemical applications owing to their low viscosities that range from 20 to 80 mPa s.7,16,17 In addition, the weak ionic interaction between DCA− anion and the cation strongly affects their transport properties and electrochemical window. In this context, the present work investigates the preparation of two novel acyclic ammonium ILs containing the same DCA anion paired with various cations: triethyl-propargylammonium (N222pr+) and triethyl-butylammonium (N2224+). The as-prepared ILs are tested as free-solvent electrolytes for EDLCs. The electrochemical performance is investigated towards the cation structure and the physico-chemical properties of N222pr–DCA and N2224–DCA ILs including their density, transport property, ionicity and potential window. On the other hand, carboneous substrates are usually employed as electrode materials in EDLC devices. Activated carbon (AC), carbon nanotubes (CNTs) and graphene nanosheet (GNS) are widely used in the presence of ILs electrolytes owing to their excellent physico-chemical properties.18–20 Even though AC is commercially the most employed electrode active material,18,21,22 numerous works reported that a large part of the AC active sites are hardly accessible by the large ions constituting the IL electrolyte.18,20,22,23 Accordingly, many studies were oriented to GNS as electrode materials for EDLCs due to their peculiar characteristics in terms of high electrical conductivity, excellent mechanical strength and good electrochemical properties.20,24 The two-dimensional architecture of GNS materials also provide a larger accessible surface area than CNTs.25
2. Experimental
All chemical reagents were analytical grade and were used as purchased. The preparation methods employed for the syntheses of both ILs are described below. All aqueous solutions were prepared using ultrapure water (18.2 MΩ cm) using Milli-Q Advantage A10 water purification system.
2.1 Synthesis procedures of the ILs
Synthesis of (N222pr–Br) and (N2224–Br) precursors. 0.22 mol of alkyl bromide (97–99%, Sigma-Aldrich) was added dropwise to a solution of triethylamine (99%, Sigma-Aldrich) (0.20 mol) in 100 mL of acetonitrile under continuous stirring at a temperature of 278 K. Then, the resulting mixture was stirred for 24 h at 55 °C under an argon. After cooling, the heterogeneous mixture was separated and the residual solvent was removed under reduced pressure to form white solids corresponding to (N222pr–Br) and (N2224–Br).
Synthesis of (N222pr–DCA) and (N2224–DCA) ILs. 0.10 mol of the corresponding precursor was dissolved in 100 mL of an aqueous solution and mixed with silver dicyanamide (0.11 mol). The mixture was magnetically stirred and heated under reflux for 5 h. The resulting yellow slurry was filtered and the liquid phase was collected and evaporated under vacuum to obtain a slight yellowish liquid. All obtained ILs were kept in glass bottles and dried at 353 K under reduced pressure (<2 mmHg) for three days. The water contents in each IL were evaluated by a Karl–Fischer moisture titrator (Metrohm 73 KF coulometer) and all values were less than 0.015 wt%. The purity of ILs was confirmed by a 500 MHz proton NMR spectroscope using tetramethylsilane as an internal reference. Corresponding 1H-NMR spectral data are presented in the supplementary file informations.
2.2 Preparation of the active material and assembling of the EDLC device
Graphene nanosheets (GNS) were prepared from a graphite powder (99.998%, Sigma-Aldrich) following the modified Hummers method.26 The physico-chemical characterization of GNS is described in our previous paper.27 The preparation of the electrode was made by mixing 75 wt% of graphene, 15 wt% of carbon black (XC72), 5 wt% of sodium carboxymethylcellulose (CMC: 2 wt% in water) and 5 wt% of polytetrafluoroethylene (PTFE 60 wt% in water). The resulting slurry was pasted onto an aluminium disc and dried under vacuum at 353 K for 12 h. In a second step, the active material was moistened several times in anhydrous acetonitrile for at least 6 h, to totally replace the structural water by acetonitrile, and dried at 373 K for 12 h under vacuum. Finally, the electrode material was impregnated by 50 μL of ILs under vacuum at 343 K for 24 h. The cells were assembled into symmetric Swagelock-type holders. The electrodes were separated by a glass microfiber filter (Whatman 934-AH) disc (diameters of 125 mm), which was drenched with 100 μL of ILs.
2.3 Physical and electrochemical characterization of ILs
Molecular modeling of ILs structures. Gaussian 09 (ref. 28) program was used for the density functional computations. We have optimized the geometry of the different molecules by the B3LYP29,30 method in combination with the 6-31+G(d) basis set. We have performed vibrational analysis to verify there are no imaginary frequencies and that the structures are at minimal energy. The energies, the electrostatic potential and the volume were calculated at the B3LYP/6–311++G(d,p)//B3LYP/6-31+G(d) level.
Viscosity and density measurements. The viscosities and densities of as-prepared ILs were determined by the Anton-Paar SVM (3001) viscometer. The cells temperature was regulated within ± 0.01 K. The repeatability of the viscosity cell equals 0.1% and the reproducibility is about 0.35%. The viscosity was calculated for temperatures ranging from 298 to 353 K at ambient pressure. The uncertainty of measurements is less than ± 1%. The density cell was calibrated for the same temperature range at ambient pressure. Each density was measured three times and an average value was calculated. The estimated uncertainty of the density value is less than 5 × 10⁻⁵ g cm−3.
Ionic conductivity measurements. The ionic conductivities of the selected ILs were measured in a conductivity cell with epoxy graphite electrode (S230-seven compact conductivity-Mettler Toledo). The area of each electrode is about 0.25 cm2 and the distance between the electrodes is equal to 0.5 cm. A cell constant (k) of 0.57 cm−1 was measured by a KCl standard solution. The temperature in the cell was regulated within ± 0.01 K in a thermostatic bath. The conductivities values were firstly determined as a function of the temperature during the heating cycle from 298 to 353 K. Then, the cell was cooled to 288 K and the measurements were performed until reaching a stabilized temperature. The uncertainty of these measurements is less than ± 0.5%.
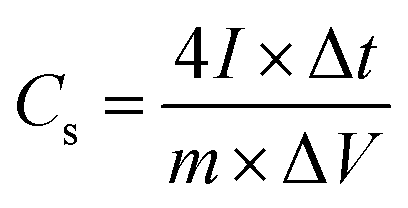
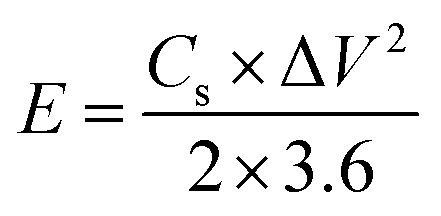
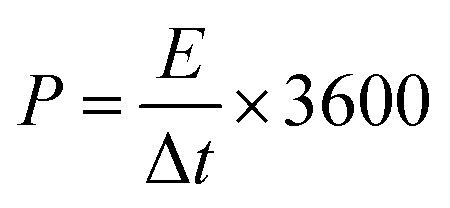
Electrochemical potential windows measurements. The linear sweep voltammetry (LSV) was used to determine the potential window (PW) of each IL at a scan rate of 10 mV s−1. The measurements were performed in a conventional three-electrode cell with a multichannel potentiostat (VMP, Perkin Elmer). A glassy carbon disk (1.6 mm in diameter) was used as a working electrode, a Pt disk electrode (2.0 mm in diameter) was used as a counter electrode and Ag/AgCl, KClsat(IL) was used as a reference electrode. KClsat(IL) is a saturated KCl solution containing 1-butyl-1-methylpyrrolidinium bis(trifluoromethanesulfonyl)imide (BMPYR-TFSI).31 The Ag/AgCl, KClsat(IL) reference electrode was calibrated by using the ferrocenium/ferrocene couple (Eref = +317 mV vs. SHE). Prior to each measurement, the working electrode was immersed in 1![[thin space (1/6-em)]](https://www.rsc.org/images/entities/char_2009.gif) :1 nitric acid solution and handled in ultrasound bath for few minutes, and then washed with distilled water and acetone. All electrochemical characterizations of EDLC devices were performed with GNS electrodes under a dry argon gas. The values of the specific capacitance (Cs), energy density (E) and power density (P) were calculated from the following equations.32,33
:1 nitric acid solution and handled in ultrasound bath for few minutes, and then washed with distilled water and acetone. All electrochemical characterizations of EDLC devices were performed with GNS electrodes under a dry argon gas. The values of the specific capacitance (Cs), energy density (E) and power density (P) were calculated from the following equations.32,33| |
 | (1) |
| |
 | (2) |
| |
 | (3) |
where I is the discharge current (A), Δt is the discharge time (s), ΔV is the potential window during the discharge process after IR drop (V) and m is the total mass of the active material (g).
3 Results and discussion
3.1 Molecular modelling of ILs structures
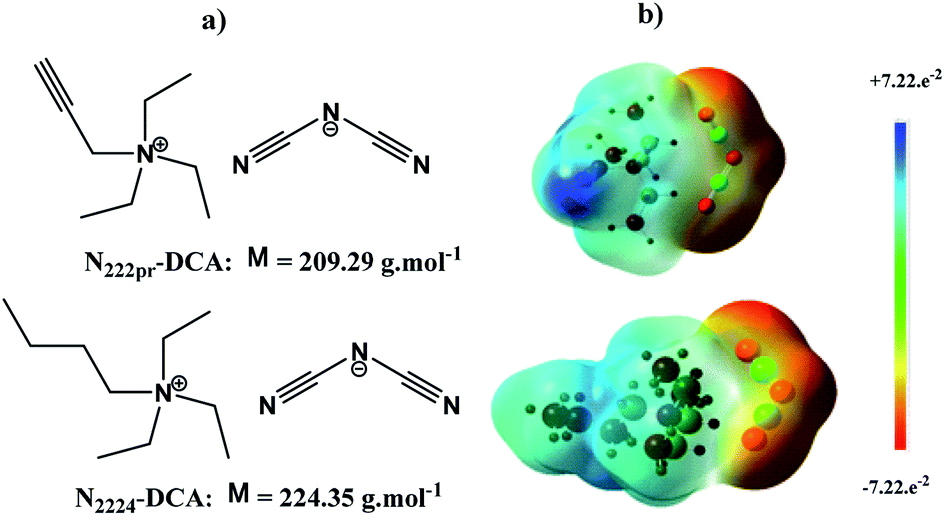
The optimized geometries of N2224–DCA and N222pr–DCA are shown in Fig. 1-a. The distance between the nitrogen of the anion and the nitrogen of the cation is r± = 2.26 Å for N2224–DCA and r± = 2.41 Å for N222pr–DCA. In order to study the interaction structures for ILs, the electrostatic potential was analysed for ILs (Fig. 1-b). The negatively charged regions are observed on the nitrogen atoms of DCA and the positively charged regions are observed on the three carbons of the cation which are close to the anion. For the N222pr a positive region is also observed on the hydrogen attached to C![[triple bond, length as m-dash]](https://www.rsc.org/images/entities/char_e002.gif) C group.
C group.
 |
| | Fig. 1 (a) Schematic representation of selected ILs. (b) The optimization structures of ILs with the electrostatic potential map (isovalue 0.0004, scale −0.0722; +0.0722). | |
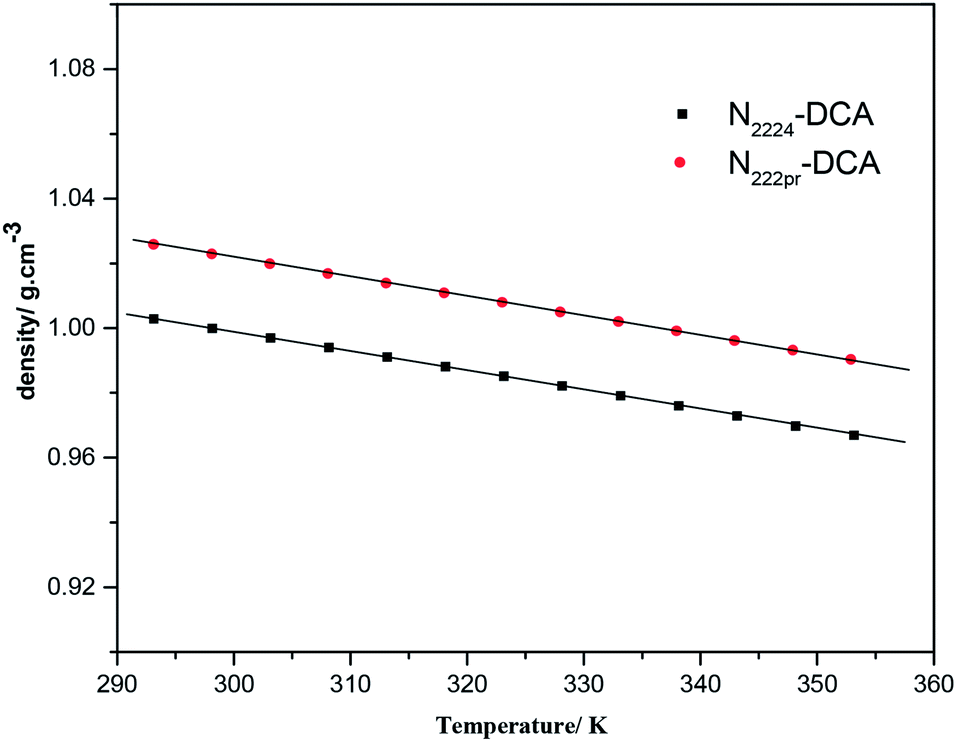
3.2 Thermal expansion properties of ILs
The densities ρ of as-prepared ILs were measured at ambient pressure over the temperature range of 298–353 K to determine their thermal expansion properties (Fig. 2). Table 1 indicates that densities of N222pr–DCA and N2224–DCA calculated at 298 K are quite similar and equal to 1.0226 and 0.9998 g cm−3, respectively. Such a similarity is due to their comparable molecular weights (Fig. 1a). These density values are in the same order of magnitude than common tetraalkylammonium –based ILs.13–15 Fig. 2 confirms that all densities vary linearly with the temperature, in a good agreement with previously investigated ILs fluids.34–36 When the temperature increases from 298 to 353 K, small density variations are observed and estimated at 3.48% for N222pr–DCA and 3.58% for N2224–DCA (Fig. 2), suggesting weak expansion abilities for both ILs fluids during the heating process.
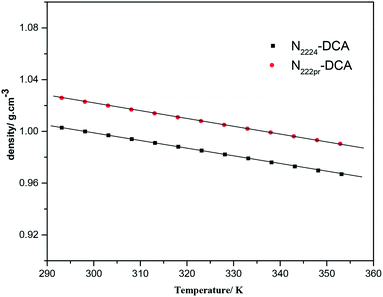 |
| | Fig. 2 Variations of the density of selected ILs with the temperature. | |
Table 1 Physical properties of ILs measured at 298 K
| IL |
Vm/cm3mol−1 |
ρ/g cm−3 |
αp 104/K−1 |
η/mPa s |
κ/mS cm−1 |
| N2224–DCA |
224.39 |
0.9998 |
6.01 |
56.91 |
5.26 |
| N222pr–DCA |
201.73 |
1.0226 |
5.90 |
37.51 |
11.68 |
| IL |
Λ/S cm2 mol−1 |
Ec/V |
Ea/V |
PW/V |
(H2O)/ppm |
| N2224–DCA |
1.18 |
−1.70 |
1.40 |
3.10 |
110 |
| N222pr–DCA |
2.40 |
−1.28 |
1.93 |
3.21 |
122 |
The study of the temperature effect on the volume expansion was performed by measuring the isobaric thermal expansion coefficient (αp) for each IL with the following equation.
| |
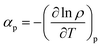 | (4) |
where,
ρ is the density in g cm
−3,
T is the temperature in K and
P is a fixed pressure. The variation of ln
ρ with the temperature was plotted for the calculation of
αp coefficients (Fig. S1
†).
Table 1 indicates that
αp coefficients of N
222pr–DCA and N
2224–DCA are quite similar. They are found to be in the same order of magnitude than common aprotic ammonium-based ILs,
7 but nearly the half of
αp values reported for common organic solvents used in commercial supercapacitors, including γ-butyrolactone (11.5 10
−4 K
−1) and acetonitrile (14.97 10
−4 K
−1).
37 Thus, as-prepared ILs exhibits small isobaric thermal expansions and a promising thermal behaviour for practical applications.
Recently, several authors applied the empirical model of lattice energy (UPOT) of ionic solids for ILs electrolytes.38–40 In this case, the coulombic interaction between ions may be deduced from the empirical equation given in eqn (5).39,41,42 For this model, the calculation of UPOT only relies on the chemical formula, the ionic charges and the molecular volume (or density).43
| |
 | (5) |
where
I,
α and
β are chosen according to the stoichiometry of the salt. For as-studied ILs with formula (M
+–A
−), the charge ratio is 1
:
1,
I is equal to 1,
α is equal to 117.3 kJ mol
−1 nm,
β is equal to 51.9 kJ mol
−1 and
Vm is expressed in nm.
3 This model is applied in the present work to (i) estimate the lattice potential energies of selected ILs and their relative stabilities, (ii) provide the relative coulombic interactions between cations and anions, (iii) characterize their ionic mobility and (iv) compare the
UPOT values deduced from
eqn (5) to those presented in
Table 2. Using the molar volume calculated from
Table 1 ((
Vm/nm
3) = 1.66 × 10
−3 ×
Vm/cm
3 mol
−1),
39 the lattice potential energies (
UPOT) of all ILs were readily determined using
eqn (5). The dipoles, the partial charges, the cation volume (
Vcation) and the anion volume (
Vanion) of each IL were computed by the B3LYP/6–311++G(d,p)//B3LYP/6-31+G(d) level of theory. The calculated and predicted results are summarized in
Table 2.
Table 2 Parameters calculated from eqn (5) and predicted by Gaussian 09 Package within Gauss-View 5.0 using the DFT/B3LYP/6–311++G and 6–31+ (d, p) level of theory for all investigated ILs
| IL |
Charge on (N) in the cation |
Charge on (N) in the anion |
Vanion/nm3 (predict) |
Vcation/nm3 (predict) |
| N222pr–DCA |
+0.064 |
(N) −0.41 |
0.089 |
0.243 |
| N2224–DCA |
+0.067 |
(N) −0.40 |
0.089 |
0.272 |
| IL |
Vm/nm3 (predict) |
Vm/nm3 (cal.) |
UPOT/kJ mol−1 (predict) |
UPOT/kJ mol−1 (cal.) |
| N222pr–DCA |
0.332 |
0.334 |
339 |
338 |
| N2224–DCA |
0.361 |
0.372 |
320 |
314 |
The computed molar volume of IL is the sum of Vcation and Vanion. Both values of UPOT are very close and indicate comparable relative stabilities for the selected ILs. On the other hand, calculated UPOT values of our DCA based ILs are lower than values of their corresponding pyrrolidinium, morpholinium and piperidinium analogues.29,44,45 Such a result suggests a weaker coulombic interactions inside the structure. As the coulombic interactions between the cation and the anion tend to decrease the mobility of the IL, the ionic conductivities of the selected DCA based ILs are expected to be higher than their pyrrolidinium, morpholinium and piperidinium counterparts.
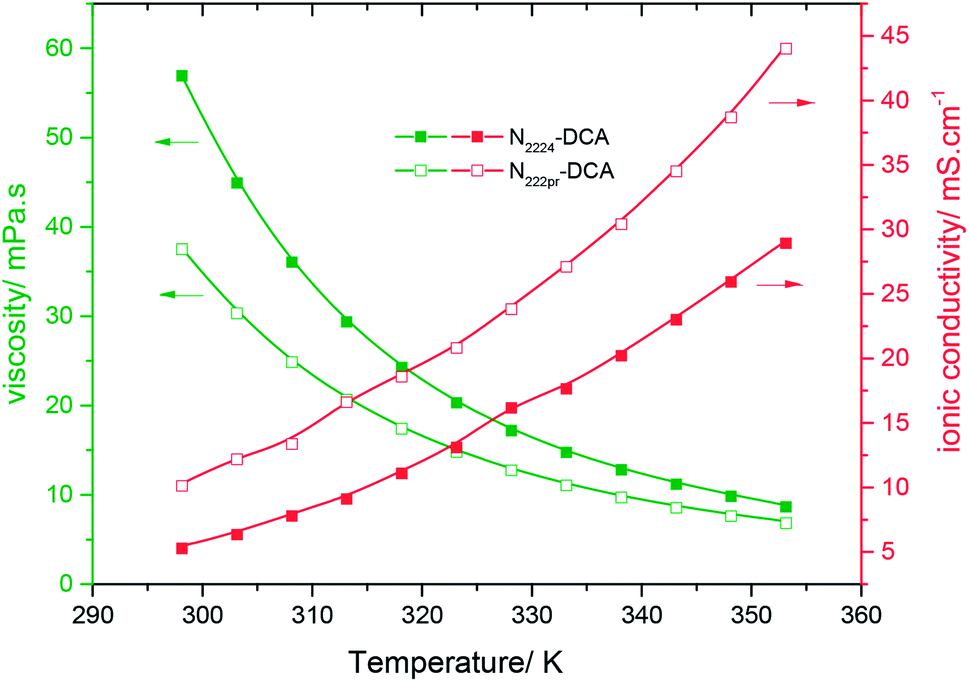
3.3 Transport properties and ionicities of ILs
Table 1 indicates that viscosities of N222pr–DCA (37.51 mPa s) and N2224–DCA (56.91 mPa s) at 298 K are much lower than values reported for most employed ILs in electrochemical applications and based on trietlyl-alkylammoniumn, e.g. N2224–TFSI (144.8 mPa s), N2226–TFSI (220 mPa s) and N2224–CH3COO (439 mPa s).13–15 However, the ionic conductivity of 5.26 mS cm−1 obtained for N2224–DCA (Table 1) is close to values of analogous electrolytes, i.e. alkylimidazolium, pyrrolidinium, morpholinium and piperidinium ILs, that range between 1 and 7 mS cm−1 at 298 K.7 Nevertheless, a much higher ionic conductivity is obtained for N222pr–DCA (11.68 mS cm−1), demonstrating a substantial effect the cation structure (N222pr+ vs. N2224+) on the transport properties of both electrolytes. This difference is mainly attributed to (i) the degree of dissymmetry of the charges distribution, (ii) the cation–anion distance and (iii) the geometry nature of the cation.6,46,47 For both ILs, N2224+ and N222pr+ cations are dissymmetric species, but the linear alkyl chain structure of N222pr+ imposes a more pronounced dissymmetry. As a result, the intramolecular interactions existing between N222pr+ and DCA− and governed by the attractive Colombian forces (inversely proportional to (r±)2) are weaker than those existing between N2224+ and DCA−. This is also supported by the longest cation–anion distance of 2.41 Å for N2224–DCA (vs. 2.26 Å for N222pr–DCA). Accordingly, the ionic mobility and the number of charge carriers, responsible of the ionic conductivity, are more important for N222pr–DCA IL, while the number of ion-pairs is higher for N2224–DCA IL (eqn (6) and (7)).| |
 | (6) |
| |
 | (7) |
The viscosities and conductivities were measured for temperatures varying from 298 to 353 K and plotted in Fig. 3. Increasing the temperature by only 45 K caused a drastic rise in ionic conductivity by +400% and +500% for N2224–DCA and N222pr–DCA, respectively. Hence, the kinetic energy highly enhances the ionic mobility of both ILs. The rise of temperature highly decreases the ionic intermolecular interaction between ILs molecules, which explains the obvious enhancement of the ionic conductivity.
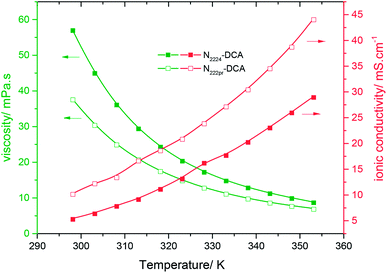 |
| | Fig. 3 Variations of the ionic conductivity (red curves) and the dynamic viscosity (green curves) of N2224–DCA (full squares) and N222pr–DCA (open squares) as a function of the temperature. | |
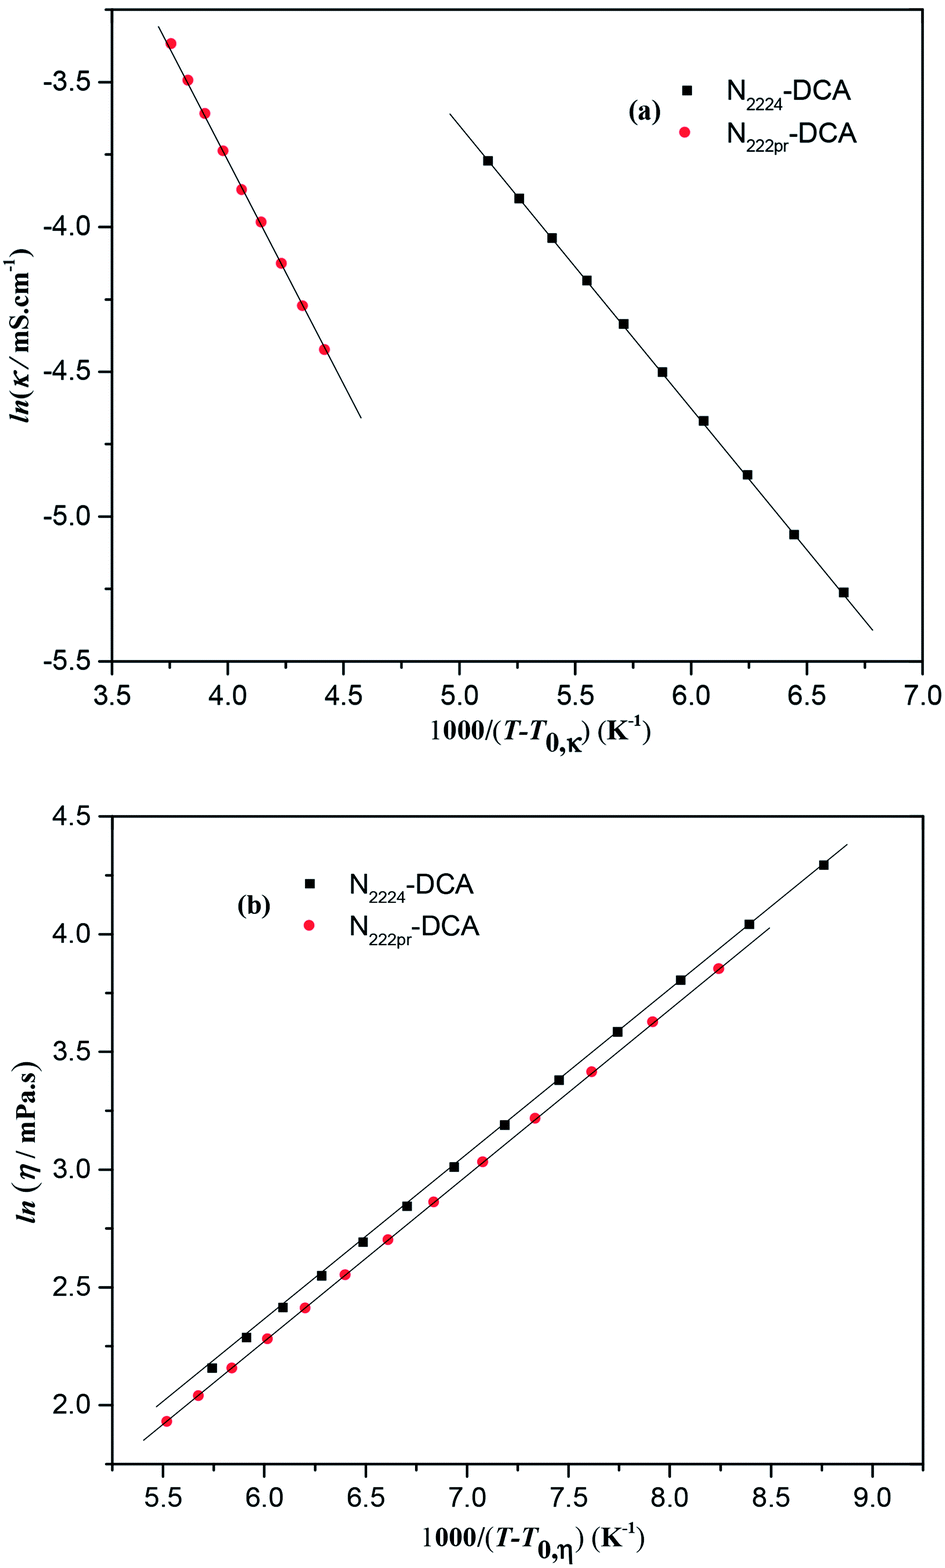
Despite the fact that the conductivity value of N222pr–DCA is nearly twice that of N2224–DCA, the rise of temperature by 45 K leads to a comparable increase in both ionic conductivities (+400% and +500%). This could be explained by their same DCA− constituting anions even though their cations structures are different. Consequently, the temperature-conductivity variations are probably more dependent on intermolecular interactions than intramolecular ones. The absence of a linear relationship between the ionic conductivity, as well as the dynamic viscosity, with T −1 indicates that transport properties are not governed by the Arrhenius model (Fig. S2 and S3†).34 However, the Vogel-Tammann-Fulcher (VTF) (eqn (8)) is the suitable model to describe the temperature dependence on transport properties of the selected dicyanamide-based ILs, as proved in Fig. 4a and b.48
| |
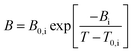 | (8) |
where, the pre-exponential term
B0,i corresponds to the ionic conductivity
κ0, or the dynamic viscosity
η0, at infinite temperature. The parameter
Bi is usually considered as a pseudo-activation energy for the ionic conductivity, or the dynamic viscosity, and corresponds to the slope of the VTF plots. The parameter
T0,i is defined as the ideal glass transition temperature where the ion mobility tends to zero.
48 The fitting parameters (
Table 3) deduced from the VTF model of selected dicyanamide-based ILs are in the same order than common ILs.
7,34,35,49 Further investigations are in progress to characterize the thermal properties of N
2224–DCA and N
222pr–DCA electrolytes as the decomposition temperatures, phase transitions, and glass transition temperature.
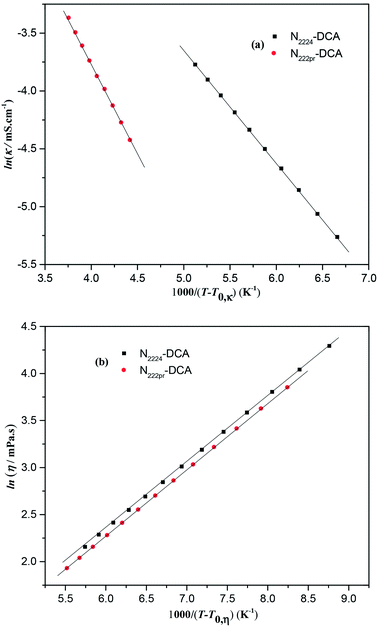 |
| | Fig. 4 (a) Variation of lnκ vs. 1000/(T − T0,κ) and (b) variation of lnη vs. 1000/(T − T0,η) for studied ILs when the temperature ranges from 298 to 353 K. | |
Table 3 Fitting parameters for VTF and Walden rule equations that describe the experimental viscosity and ionic conductivity of selected ILs
| IL |
η0/mPa s |
B0,η/K |
T0,η/K |
| N2224–DCA |
689 |
22.01 |
181 |
| N222pr–DCA |
718 |
15.05 |
171 |
| IL |
κ0/S cm−1 |
B0,κ/K |
T0,κ/K |
| N2224–DCA |
988 |
8.22 |
144 |
| N222pr–DCA |
1607 |
12.74 |
78 |
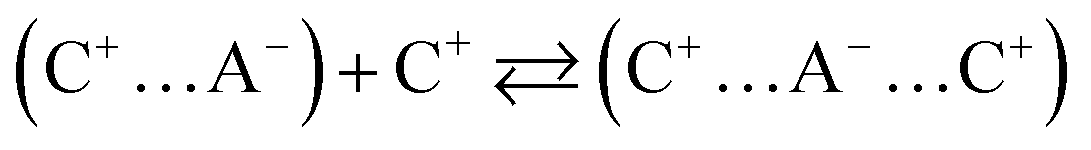
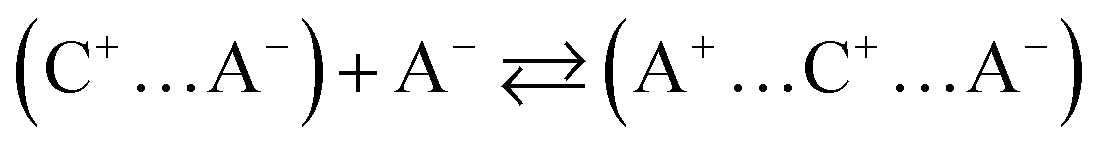
Typically, only a fraction of ions (C+ and A−) constituting the IL (C–A) is available to participate in the conduction mechanism. However, in some cases apart from the free ions, triple ions C2A+ and CA2− may be formed and contribute to the conduction mechanism of the IL.44 Indeed, if the dielectric constant value is lower than 10, the electrostatic ionic interactions are very strong.50 Therefore, the ion-pairs attract the free ions present in the solution and results in the formation of symmetrical triple-ions (eqn (9) and (10)).44,51 Taking into account the partial formation of ions-pairs, we can consider as a first approximation that the solution is composed by (i) completely dissociated C+ and A− single ions, (ii) completely dissociated C2A+ and CA2− triple ions and (iii) an undissociated part, i.e. the CA ion pairs.
| |
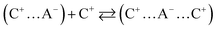 | (9) |
| |
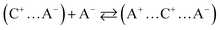 | (10) |
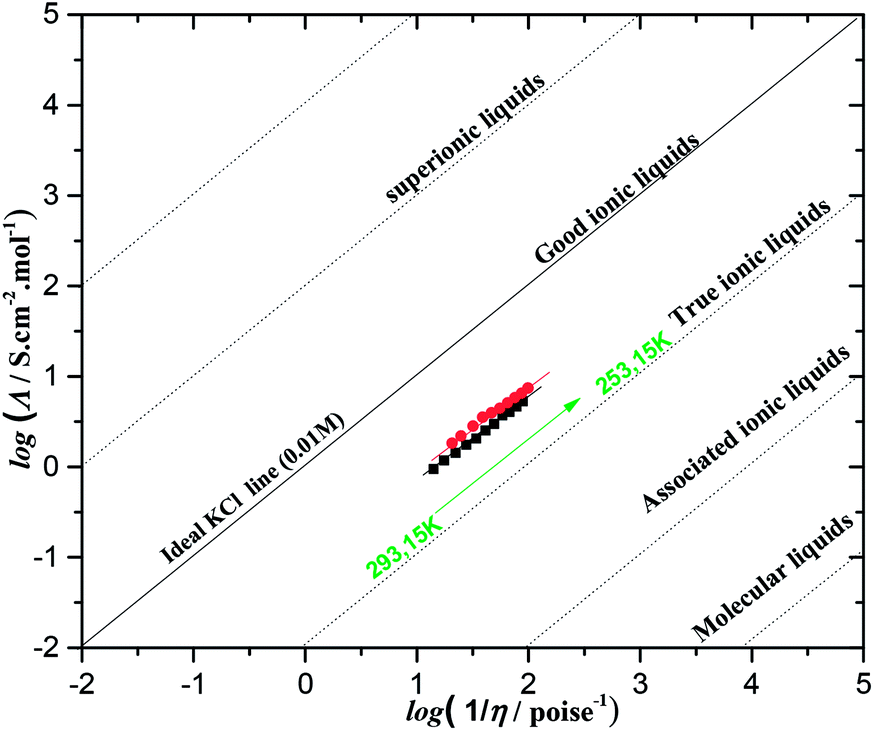
Based on the IL structure, the anion–cation interaction is the most important parameter to determine the degree of ions available for the conduction mechanism. To this end, the “Walden graph” is an effective way to evaluate the degree of IL ionicity as it represents the relationship between molar conductivity and fluidity (eqn (11))52,53.
where
C is a constant,
η is the viscosity of IL (poise),
Λ is the molar conductivity (
Λ =
κ ×
M/
ρ) (S cm
2 mol
−1,
M is the molecular weight) and
α is a coefficient (0<
α ≤ 1). The experimental
α values were obtained from the plot of ln(
Λ)
vs. ln(
η). The Walden graph is plotted in
Fig. 5 for temperatures ranging between 298 and 353 K. The effect of the molar conductivity
Λ on the fluidity
η−1 is investigated to compare the ionicities of both ILs.
Fig. 5 and
Table 1 indicate that N
222pr–DCA and N
222pr–DCA perfectly follow the Walden rule and their
α values are very close to the unity. Therefore, the conductivities of as-synthesized ILs are strictly controlled by the viscosity variations.
Fig. 5 also represents the ideal line drawn for KCl aqueous solution (0.01 M), which is considered as a reference and represents the total ionic dissociation of 100%. It should be noticed that N
2224–DCA and N
222pr–DCA are located below the “ideal KCl line” and displays a typical behaviour of “true ILs” (
Fig. 5), suggesting the formation of small fractions of ionic association for both ILs. In the same way, such behaviour explains the high ionic conductivities and the low viscosities values of N
2224–DCA and N
222pr–DCA when compared to common aprotic ammonium ILs.
46,47,52
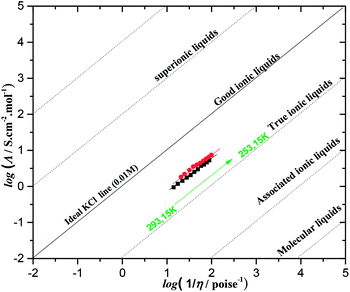 |
| | Fig. 5 Walden plots for dicyanamide-based ILs in the temperature range of 298–353 K. (Λ) is the equivalent molar conductivity and (η−1) is the fluidity. The ideal line (solid line) is generated from data obtained in aqueous 0.01 M KCl solution. | |
3.4 Electrochemical stability of ILs
The potential window (PW) is a determinant parameter for the electrochemical applications of ILs as supporting electrolytes for EDLCs.54 The cathodic (Ec) and anodic (Ea) potential limits, and the overall electrochemical windows (PW = Ea − Ec) were determined by linear sweep voltammetry for the studied ILs. The potential windows of N2224–DCA and N222pr–DCA are 3.10 and 3.21 V, respectively (Table 1). When compared to the literature data, these PW values are slightly higher than those of trialkylammonium based protic ILs,7,55 but 1 V lower than several windows of aprotic ILs (e.g. ammonium or pyrrolidinium -based ILs with fluorinated anions: TFSI−, BF4− and PF6− (ref. 7)). In our case, the reduction process is expected to involve the positively charged nitrogen of tetraalkylammonium. As shown in Table 1 and Fig. 6, the cathodic limit is more important when N2224+ (−1.7 V) is the cation constituent. This suggests that increasing the length of the alkyl chain or changing its geometry, by substituting (–CCH) unit by (–CH2–CH2–CH3) group, is favourable for the cathodic stability of the IL electrolyte. On the other hand, the anodic decomposition of both ILs occurs at +1.40 V for N2224–DCA and +1.93 V for N222pr–DCA. For the same DCA− constituting anion, the various anodic limits can be due to the variable strengths of physical interactions existing between DCA− and N2224 or N222pr cation.56,57
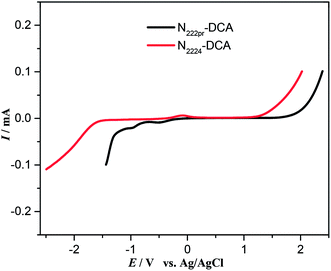 |
| | Fig. 6 Linear sweep voltammetry of selected ILs recorded on a vitreous carbon electrode vs. Ag/AgCl(IL) at a scan rate of 10 mV s−1. | |
3.5 Electrochemical performances of the EDLC devices
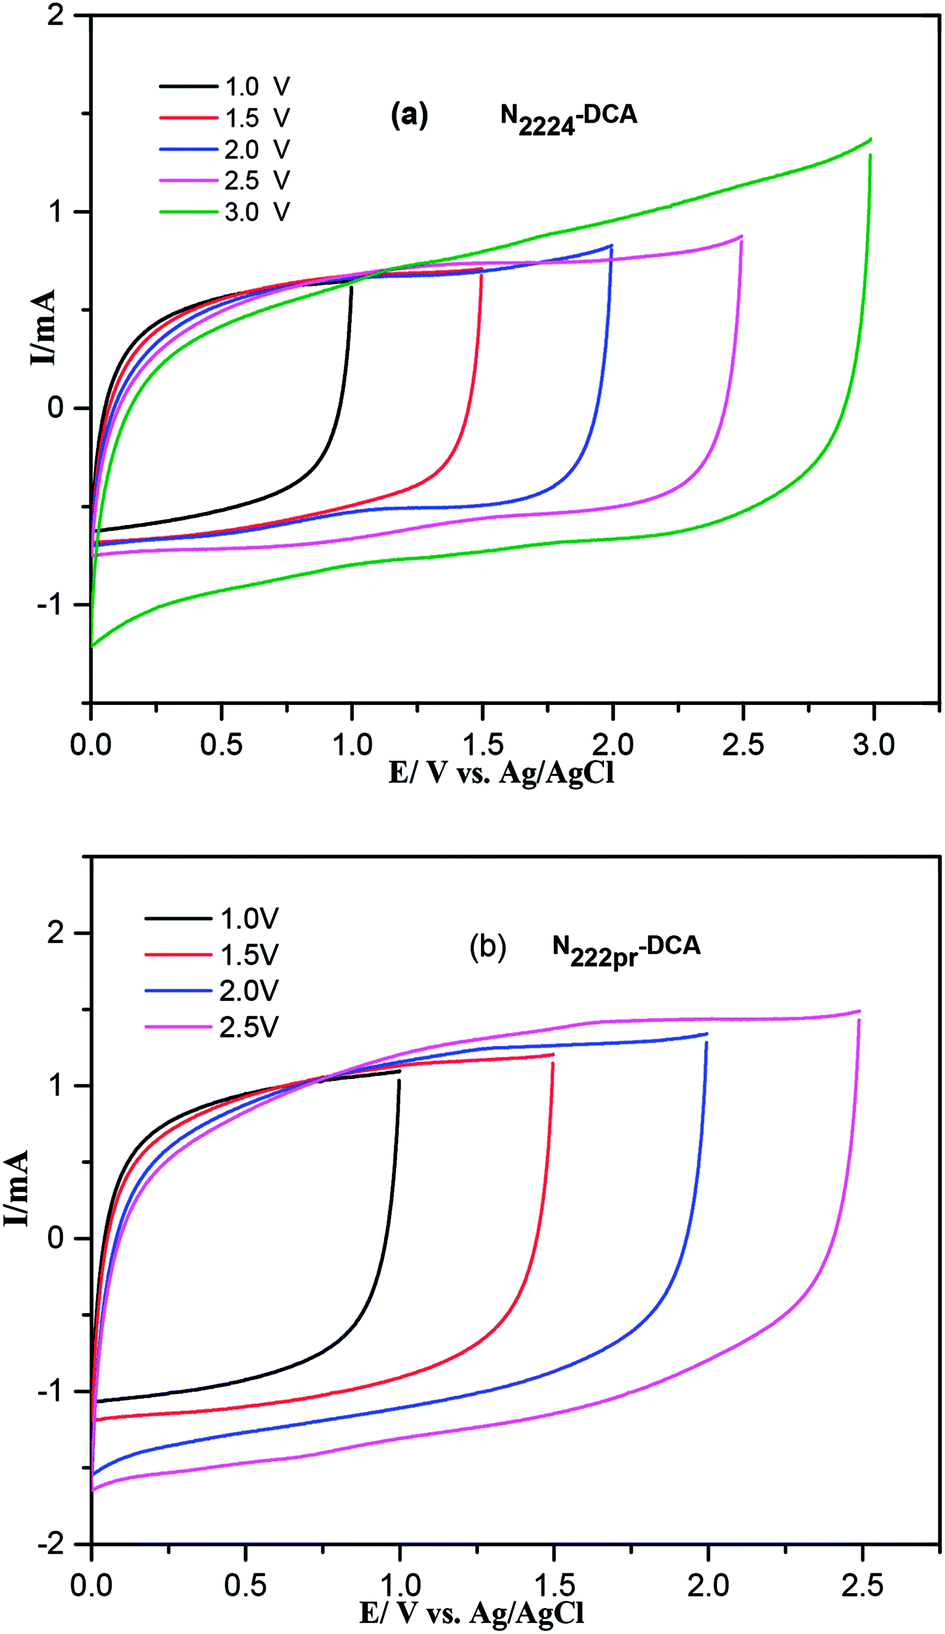
Fig. 7 shows the CV curves of GNS-based electrodes in the presence of N2224–DCA and N222pr–DCA for increased anodic potential limits. The operating cell voltages are 0–3 V and 0–2.5 V for N2224–DCA and N222pr–DCA, respectively. The maximum operating voltage was determinate by cyclic voltammetry (Fig. S4-a and b†) recorded for single electrodes in three-electrodes cells using a Ag/AgCl, KClsat (BMPYR14-TFSI) reference electrode. The positive and negative maximum operative voltages were deduced by monitoring the coulombic efficiency (ratio of discharge and charge areas). The limits were set by using a coulombic efficiency of 98.5% as a “cut-off’’ limit. In both operating windows, the CV curves exhibit rectangular shapes, typical of an ideal capacitive behavior. The CV curves of GNS electrodes are presented in Fig. 8 for both ILs at various scan rates. The shapes of CV curves are nearly rectangular at all scan rates and typical of an electrical double layer behavior. At the highest scan rate of 100 mV s−1, the CV curves are less steep at the potential switching limits, indicating a resistive behavior due to the large polarization resistance at fast scan rates.
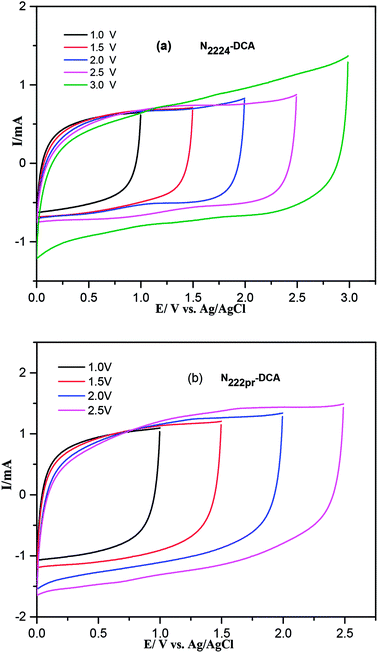 |
| | Fig. 7 Comparison of CV curves recorded with symmetrical cells in the presence of (a) N2224–DCA and (b) N222pr–DCA electrolytes in various potential windows. Scan rate = 20 mV s−1. | |
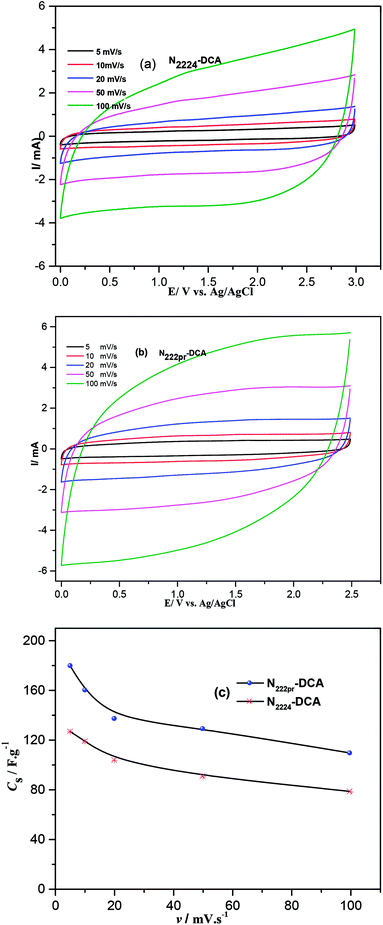 |
| | Fig. 8 CV curves of symmetrical cells recorded at various scan rates in the presence of (a) N2224–DCA and (b) N222pr–DCA electrolytes and (c) variation of the specific capacitances with the scan rate. | |
In this case, the electrode/electrolyte interface should be less resistive and exhibits faster kinetic because the ionic conductivity of N222pr–DCA (11.68 mS cm−1) is much higher than the one of N2224–DCA (5.26 mS cm−1). The specific capacitances, estimated from CV curves, are plotted as a function of the scan rate in Fig. 8c. Better capacitances are displayed in the presence of N222pr–DCA electrolyte thanks to its higher ionic conductivity and lower viscosity. In addition, the smaller cation size of N222pr+, when compared to N2224+, may facilitates their reversible adsorption on the graphene nanosheets. For N2224–DCA ILs electrolytes, 70% of the maximum capacitance is retained when the sweep rate is increased by 20 times, while the capacitance retention equals 60% in the presence of N222pr–DCA. This difference highlights the promoted rate capability of the cell using N2224–DCA electrolyte at high potential sweep rates.
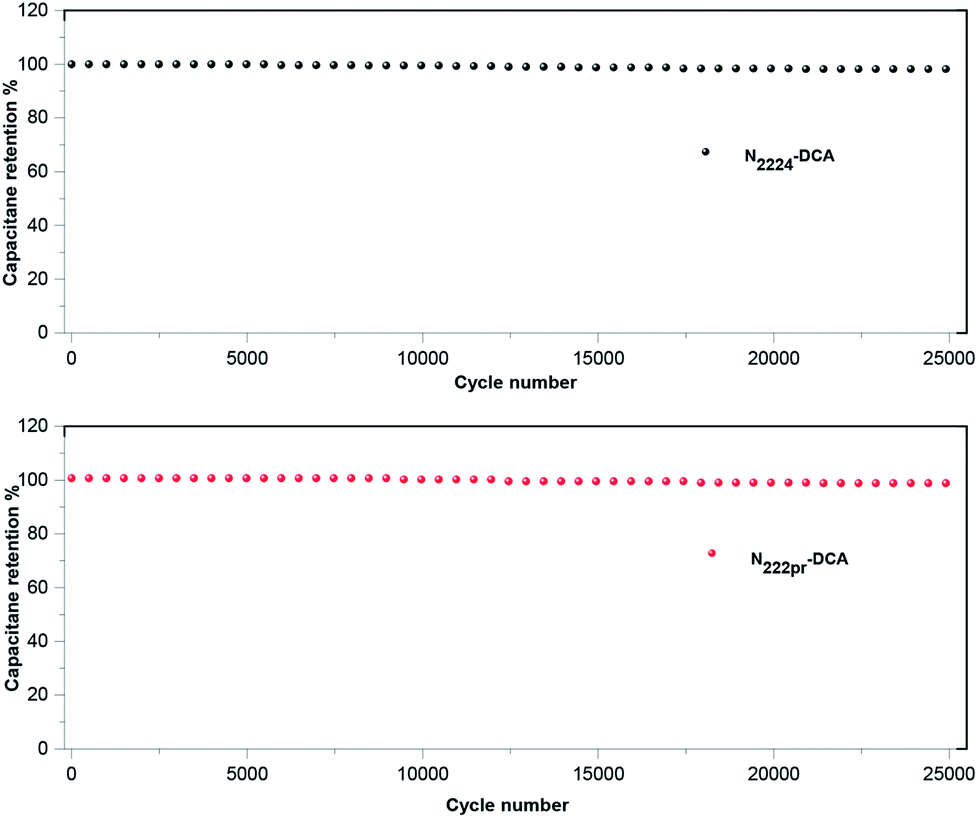
The electrochemical stability was performed by galvanostatic cycling at 1.5 A g−1. The operating potential window was choiced according to the nature of IL electrolyte (Fig. 7). All EDLCs display a very good stability over cycling (Fig. 9). Indeed, they all maintain their initial capacitance after 25.000 cycles.
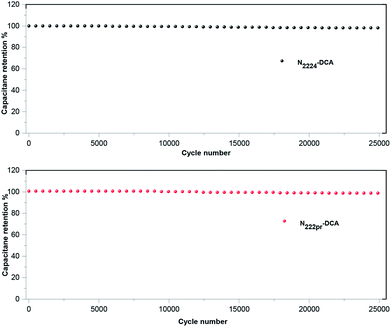 |
| | Fig. 9 Evolution of the capacitance obtained by galvanostatic cycling (1.5 A g−1) for symmetrical cells employing N2224–DCA and N222pr–DCA as electrolyte. | |
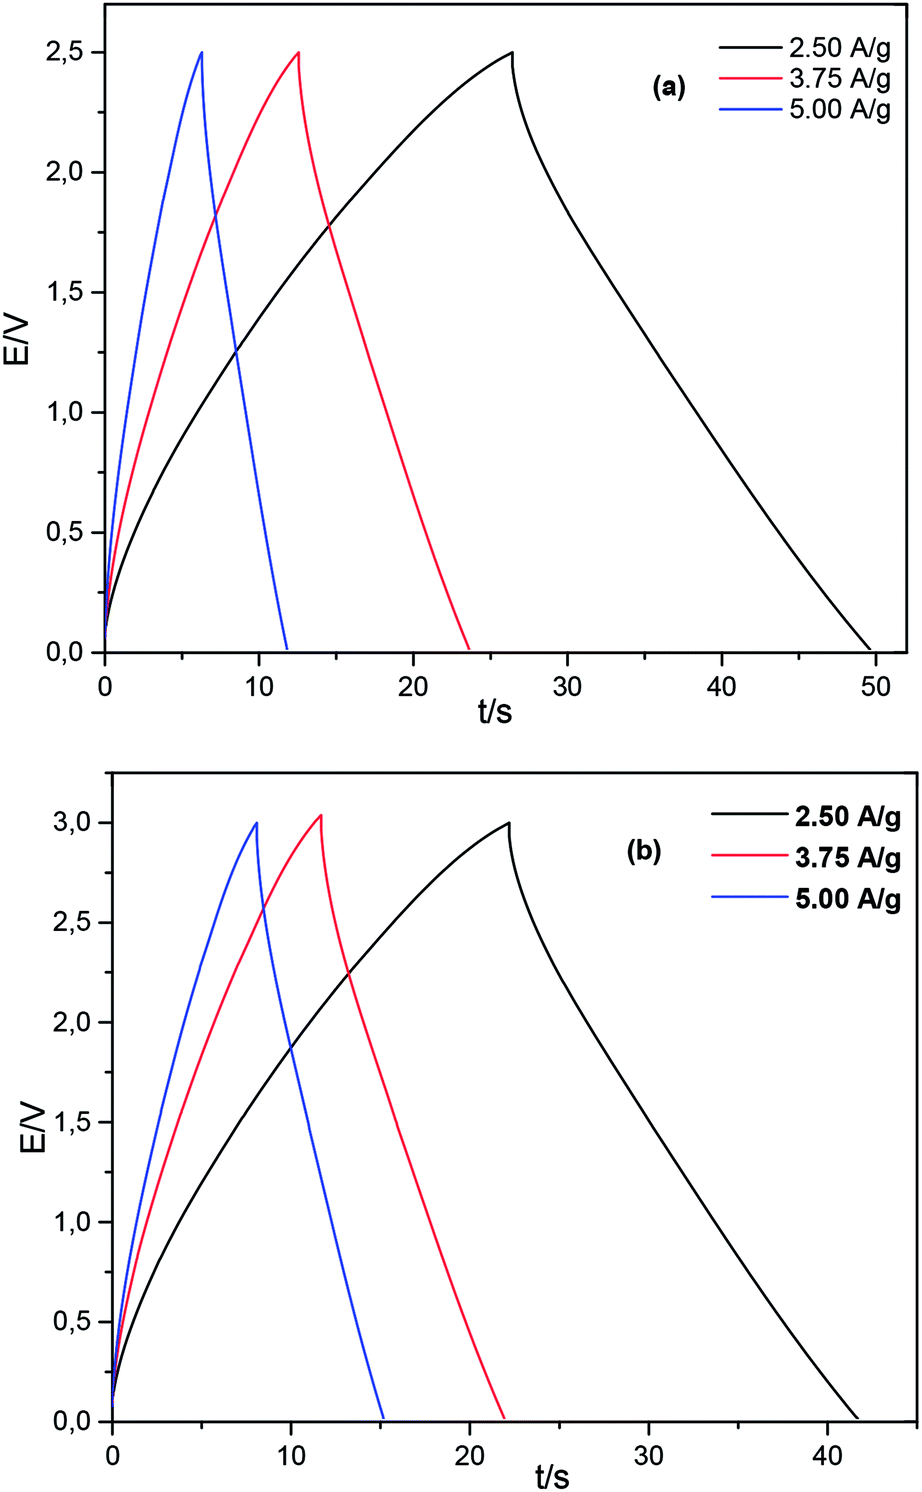
Accordingly, the proposed GNS/N2224–DCA and GNS/N222pr–DCA cells have a great potential for application in supercapacitors with a stable performance. Galvanostatic charge/discharge curves were performed to further compare the electrochemical performances of GNS-based electrodes in the presence of N2224–DCA and N222pr–DCA electrolytes. According to the voltage window defined in Fig. 6, symmetric supercapacitor coin cells GNS/N2224–DCA/GNS and GNS/N222pr–DCA/GNS were assembled and tested. Fig. 10 shows the chronopotentiograms recorded at increased current densities of 2.5, 3.75 and 5 A g−1. For both voltage windows, the charge and discharge branches of all cells are almost linear and symmetric, indicating high capacitive behaviours in a good agreement with the cyclic voltammetry data. The specific discharge capacitance (Cs), the energy density and the power density are calculated from the galvanostatic data and listed in Table 4 as a function of the applied current density. The discharge capacitance is progressively decreased when the applied current density increases, as expected.58,59 The capacitance retentions 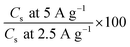 are equal to 78% and 65% for GNS/N2224–DCA/GNS and GNS/N222pr–DCA/GNS cells, respectively. The as-prepared supercapacitors exhibit high specific capacitance even at a high current density. Independently on the current value, the specific capacitances of the GNS/N222pr–DCA/GNS cell are more elevated than those of GNS/N2224–DCA/GNS, in accordance with the cyclic voltammetry data (Fig. 8c). Again, the higher ionic conductivity of N222pr–DCA electrolyte is responsible of the better capacitance of GNS/N222pr–DCA/GNS device. However, the slightly higher energy and power densities of GNS/N2224–DCA/GNS device (Table 4) are explained by the larger voltage window exhibited in the presence of N2224–DCA electrolyte (Fig. 7).
 |
| | Fig. 10 Charge/discharge galvanostatic curves of (a) GNS/N2224–DCA/GNS and (b) GNS/N222pr–DCA/GNS symmetrical cells for various current densities. | |
Table 4 Specific capacitance, energy density and power density of GNS/N2224–DCA/GNS and GNS/N222pr–DCA/GNS symmetrical supercapacitors
| I (A g−1) |
N2224–DCA |
N222pr–DCA |
| Specific capacitance (F g−1) |
| 2.50 |
42 |
55 |
| 3.75 |
38 |
42 |
| 5.00 |
33 |
36 |
|
| Energy density (W h kg−1) |
| 2.50 |
55 |
49 |
| 3.75 |
47 |
36 |
| 5.00 |
40 |
30 |
|
| Power density (kW kg−1) |
| 2.50 |
11.1 |
9.1 |
| 3.75 |
16.5 |
13.5 |
| 5.00 |
22.2 |
18.0 |
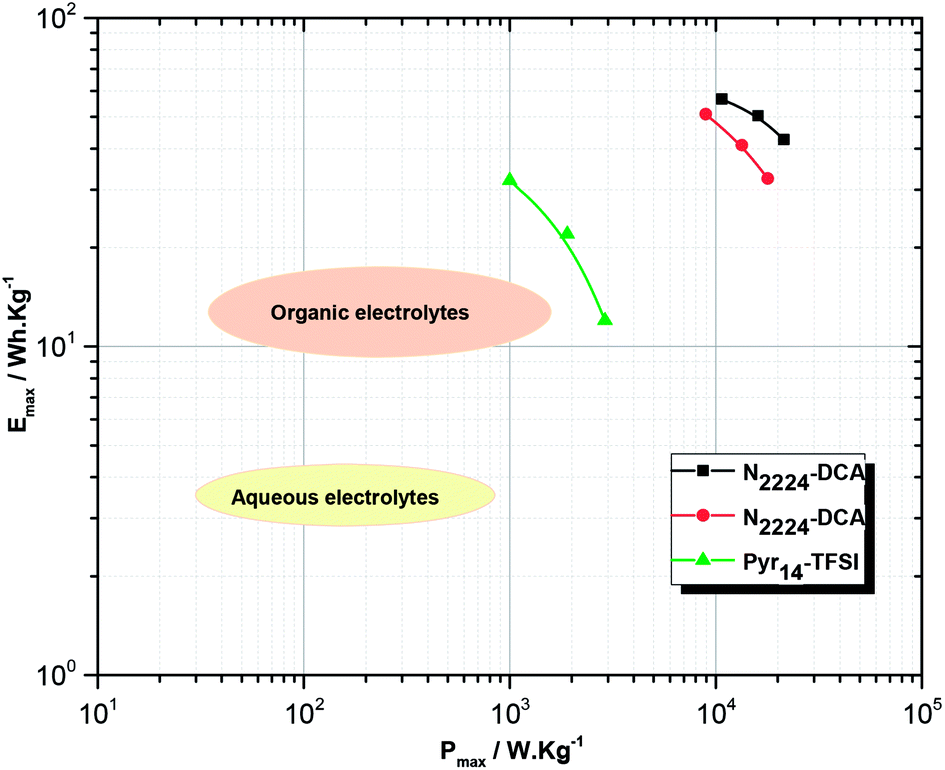
Fig. 11 reports the Ragone-like plot where the average energy and power densities are displayed for GNS/N2224–DCA/GNS and GNS/N222pr–DCA/GNS EDLCs. The energy and power characteristics of EDLCs were derived from galvanostatic charge–discharge curves taking into account the ohmic drops obtained at different current densities.36,60 The operating voltage of the cells using N2224–DCA and N222pr–DCA are 3.0 and 2.5 V, respectively. The highest specific energy of 55 W h kg−1 is exhibited at a current density of 2.5 A g−1 in the presence of N2224–DCA, which is due to its larger operating voltage. When the applied current density was increased up to 5 A g−1, the power densities exhibited in N2224–DCA and N222pr–DCA are 20 and 18 kW kg−1, while the energy densities are 40 and 30 W h kg−1, respectively. Fig. 11 shows that the power and energy densities of EDLCs employing N2224–DCA and N222pr–DCA ILs as electrolytes are better than those reported for common organic and aqueous electrolytes used for EDLCs devices at room temperature.1,2,5,61 For comparison, also energy and power densities delivered by EDLC devices containing one commonly employed Pyr14–TFSI electrolyte are included.60 It is observed that N2224–DCA and N222pr–DCA ILs can perform better as EDLC electrolytes than Pyr14–TFSI at room temperature. The limited performance delivered by Pyr14–TFSI EDLCs is mainly attributed to the much higher viscosity and lower ionic conductivity of such electrolyte. On the other hand, comparatively to the literature data dealing with DCA-based electrolytes for EDLCs (Table 5), the competitive energy density (EDmax) values reached in the presence of as-investigated N2224–DCA and N222pr–DCA ILs are mainly due to their relatively higher ionic conductivities and capacitance. Furthermore, the highest EDmax value exhibited by BMIM–DCA EDLCs is explained by the larger electrochemical window and better ionic conductivity of BMIM–DCA electrolyte. Accordingly, the studied EDLC cells are promising candidates for high-capacity and high-reliability energy-storage applications, including the field of electric vehicles.3,62
 |
| | Fig. 11 Ragone-like plot for symmetrical EDLCs cells employing N2224–DCA and N222pr–DCA ILs electrolytes. Values are derived from galvanostatic charge–discharge experiments at different current densities. For comparison data of a Pyr14TFSI (data taken from ref. 60), aqueous and organic electrolytes (data taken from ref. 61) based EDLCs are displayed in addition. | |
Table 5 Energy performances of as-prepared GNS/DCA–based IL EDLC cells compared to that of GNS/IL and activated carbon/IL EDLC cells reported in the literature
| Carbon-based EDLCs |
Electrolyte |
EDmax/W h kg−1 |
Ref. |
| Activated carbon (AC) electrodes |
PYR14–DCA |
7.2 |
35 |
| PYR13–DCA |
7.7 |
| PYR12O1–DCA |
9.2 |
| Graphene nanosheets (GNS) electrodes |
EMIM–DCA |
21 |
10 |
| EMIM–DCA |
48 |
22 |
| BMIM–DCA |
88 |
| N2224–DCA |
55 |
This work |
| N222pr–DCA |
49 |
4. Conclusions
The physical–chemical properties of ILs containing a DCA− anion paired with N2224+ or N222pr+ cations were investigated and applied as novel electrolytes for EDLCs. The dicyanamide-based ILs were shown to exhibit relatively low viscosities, high ionic conductivities and appropriate operating potential windows. The geometry and the length of the alkyl chain of trietlyammonium cation highly affected the ionic conductivity: 5.26 mS cm−1 for N2224–DCA and 11.68 mS cm−1 for N222pr–DCA, as well as the potential window: 3.10 V for N2224–DCA and 3.29 V for N222pr–DCA. However, the cation structure showed a negligible influence on the density and the isobaric thermal expansion coefficient of both electrolytes. The Vogel–Tammann–Fulcher model governed the variations of the ionic conductivity and dynamic viscosity over a temperature range of 298–353 K. The electrochemical performances of the DCA-based ILs were controlled by various physical properties. The EDLCs displayed the highest specific capacitances in the presence of N222pr–DCA owing to its high ionic conductivity, low viscosity and high iconicity. On the other hand, the highest energy density was exhibited in the presence of N2224–DCA and attributed to its larger operating voltage. The energy densities delivered by N222pr–DCA and N2224–DCA based EDLC are much higher than commonly used fluorinated aprotic ammonium ILs. Hence, our future investigations will be focused on the synthesis of the whole series of trietlyl-alkylammoniumn ILs family based on DCA anion.
Conflicts of interest
There are no conflicts of interest to declare.
Acknowledgements
This work was supported by the PHC-UTIQUE project (code 17G 1209), managed by the CMCU Committee, between Charles Gerhardt Institute of Montpellier, France and National Institute of Research and Physico-chemical Analysis, Tunisia. Furthermore, the authors want to thank all the staff of the Useful Materials Laboratory (LMU) and especially, Pr. Mohieddine Abdellaoui for the electrochemical analyses and Moomen Marzouki and Riadh Hamdi for helpful discussions.
References
- B. E. Conway, Electrochemical Supercapacitors, Springer US, Boston, MA, 1999 Search PubMed.
- T. Brousse, Supercapacitors based on carbon or pseudocapacitive materials, ISTE Ltd/John Wiley and Sons Inc, Hoboken, NJ, 2017 Search PubMed.
- R. Kötz and M. Carlen, Electrochim. Acta, 2000, 45, 2483–2498 CrossRef.
- B. Viswanathan, Energy sources: fundamentals of chemical conversion processes and applications, Elsevier, Amsterdam, Boston, 2017 Search PubMed.
- V. S. Bagotsky, A. M. Skundin and Y. M. Volfkovich, Electrochemical power sources: batteries, fuel cells, and supercapacitors, John Wiley & Sons, Inc, Hoboken, New Jersey, 2015 Search PubMed.
- C. Zhong, Y. Deng, W. Hu, J. Qiao, L. Zhang and J. Zhang, Chem. Soc. Rev., 2015, 44, 7484–7539 RSC.
- Ionic liquids: physicochemical properties, ed. S. Zhang, Elsevier, Amsterdam, The Netherlands, Boston, London, 1st edn, 2009 Search PubMed.
- R. Lin, P.-L. Taberna, S. Fantini, V. Presser, C. R. Pérez, F. Malbosc, N. L. Rupesinghe, K. B. K. Teo, Y. Gogotsi and P. Simon, J. Phys. Chem. Lett., 2011, 2, 2396–2401 CrossRef.
- D. R. MacFarlane, N. Tachikawa, M. Forsyth, J. M. Pringle, P. C. Howlett, G. D. Elliott, J. H. Davis, M. Watanabe, P. Simon and C. A. Angell, Energy Environ. Sci., 2014, 7, 232–250 RSC.
- M. Shi, S. Kou and X. Yan, ChemSusChem, 2014, 7, 3053–3062 CrossRef PubMed.
- P.-L. Huang, X.-F. Luo, Y.-Y. Peng, N.-W. Pu, M.-D. Ger, C.-H. Yang, T.-Y. Wu and J.-K. Chang, Electrochim. Acta, 2015, 161, 371–377 CrossRef.
- D. R. MacFarlane, N. Tachikawa, M. Forsyth, J. M. Pringle, P. C. Howlett, G. D. Elliott, J. H. Davis, M. Watanabe, P. Simon and C. A. Angell, Energy Environ. Sci., 2014, 7, 232–250 RSC.
- G. Wang, W. Hou, F. Xiao, J. Geng, Y. Wu and Z. Zhang, J. Chem. Eng. Data, 2011, 56, 1125–1133 CrossRef.
- Z. Wang, Y. Cai, T. Dong, S. Chen and X. Lu, Ionics, 2013, 19, 887–894 CrossRef.
- K. Huang, X.-M. Zhang, Y.-X. Li, Y.-T. Wu and X.-B. Hu, J. Membr. Sci., 2014, 471, 227–236 CrossRef.
- Y. Yoshida, O. Baba and G. Saito, J. Phys. Chem. B, 2007, 111, 4742–4749 CrossRef PubMed.
- D. R. MacFarlane, J. Golding, S. Forsyth, M. Forsyth and G. B. Deacon, Chem. Commun., 2001, 1430–1431 RSC.
- W. Zhou, X. Liu, K. Zhou and J. Jia, in Nanomaterials in Advanced Batteries and Supercapacitors, ed. K. I. Ozoemena and S. Chen, Springer International Publishing, Cham, 2016, pp. 271–315 Search PubMed.
- E. Frackowiak, Phys. Chem. Chem. Phys., 2007, 9, 1774 RSC.
- C. Xu, B. Xu, Y. Gu, Z. Xiong, J. Sun and X. S. Zhao, Energy Environ. Sci., 2013, 6, 1388 RSC.
- Carbon nanomaterials for advanced energy systems: advances in materials synthesis and device applications, ed. W. Lu, J.-B. Baek and L. Dai, Wiley, Hoboken, New Jersey, 2015 Search PubMed.
- A. M. Abioye and F. N. Ani, Renewable Sustainable Energy Rev., 2015, 52, 1282–1293 CrossRef.
- C.-H. Yang, P.-L. Huang, X.-F. Luo, C.-H. Wang, C. Li, Y.-H. Wu and J.-K. Chang, ChemSusChem, 2015, 8, 1779–1786 CrossRef PubMed.
- Y. B. Tan and J.-M. Lee, J. Mater. Chem. A, 2013, 1, 14814 RSC.
- F. M. Machado, S. B. Fagan, I. Z. da Silva and M. J. de Andrade, in Carbon Nanomaterials as Adsorbents for Environmental and Biological Applications, ed. C. P. Bergmann and F. M. Machado, Springer International Publishing, Cham, 2015, pp. 11–32 Search PubMed.
- M. Yang and B. G. Choi, J. Electroanal. Chem., 2016, 776, 134–138 CrossRef.
- R. Zarrougui, R. Hachicha, R. Rjab and O. Ghodbane, J. Mol. Liq., 2018, 249, 795–804 CrossRef.
- M. J. Frisch, G. W. Trucks, H. B. Schlegel, G. E. Scuseria, M. A. Robb, J. R. Cheeseman, G. Scalmani, V. Barone, G. A. Petersson, H. Nakatsuji, X. Li, M. Caricato, A. Marenich, J. Bloino, B. G. Janesko, R. Gomperts, B. Mennucci, H. P. Hratchian, J. V. Ortiz, A. F. Izmaylov, J. L. Sonnenberg, D. Williams-Young, F. Ding, F. Lipparini, F. Egidi, J. Goings, B. Peng, A. Petrone, T. Henderson, D. Ranasinghe, V. G. Zakrzewski, J. Gao, N. Rega, G. Zheng, W. Liang, M. Hada, M. Ehara, K. Toyota, R. Fukuda, J. Hasegawa, M. Ishida, T. Nakajima, Y. Honda, O. Kitao, H. Nakai, T. Vreven, K. Throssell, J. A. Montgomery Jr, J. E. Peralta, F. Ogliaro, M. Bearpark, J. J. Heyd, E. Brothers, K. N. Kudin, V. N. Staroverov, T. Keith, R. Kobayashi, J. Normand, K. Raghavachari, A. Rendell, J. C. Burant, S. S. Iyengar, J. Tomasi, M. Cossi, J. M. Millam, M. Klene, C. Adamo, R. Cammi, J. W. Ochterski, R. L. Martin, K. Morokuma, O. Farkas, J. B. Foresman and D. J. Fox, Gaussian 09, Revision B.01, Gaussian, Inc., Wallingford CT, 2009 Search PubMed.
- C. Lee, W. Yang and R. G. Parr, Phys. Rev. B, 1988, 37, 785–789 CrossRef.
- A. D. Becke, J. Chem. Phys., 1993, 98, 5648–5652 CrossRef.
- R. Zarrougui, R. Mdimagh and N. Raouafi, Sep. Purif. Technol., 2017, 175, 87–98 CrossRef.
- T.-Y. Wu, S.-G. Su, H. P. Wang, Y.-C. Lin, S.-T. Gung, M.-W. Lin and I.-W. Sun, Electrochim. Acta, 2011, 56, 3209–3218 CrossRef.
- K. Zhou, W. Zhou, X. Liu, Y. Sang, S. Ji, W. Li, J. Lu, L. Li, W. Niu, H. Liu and S. Chen, Nano Energy, 2015, 12, 510–520 CrossRef.
- R. Zarrougui, N. Raouafi and D. Lemordant, J. Chem. Eng. Data, 2014, 59, 1193–1201 CrossRef.
- A. J. R. Rennie, V. L. Martins, R. M. Torresi and P. J. Hall, J. Phys. Chem. C, 2015, 119, 23865–23874 CrossRef.
- C. Wolff, S. Jeong, E. Paillard, A. Balducci and S. Passerini, J. Power Sources, 2015, 293, 65–70 CrossRef.
- W. M. Haynes, D. R. Lide and T. J. Bruno, CRC handbook of chemistry and physics: a ready-reference book of chemical and physical data, 2016 Search PubMed.
- L. Glasser and H. D. B. Jenkins, Phys. Chem. Chem. Phys., 2016, 18, 21226–21240 RSC.
- L. Glasser, Thermochim. Acta, 2004, 421, 87–93 CrossRef.
- N. V. Plechkova and K. R. Seddon, Ionic liquids unCOILed: critical expert overviews, 2013 Search PubMed.
- K. Karu, A. Ruzanov, H. Ers, V. Ivaništšev, I. Lage-Estebanez and J. García de la Vega, Computation, 2016, 4, 25 CrossRef.
- A. R. Neale, S. Murphy, P. Goodrich, C. Schütter, C. Hardacre, S. Passerini, A. Balducci and J. Jacquemin, J. Power Sources, 2016, 326, 549–559 CrossRef.
- D. Santos, M. Santos, E. Franceschi, C. Dariva, A. Barison and S. Mattedi, J. Chem. Eng. Data, 2016, 61, 348–353 CrossRef.
- M. N. Roy, T. Ray, M. Chandra Roy and B. Datta, RSC Adv., 2014, 4, 62244–62254 RSC.
- K. Karu, A. Ruzanov, H. Ers, V. Ivaništšev, I. Lage-Estebanez and J. García de la Vega, Computation, 2016, 4, 25 CrossRef.
- X. Wang, Y. Chi and T. Mu, J. Mol. Liq., 2014, 193, 262–266 CrossRef.
- J. L. Copeland, Transport properties of ionic liquids, Gordon, Breach, New York, 1974 Search PubMed.
- R. Zarrougui, M. Dhahbi and D. Lemordant, J. Solution Chem., 2010, 39, 921–942 CrossRef.
- C. Liu, F. Xu, S. Feng, L. Zheng, H. Zhang, W. Feng, X. Huang, M. Armand, J. Nie and Z. Zhou, Electrochim. Acta, 2013, 99, 262–272 CrossRef.
- A. Rybinska-Fryca, A. Sosnowska and T. Puzyn, J. Mol. Liq., 2018, 260, 57–64 CrossRef.
- O. Hollóczki, F. Malberg, T. Welton and B. Kirchner, Phys. Chem. Chem. Phys., 2014, 16, 16880–16890 RSC.
- D. R. MacFarlane, M. Forsyth, E. I. Izgorodina, A. P. Abbott, G. Annat and K. Fraser, Phys. Chem. Chem. Phys., 2009, 11, 4962 RSC.
- A. B. Pereiro, J. M. M. Araújo, S. Martinho, F. Alves, S. Nunes, A. Matias, C. M. M. Duarte, L. P. N. Rebelo and I. M. Marrucho, ACS Sustainable Chem. Eng., 2013, 1, 427–439 CrossRef.
- N. DeVos, C. Maton and C. V. Stevens, ChemElectroChem, 2014, 1, 1258–1270 CrossRef.
- M. Anouti, M. Caillon-Caravanier, C. Le Floch and D. Lemordant, J. Phys. Chem. B, 2008, 112, 9406–9411 CrossRef PubMed.
- G. H. Lane, Electrochim. Acta, 2012, 83, 513–528 CrossRef.
- X. Lu, G. Burrell, F. Separovic and C. Zhao, J. Phys. Chem. B, 2012, 116, 9160–9170 CrossRef PubMed.
- Z. Li, J. Wang, X. Liu, S. Liu, J. Ou and S. Yang, J. Mater. Chem., 2011, 21, 3397 RSC.
- K. Karthikeyan, D. Kalpana, S. Amaresh and Y. S. Lee, RSC Adv., 2012, 2, 12322 RSC.
- S. Pohlmann, B. Lobato, T. A. Centeno and A. Balducci, Phys. Chem. Chem. Phys., 2013, 15, 17287 RSC.
- L. Xia, L. Yu, D. Hu and G. Z. Chen, Mater. Chem. Front., 2017, 1, 584–618 RSC.
- A. Burke, J. Power Sources, 2000, 91, 37–50 CrossRef.
Footnote |
| † Electronic supplementary information (ESI) available: Arrhenius model for transport properties, operating voltage determination and 1H NMR Spectra of ILs. See DOI: 10.1039/c8ra05820b |
|
| This journal is © The Royal Society of Chemistry 2018 |
Click here to see how this site uses Cookies. View our privacy policy here. 
 Open Access Article
 This Open Access Article is licensed under a Creative Commons Attribution-Non Commercial 3.0 Unported Licence
 *a,
Rahma Hachichaabc,
Refka Rjabab,
Sabri Messaoudid and
Ouassim Ghodbanea
*a,
Rahma Hachichaabc,
Refka Rjabab,
Sabri Messaoudid and
Ouassim Ghodbanea


 are equal to 78% and 65% for GNS/N2224–DCA/GNS and GNS/N222pr–DCA/GNS cells, respectively. The as-prepared supercapacitors exhibit high specific capacitance even at a high current density. Independently on the current value, the specific capacitances of the GNS/N222pr–DCA/GNS cell are more elevated than those of GNS/N2224–DCA/GNS, in accordance with the cyclic voltammetry data (Fig. 8c). Again, the higher ionic conductivity of N222pr–DCA electrolyte is responsible of the better capacitance of GNS/N222pr–DCA/GNS device. However, the slightly higher energy and power densities of GNS/N2224–DCA/GNS device (Table 4) are explained by the larger voltage window exhibited in the presence of N2224–DCA electrolyte (Fig. 7).