 Open Access Article
Effect of the itinerant electron density on the magnetization and Curie temperature of Sr2FeMoO6 ceramics
Jin-Feng Wang *,
Teng-Fei Shi,
Zhao-Tong Zhuang,
Qian-Qian Gao and
Yan-Ming Zhang
College of Physics and Materials Science, National Demonstration Center for Experimental Physics Education, Henan Normal University, Henan Key Laboratory of Photovoltaic Materials, Xinxiang 453007, China. E-mail: jfwang@htu.edu.cn
First published on 14th August 2018
Abstract
The itinerant electron density (n) near the Fermi level has a close correlation with the physical properties of Sr2FeMoO6. Two series of single-phase Sr(2−y)NayFeMoO6 (y = 0.1, 0.2, 0.3) and Sr(2−y)NayFe(1−x)Mo(1+x)O6 (y = 2x; y = 0.1, 0.2, 0.3) ceramics were specially designed and the itinerant electron density (n) of them can be artificially controlled to be: n = 1 − y and n = 1 − y + 3x = 1 + 0.5y, respectively. The corresponding crystal structure, magnetization and the ferromagnetic Curie temperature (TC) of two subjects were investigated systematically. The X-ray diffraction analysis indicates that Sr(2−y)NayFeMoO6 (y = 0.1, 0.2, 0.3) have comparable Fe/Mo anti-site defect (ASD) content in spite of decreased n. However, a drastically improved Fe/Mo ASD can be observed in Sr(2−y)NayFe(1−x)Mo(1+x)O6 (y = 2x; y = 0.1, 0.2, 0.3) caused by the intrinsic wrong occupation of normal Fe sites with excess Mo. Magnetization–magnetic field (M–H) behavior confirms that it is the Fe/Mo ASD not n that dominantly determines the magnetization properties. Interestingly, approximately when n ≤ 0.9, TC of Sr(2−y)NayFeMoO6 (y = 0.1, 0.2, 0.3) exhibits an overall increase with decreasing n, which is contrary to the TC response in electron-doped SFMO. Such abnormal TC is supposed to relate with the ratio variation of n(Mo)/n(Fe). Moreover, when n ≥ 1, TC of Sr(2−y)NayFe(1−x)Mo(1+x)O6 (y = 2x; y = 0.3) exhibits a considerable rise of about 75 K over that of Sr(2−y)NayFe(1−x)Mo(1+x)O6 (y = 2x; y = 0.1), resulting from improved n caused by introducing excess Mo into Sr(2−y)NayFeMoO6. Maybe, our work can provide an effective strategy to artificially control n and ferromagnetic TC accordingly, and provoke further investigation on the FeMo-baseddouble perovskites.
I. Introduction
A strongly correlated electron system Sr2FeMoO6 (SFMO) has been extensively investigated due to its rich physical properties. Ferromagnetic SFMO material has a half-metallic nature with a 100% spin polarization at the ground state, an attractive low-field magnetoresistance response and a high TC of approximately 415 K.1–5 Materials combing such functional properties are very rare. Therefore, SFMO has become one of the most promising materials for its scientific research values and potential technological applications.2,6–8The electron configuration in SFMO near the Fermi level is basically described by the localized spin-up electrons of the 3d5 (Fe3+) and the itinerant spin-down electron of the 4d1 (Mo5+) shared by the Fe3+ (t2g↓)-O(2p)-Mo5+(t2g↓) subband.2,3,9,10 The Fe3+ (3d5: S = 5/2) antiferromagnetically interacts with Mo5+(4d1: S = 1/2), leading to an ideal saturated magnetization (Ms) of 4μB/f.u. However, a much smaller Ms than 4μB/f.u. is commonly observed in experiments because of the appearance of the Fe/Mo anti-site defect (ASD, i.e., the Fe occupies the Mo site and vice versa).11–13 It has been widely accepted that ASD mainly control the magnetization.11,13,14 The itinerant electron contributed by the Mo5+ cation mediates the ferromagnetic coupling between neighbour Fe cations via a double-exchange-like model.3,15–17 The strengthen of the ferromagnetic interaction has a direct correlation with the density of the electron at the conduction band, which can be modified effectively by electron-doping or hole-doping. For example, substituting the divalent A2+ ions in A2FeMoO6 (A: Ca2+/Sr2+/Ba2+) with the trivalent ions (such as La3+, Nd3+, Sm3+ etc.), a significantly improved TC can be observed due to the increased electron density caused by electron injection into the conduction band.9,16,18–24 Contrary to the TC response, the Fe/Mo ordering degree, saturated magnetization and magnetoresistance are reduced.9,18,21,25,26 However, reports of the effect of hole-doping on the carrier density and the physical properties are relatively rare. Moreover, there are still controversies on the influence of the hole doping on the carrier density, ASD, magnetization and TC. Mainly two aspects can be addressed. One is that, TC should lessen caused by a decreased carrier density near the Fermi level, which is contributed by the hole-doping effect.27,28 However, an improved TC is reported in some literatures.29,30 Second, it is failure to reaches a consensus over the effect of hole-doping on the ASD and magnetization. K-substituted A2FeMoO6 systems (A: Sr2+/Ba2+) show an improved ASD concentration, thus a decreased magnetization.27 On the contrary, Zhang et al. hold that Na-doping reduces the ASD content of SFMO and optimizes magnetization at a certain substitution level.29 However, Yoshida et al. claimed that, ASD is insensitive to the Na-content in Ba2−xNaxFeMoO6, the decreased magnetization has no relation with the ASD content nor carrier density, but caused by the increased O2p ligand hole.31 Therefore, it is necessary to investigate itinerant electron density, magnetization and Curie temperature by an appropriate hole-doping in SFMO.
Actually, the itinerant electron at the conduction band in SFMO is vital to maintain the ferromagnetic characteristic. For example, partially replacing Mo5+ cation with W6+ in Sr2FeMo1−xWxO6 can greatly weaken the ferromagnetic interaction, and even transit a ferromagnetic into an antiferromagnetic coupling,32,33 thus a suppressed TC is observed. It is noted that the itinerant electron is contributed by Mo5+ cation. Hence, it may be an effective method to increase the itinerant electron density by introducing excess Mo into SFMO. As mentioned above, hole-doped A2FeMoO6 (A: Sr/Ba) systems demonstrate a decreased itinerant electron density near the Fermi level due to electron extraction effect from the conduction band.27–29 Therefore, introducing an appropriate excess Mo into hole-doped SFMO possibly not only offset the decreased carrier density but also has a surplus of carrier density. Then the magnetization and TC will be accordingly manipulated. The corresponding research works are relatively rare.30 Hence, it is interesting to conduct further research on these subjects.
In this work, single-phased Na-doped Sr(2−y)NayFeMoO6 (y = 0.1, 0.2, 0.3) ceramics were prepared, here the nominal itinerant electron density (n) can be expressed: n = 1 − y, where n decrease with increasing Na-content (y). For comparison, pure Sr(2−y)NayFe(1−x)Mo(1+x)O6 with an excess Mo content for the same y values (y = 2x; y = 0.1, 0.2, 0.3) were also synthesized, here the nominal n is calculated to be n = 1 − y + 3x = 1 + 0.5y, where n in Sr(2−y)NayFe(1−x)Mo(1+x)O6 system increase with increasing Na-content (y). The itinerant electron density, and corresponding crystal structure, chemical states, magnetization and TC of two objective systems are investigated systematically and comparatively.
II. Experimental
For simplicity, singled phased Sr(2−y)NayFeMoO6 (y = 0.1, 0.2, 0.3) ceramics were labeled as C1, C3 and C5. Pure Sr(2−y)NayFe(1−x)Mo(1+x)O6 (y = 2x; y = 0.1, 0.2, 0.3) samples were identified as C2, C4 and C6, respectively. Each group of (C1, C2), (C3, C4), (C5, C6) has the same y value. The above-mentioned compositions were synthesized by a solid-state reaction method described as elsewhere.34,35 The typical experimental process can be expressed as below. First, all the raw materials of SrCO3 (99.9%), Na2CO3 (99.9%), Fe2O3 (99.9%), and MoO3 (99.5%) were calculated, dried and weighed according to the nominal chemical formulas, mixed homogeneously by ball milling in ethanol for 24 hours, and dried in air at 90 °C for 10 hours. The dried mixtures were calcined at 800 °C for 10 hours in air. Then, the calcined powders were ball milled in ethanol again for another 24 hours, and the slurry was dried and pressed into small thin pellets (10 × 1 mm). Finally, the pellets were sintered at 1280 °C for 12 hours in a reducing atmosphere of a mixed gas of 5% H2/95% Ar. Actually, in order to prepared high-quality ceramics, a sintering process was conducted with different experimental parameters. Here, we fix at 5% H2/95% Ar mixed gas, and then we carried out a systemic investigation by varying the sintering temperature (1050–1623 °C), the flowing rate of the gases (40–90 ml min−1) and the sintering time (30–3 h) for sintering. Briefly, in our experiments, it is found that too high or too low sintering temperature (>1623 °C, <1050 °C) generally lead to second phases. On the other hand, with moderate sintering temperature (1280 °C), single phase C1–C6 ceramics can be obtained readily. In fact, the flowing rate of the reducing gas is also a decisive factor at a given experimental condition for the fixed H2/Ar. For instance, phase-pure samples of SFMO can only be synthesized using 40–90 ml min−1 gas flow rates (5% H2/95% Ar). Exceeding the upper limit (90 ml min−1) not only diminishes the ordering degree but also introduces over reduced impurity phases such as SrMoO3, metal Fe and so on, whereas using less than the lower limit (40 ml min−1) leads to SrMoO4 as the second phase. Based on these results, with a fixed sintering temperature of 1280 °C, reducing gas of 5% H2/95% Ar, and flowing rate of 55 ml min−1, single phase C1–C6 ceramics are obtained by only varying the sintering time (3–30 h).The structure of the compositions was characterized by X-ray diffraction patterns (XRD, Bruker D8 Discover). The chemical states of the Fe and Mo cations were investigated by X-ray photoelectron spectroscopy (XPS, Thermo Scientific K-Alpha). The magnetic data were obtained using a superconducting vibrating sample magnetometer (VSM) and a physical property measurements system (PPMS Quantum Design, 2001NUGC).
III. Results and discussions
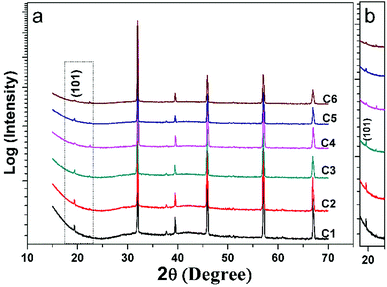
Fig. 1(a) shows all the XRD patterns of C1–C6 ceramics. One can see clearly that all the diffracted peaks of C1–C6 are well consistent with the double perovskite structure with a tetragonal phase and a space group of I4/m,3,36,37 and no second phases are identified. The superstructure diffraction peak (101) located at approximately 19.8 °C has a close correlation with the Fe/Mo ordering degree (Fig. 1(b)). As for the normalized XRD, the peak intensity of (101) has a positive correlation with Fe/Mo ordering degree, whereas a negative correlation with Fe/Mo ASD content. The (101) peak intensity of C1, C3 and C5 is comparable, indicating Fe/Mo ASD content of them are almost equivalent This result implies that Fe/Mo ASD content in Na-doped Sr(2−y)NayFeMoO6 (y = 0.1, 0.2, 0.3) systems are insensitive to both Na-doped concentration (y) and decreased n. The observations are in accordance with the published data in Na-doped Ba2−xNaxFeMoO6,31 but quite different from other similar hole-doped systems.27,29 Taking Sr2−xNaxFeMoO6 for example, the Fe/Mo ASD content decreases gradually with increasing Na-doped concentration. It is suggested that, Fe/Mo ASD content negatively relate to the charge difference between Fe and Mo cations, which may decrease because of a larger charge difference caused by the injection of the hole into the conduction band (Fig. 2).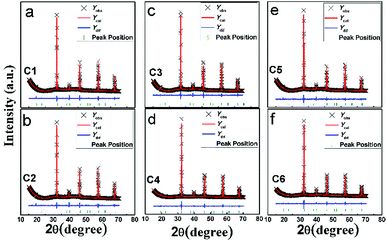 | ||
| Fig. 2 Observed (crosses), calculated (red solid line), and difference (blue solid line) XRD patterns of C1–C6. The bottom green bars indicate the peak positions. | ||
A comparable peak intensity of (101) of C1 and C2 (Sr(2−y)NayFe(1−x)Mo(1+x)O6; y = 2x; y = 0.1) implies that small amount of excess Mo has a negligent function on the Fe/Mo ordering degree. However, the suppression of the excess Mo content (x) on the Fe/Mo ordering degree become obvious when y increases to 0.1 (C4) and 0.15 (C6), as indicated in Fig. 1(b). The possible reason may lies in that replacing normal Fe site with excess Mo in Sr(2−y)NayFe(1−x)Mo(1+x)O6 will bring about intrinsic Fe/Mo ASD, thus an increased Fe/Mo ASD in C4 and C6 are observed. In order to give a quantitative estimation of Fe/Mo ASD concentration of the samples, all the X-ray profiles were investigated further using the refinements work, based on the tetragonal I4/m space group. It is noted that Sr/Na atoms were located at 4d (0, 0.5, 0.25) sites, Fe at 2a (0, 0, 0), Mo at 2b (0, 0, 0.5) positions, and oxygen atoms at 4e O1 (0, 0, z) and O2 at 8 h (x, y, 0). The refined results are shown in the Table 1. With increasing Na-content (y), C1–C5 show a comparable ASD content of approximately 14%, but a gradual rising ASD can be observed in C2–C6. This is consistent with the indications by the Fig. 1. The cell parameters of both C1–C5 and C2–C6 decrease slightly due to smaller ionic sizes of Na/Mo than Sr/Fe cations, manifesting the actual occurrence of the designed elements substitutions.
| Sample I | C1 (y = 0.1) | C3 (y = 0.2) | C5 (y = 0.3) |
| a = b/c (Å) | 5.5652(0)/7.8952(7) | 5.5538(6)/ 7.8973(3) | 5.5536(1)/7.8801(8) |
| Cell volume (Å3) | 244.528 | 243.596 | 243.042 |
| ASD% | 14.(8) | 13.(9) | 14.(4) |
| Rw/Rp | 10.46/6.35 | 10.51/6.57 | 10.28/6.30 |
| Sample II | C2 (y = 0.1 = 2x) | C4 (y = 0.2 = 2x) | C6 (y = 0.3 = 2x) |
| a = b/c (Å) | 5.5651(4)/7.8949(9) | 5.5516(3)/7.8978(5) | 5.5508(3)/7.8709(7) |
| Cell volume (Å3) | 244.514 | 243.412 | 242.513 |
| ASD% | 15.(3) | 18.(3) | 25.(3) |
| Rw/Rp | 10.46/6.72 | 10.32/6.62 | 10.31/6.38 |
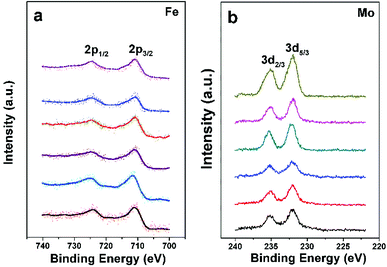
The chemical states of Fe and Mo cations in SFMO are closely related to magnetic behaviors and other physical properties. Thus the chemical states of Fe and Mo cations are confirmed by the XPS as shown in Fig. 3(a) and (b), respectively. From Fig. 3(a), one can see clearly that Fe2p3/2 and Fe2p1/2 of C1–C6 compositions are located at ca.710.5 eV and 724.5 eV, with a spin-energy separation of 14 eV, which indicates the Fe cations in C1–C6 mainly are 3+.38,39 The double peaks contributed by the Mo3d5/3 and Mo3d2/3 caused by spin–orbit coupling can be observed in Fig. 3(b). Except for that, there are no other shoulder peaks, which is different from the XPS data in SFMO systems in the literatures.38,40 The location at binding energy of Mo3d5/3 and Mo3d2/3 peaks shows a weak shift, within the range of 232.2–231.5 eV and 234.8–235.4 eV. Actually, all those Mo-3d XPS experimental data are in accordance with the reports, it demonstrates that the chemical state of the Mo cations of C1–C6 mainly is 5+ valences.17,40,41 The XPS results demonstrate that both Na-doped content (y) and excess-Mo (x) content play a negligible role of the chemical states of Fe and Mo cations.
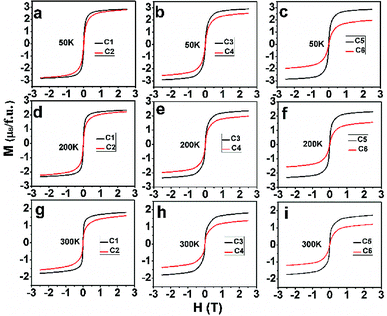
After confirm the chemical states of Fe and Mo cations, it is more reasonable to discuss magnetic behavior of C1–C6. M–H curves of C1–C6 measured at 50 K, 200 K and 300 K are plotted in Fig. 4(a)–(c), (d)–(f) and (g)–(i), respectively. All the M–H curves present well-saturated magnetic hysteresis loops with a very small magnetic coercivity, indicating a soft ferromagnetic feature.3,42,43 The macroscopic ferromagnetic natures of six compositions have a negligent relation with the Na-doped content (y) and excess Mo content (x = 0.5y). In order to deeply investigate the influence of Na-doped content (y) on the magnetization, Ms versus Na-doped content (y) at 50 K, 200 K and 300 K are shown in Fig. 5(a)–(c). From Fig. 5(a), mainly two aspects of Ms with y can be addressed. First, C1, C3 and C5 have comparable Ms values of 2.83, 2.9 and 2.86μB/f.u., respectively. This observation indicates that Na-doped content (y) have not an obvious function on the Ms values. Second, as for a certain y value, the Ms values of C2, C4 and C6 ceramics are less than that of the C1, C3 and C5, and Ms values of C2–C6 gradually decrease further with increasing y. This experimental result shows that introducing excess Mo into Na-doped SFMO has a negative contribution to the Ms. However, the fundamentally causes for the observations are unclear, and it is necessary to originally discuss the possible reasons.
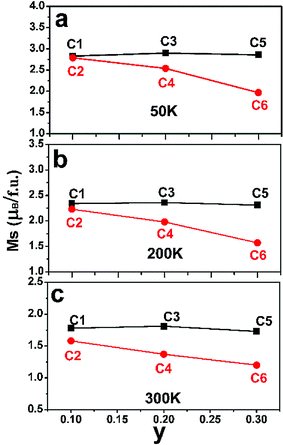 | ||
| Fig. 5 The Na-content (y) dependent saturated magnetization (Ms) values of C1–C6 at 50 K (a); 200 K (b) and 300 K (c). | ||
Based on previous studies, mainly two alternative explanations are proposed for the magnetization in FeMo-based double perovskites. One is Fe/Mo ASD effect originated from the wrong occupation of Fe sites with the Mo cation or vice versa. Once Fe/Mo ASD occurs, giving rise to antiferromagnetic –Fe–O–Fe–O– patches and paramagnetic –Mo–O–Mo–O– patches between ordering ferromagnetic domains. Actually, a great deal of experimental results confirmed that both patches can greatly weaken the magnetization in FeMo-based double perovskites;10–13 in the other explanation, itinerant electron density n at the conduction band is presumed to has a negative correlation with the magnetization.29 Because localized electrons of Fe3+ (3d5, S = 5/2) antiferromagnetically couple with the itinerant electron of Mo5+ (4d1, S = 1/2), resulting in an ideal Ms of 4μB/f.u. If itinerant electron density n is less than 1, the Ms will be more than 4μB/f.u., otherwise less than 4μB/f.u. According to the second explanation, the itinerant electron density n of C1–C6 are estimated and shown in Table 2. Herein, supposing 100% Fe/Mo ordering degree in C1–C6, the perfect saturated magnetization (Ms (I)) values are calculated for C1–C6 through a magnetic double-exchange-like mechanism.
| Sample I | C1 (y = 0.1) | C3 (y = 0.2) | C5 (y = 0.3) |
| n = 1 − y | 0.9 | 0.8 | 0.7 |
| Ms (I) (μB/f.u.) | 4.1 | 4.2 | 4.3 |
| Sample II | C2 (y = 0.1 = 2x) | C4 (y = 0.2 = 2x) | C6 (y = 0.3 = 2x) |
| n = 1 + 0.5y | 1.05 | 1.1 | 1.15 |
| Ms (I) (μB/f.u.) | 3.95 | 3.9 | 3.85 |
The variance of Fe/Mo ASD (Fig. 1, Table 1) and n (Table 2) have been investigated. Then, the functions of them on magnetization are estimated by combing experimental Ms data as shown in Fig. 5. Supposing the Ms were mainly controlled by the itinerant electron density n, then a gradual increased Ms will be observed from C1 to C5 since a comparable ASD content of C1–C5. However, the measured Ms in Fig. 5 of C1–C5 show equivalent Ms values. It indicates that the Fe/Mo ASD content, not n control the Ms behavior dominantly. Introducing excess Mo into Na-doped SFMO leads to an improved n, thus a decreased Ms (I) (Table 2). Although varied trend of the Ms of C2–C6 is consistent with both Ms (I) (Table 2) and Fe/Mo ordering degree (Fig. 1, Table 1), the amplitude of variation of Ms (I) (Table 2) is much less than the experimental Ms in Fig. 5(a) and the Ms (I) values are greater than the experimental Ms. For example, Ms (I) of C6 is 3.85μB/f.u.(Table 2), which is almost two times that of the experimental Ms (1.97μB/f.u.) in Fig. 5(a). This indicates that n doesn't have a sufficient capability to affect the magnetization behavior in SFMO. On the other words, the significant discrepancy between Ms (I) and Ms is because of the negative effect of ASD on the magnetization. Actually, our experimental observations reveal mainly contribution of Fe/Mo ASD to the magnetization, which are in accordance with the experimental results reported in literatures.13,14,44
In order to investigate the effect of n on TC of C1–C6, field-cooling (200 Oe) magnetization as a dependence of temperature (M–T) curves of C1–C6 are present in Fig. 6. With increasing temperature, the M–T curves show an abrupt decrease, implying a transition from ferromagnetic to paramagnetic state.3,14,18,21 The corresponding ferromagnetic TC can be established from the inflection point of M–T curves.
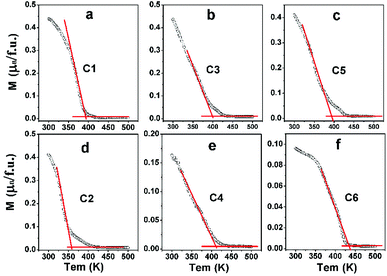 | ||
| Fig. 6 Magnetization-temperature (M–T) curves measured at 200 Oe of C1 (a); C3 (b); C5 (c); C2 (d); C4 (e) and C6 (f). | ||
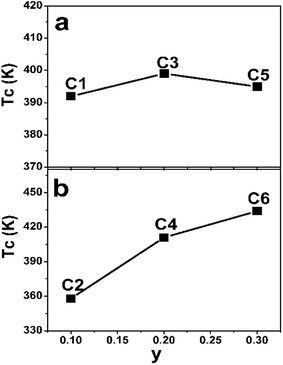
The TC values of C1–C6 are present in Fig. 7. As discussed in the introduction, a considerable high TC of SFMO origins from the strong magnetic interactions via a double-exchange-like mechanism. Ferromagnetic coupling strengthen is proposed to be mediated by n. Actually, TC indeed can be significantly improved by electron doped FeMo-based double perovskites,16,18–22,45,46 and it is noted that the theoretical n of such subjects investigated are greater than 1. And TC values have a monotonously positive correlation with n due to the electron band filling effect. However, TC of Na-doped C1–C5 shows a nonmonotonic variation, but an overall improvement with the Na-content (y) (Fig. 7(a)). It indicates that TC of Na-doped SFMO (C1–C5) don't decrease but improve with decreasing theoretical n, presenting a reverse tendency with that of electron-doped FeMo-based double perovskites. Similar observations are found in (La1−xCax)MnO3 and Na-doped SFMO literatures.29,30,47 Moreover, it seems that TC of Na-doped SFMO likely to increase when approximately n ≤ 0.9.30 The composition dependent TC can be explained based on the ratio variation of n(Mo)/n(Fe), where, n express the density of states.47 TC may has a positive relation with n(Mo) but a negative relation with n(Fe). Possibly, when n ≤ 0.9, n(Mo) decrease much more slowly than the n(Fe), resulting in a larger n(Mo) than n(Fe). Hence, C3 and C5 show improved TC though a decrease of the total n near the Fermi level. Actually, further theoretical calculation works will be conducted to confirm the speculation. As for C2–C6 (Fig. 7(b)), it is interesting to find that TC dramatically improves with increasing Na (Mo) content in spite of the increased Fe/Mo ASD concentration (Fig. 1, Table 1). TC of C6 reaches to 434 K, showing a substantial improvement of 76 K compared with C2 (358 K). Although a small local region of ferromagnetic coupling strength will decrease caused by introducing a small amount of Mo, accompanying increased n will enhance the ferromagnetic interaction strength of the most of the normal Fe/Mo crystal lattices. Therefore, a macroscopic ferromagnetic coupling strength will be improved, manifesting by a significantly increased TC value as shown in Fig. 7(b). It also indicates that TC invariably relates with the total n positively when theoretical n is more than 1. The efficient optimized TC strategies have been also proposed in the electron doped FeMo-based perovskites.16,18,21,46
IV. Conclusions
We have prepared single-phased Sr(2−y)NayFeMoO6 (y = 0.1, 0.2, 0.3) and Sr(2−y)NayFe(1−x)Mo(1+x)O6 (y = 2x; y = 0.1, 0.2, 0.3) ceramics to artificially control n of them to be n = 1 − y and n = 1 − y + 3x = 1 + 0.5y, respectively. We have systematically investigated the corresponding crystal structure, magnetization and the ferromagnetic TC of two objectives. The main results can be concluded as follows: The XRD analysis indicates that n has a negligent effect on Fe/Mo ASD content of Sr(2−y)NayFeMoO6 (y = 0.1, 0.2, 0.3). However, a drastic improved Fe/Mo ASD can be observed in Sr(2−y)NayFe(1−x)Mo(1+x)O6 (y = 2x; y = 0.1, 0.2, 0.3) due to the intrinsic wrong occupation of normal Fe site with Mo cation. All the M–H behavior confirms that it is the Fe/Mo ASD not n dominantly determines the magnetization property. Interestingly, approximately when n ≤ 0.9, TC of Sr(2−y)NayFeMoO6 (y = 0.1, 0.2, 0.3) increase on the whole with decreasing n, which is contrary to the TC response in electron-doped SFMO. Such abnormal TC possibly relates with the ratio variation of n(Mo)/n(Fe). Moreover, when n≥ 1, TC of Sr(2−y)NayFe(1−x)Mo(1+x)O6 (y = 2x; y = 0.3) exhibits a significant rise of about 75 K over that of Sr(2−y)NayFe(1−x)Mo(1+x)O6 (y = 2x; y = 0.1), resulting from improved n caused by introducing excess Mo into Sr(2−y)NayFeMoO6. Maybe, our work can provide an effective strategy to artificially control n and ferromagnetic TC accordingly, and provoke further investigation on the FeMo-based double perovskites.Conflicts of interest
There are no conflicts to declare.Acknowledgements
This work was supported by funds from the Natural Science Foundation of China (U1504107) and the Doctoral Scientific Research Foundation (qd15214).References
- K. I. Kobayashi, T. Kimura, H. Sawada, K. Terakura and Y. Tokura, Nature, 1998, 395, 677 CrossRef.
- W. E. Pickett and J. S. Moodera, Phys. Today, 2001, 54, 39 CrossRef.
- D. Serrate, J. De Teresa and M. Ibarra, J. Phys.: Condens. Matter, 2007, 19, 023201 CrossRef.
- J. F. Wang, J. Zhang, B. Hu, Z. B. Gu and S. T. Zhang, J. Phys. D: Appl. Phys., 2014, 47, 445003 CrossRef.
- J. F. Wang, B. Hu, J. Zhang, Z. B. Gu and S. T. Zhang, J. Alloys Compd., 2015, 621, 131 CrossRef.
- S. Vasala and M. Karppinen, Prog. Solid State Chem., 2015, 43, 1 CrossRef.
- I. Hussain, M. S. Anwar, J. W. Kim, K. C. Chung and B. H. Koo, Ceram. Int., 2016, 42, 13098 CrossRef.
- Z. Du, H. Zhao, S. Li, Y. Zhang, X. Chang, Q. Xia, N. Chen, L. Gu, K. Swierczek, Y. Li, T. Yang and K. An, Adv. Energy Mater., 2018, 8, 1800062 CrossRef.
- J. Navarro, J. Fontcuberta, M. Izquierdo, J. Avila and M. C. Asensio, Phys. Rev. B, 2004, 70, 054423 CrossRef.
- S. Ray, A. Kumar, D. D. Sarma, R. Cimino, S. Turchini, S. Zennaro and N. Zema, Phys. Rev. Lett., 2001, 87, 097204 CrossRef PubMed.
- L. L. Balcells, J. Navarro, M. Bibes, A. Roig, B. Martínez and J. Fontcuberta, Appl. Phys. Lett., 2001, 78, 781 CrossRef.
- Y. H. Huang, J. Linden, H. Yamauchi and M. Karppinen, Chem. Mater., 2004, 16, 4337 CrossRef.
- J.-F. Wang, X.-J. Xu, W.-J. Ji, S.-T. Zhang, J. Zhou, Z.-B. Gu, Y. Chen, G.-L. Yuan, S.-H. Yao and Y.-F. Chen, CrystEngComm, 2013, 15, 4601 RSC.
- J.-F. Wang, Z.-T. Zhuang, T.-F. Shi, Q.-Q. Gao and Z.-J. Jia, Ceram. Int., 2018, 44, 8492 CrossRef.
- O. N. Meetei, O. Erten, A. Mukherjee, M. Randeria, N. Trivedi and P. Woodward, Phys. Rev. B: Condens. Matter Mater. Phys., 2013, 87, 165104 CrossRef.
- E. K. Hemery, G. V. M. Williams and H. J. Trodahl, Phys. Rev. B: Condens. Matter Mater. Phys., 2006, 74, 054423 CrossRef.
- P. Kumar, N. K. Singh, G. Gupta and P. Singh, RSC Adv., 2016, 6, 22094 RSC.
- J. Navarro, C. Frontera, L. Balcells, B. Martínez and J. Fontcuberta, Phys. Rev. B: Condens. Matter Mater. Phys., 2001, 64, 092411 CrossRef.
- C. Frontera, D. Rubi, J. Navarro, J. L. García-Muñoz, J. Fontcuberta and C. Ritter, Phys. Rev. B: Condens. Matter Mater. Phys., 2003, 68, 012412 CrossRef.
- D. Rubi, J. Appl. Phys., 2004, 95, 7082 CrossRef.
- D. Rubi, C. Frontera, J. Fontcuberta, M. Wojcik, E. Jedryka and C. Ritter, Phys. Rev. B: Condens. Matter Mater. Phys., 2004, 70, 094405 CrossRef.
- A. K. Azad, S. G. Eriksson, A. Khan, A. Eriksson and M. Tseggai, J. Solid State Chem., 2006, 179, 1303 CrossRef.
- T. Saitoh, M. Nakatake, H. Nakajima, O. Morimoto, A. Kakizaki, S. Xu, Y. Moritomo, N. Hamada and Y. Aiura, Phys. Rev. B: Condens. Matter Mater. Phys., 2005, 72, 045107 CrossRef.
- Q. Zhang, G. Y. Liu, Z. F. Xu, X. M. Feng and G. H. Rao, Phys. B, 2010, 405, 1428 CrossRef.
- D. Rubi and J. Fontcuberta, J. Phys.: Condens. Matter, 2006, 18, 7991 CrossRef.
- J. Wang, X. Song, Y. Li and Z. Zhuang, Ceram. Int., 2017, 43, 5585 CrossRef.
- J. Kim, J. G. Sung, H. M. Yang and B. W. Lee, J. Magn. Magn. Mater., 2005, 290, 1009 CrossRef.
- G. Kim, S. S. Lee, S. C. Wi, J. S. Kang, S. W. Han, J. Y. Kim, B. W. Lee, J. Y. Kim, H. J. Shin and B. G. Parr, J. Appl. Phys., 2006, 99, 677 CrossRef.
- Q. Zhang, G. H. Rao, Y. G. Xiao, G. Y. Liu, Y. Zhang and J. K. Liang, Appl. Phys. A, 2006, 84, 459 CrossRef.
- J. F. Wang, J. F. Wang, Y. M. Zhang and Y. M. Zhang, RSC Adv., 2017, 7, 26185 RSC.
- K. Yoshida, Y. Fujii and H. Shimizu, J. Appl. Phys., 2005, 98, 103901 CrossRef.
- D. Sanchez, J. A. Alonso, M. Garcia-Hernandea, M. J. Martinez-Lope and M. T. Casais, J. Phys.: Condens. Matter, 2005, 3673 CrossRef.
- M. Iranmanesh, M. Lingg, M. Stir and J. Hulliger, RSC Adv., 2016, 6, 42069 RSC.
- J. F. Wang and Y. M. Zhang, Mater. Res. Bull., 2017, 90, 145 CrossRef.
- J. F. Wang, Y. M. Zhang, C. Jie and M. Xu, J. Phys. D: Appl. Phys., 2017, 50, 305001 CrossRef.
- D. Yang, R. J. Harrison, J. A. Schiemer, G. I. Lampronti, X. Liu, F. Zhang, H. Ding, Y. g. Liu and M. A. Carpenter, Phys. Rev. B: Condens. Matter Mater. Phys., 2016, 93, 024101 CrossRef.
- A. M. Reyes, Y. Arredondo and O. Navarro, J. Phys. Chem. C, 2016, 120, 4048 CrossRef.
- W. Ji, J. F. Wang, J. Xu, L. Jiao, J. Zhou, Y. B. Chen, Z. B. Gu, S. H. Yao, S. T. Zhang and Y. F. Chen, J. Phys. D: Appl. Phys., 2013, 46, 015001 CrossRef.
- M. Retuerto, F. Jiménezvillacorta, M. J. Martínezlope, Y. Huttel, E. Roman, M. T. Fernándezdíaz and J. A. Alonso, Phys. Chem. Chem. Phys., 2010, 12, 13616 RSC.
- L. V. Kovalev, M. V. Yarmolich, M. L. Petrova, J. Ustarroz, H. A. Terryn, N. A. Kalanda and M. L. Zheludkevich, ACS Appl. Mater. Interfaces, 2014, 6, 19201 CrossRef PubMed.
- H. Jalili, N. F. Heinig and K. T. Leung, Phys. Rev. B: Condens. Matter Mater. Phys., 2009, 79, 174427 CrossRef.
- D. D. Sarma, S. Ray, K. Tanaka, M. Kobayashi, A. Fujimori, P. Sanyal, H. Krishnamurthy and C. Dasgupta, Phys. Rev. Lett., 2007, 98, 157205 CrossRef PubMed.
- P. Anil Kumar and D. D. Sarma, Appl. Phys. Lett., 2012, 100, 2472 CrossRef.
- R. P. Panguluri, S. Xu, Y. Moritomo, I. V. Solovyev and B. Nadgorny, Appl. Phys. Lett., 2009, 94, 012501 CrossRef.
- M. Wojcik, E. Jedryka, S. Nadolski, D. Rubi, C. Frontera, J. Fontcuberta, B. Jurca, N. Dragoe and P. Berthet, Phys. Rev. B, 2005, 71, 104410 CrossRef.
- Q. Zhang, Y. G. Xiao, Z. F. Xu, G. Y. Liu and J. B. Li, J. Solid State Chem., 2010, 183, 2432 CrossRef.
- S. W. Cheong and H. Y. Hwang, ChemInform, 2001, 32 DOI:10.1002/chin.200103237.
| This journal is © The Royal Society of Chemistry 2018 |

