 Open Access Article
Investigation of a commercial lithium-ion battery under overcharge/over-discharge failure conditions
Dongxu Ouyanga,
Mingyi Chen b,
Jiahao Liuc,
Ruichao Weia,
Jingwen Wengd and
Jian Wang
 *a
*a
aState Key Laboratory of Fire Science, University of Science and Technology of China, Hefei, 230022, China
bSchool of Environment and Safety Engineering, Jiangsu University, Zhenjiang, 212013, China
cCollege of Ocean Science and Engineering, Shanghai Maritime University, Shanghai, 201306, China
dSchool of Environment and Resources, Fuzhou University, Fuzhou, 350116, China
First published on 27th September 2018
Abstract
A lithium-ion battery (LIB) may experience overcharge or over-discharge when it is used in a battery pack because of capacity variation of different batteries in the pack and the difficulty of maintaining identical state of charge (SOC) of every single battery. A series of experiments were established to investigate the thermal and fire characteristics of a commercial LIB under overcharge/over-discharge failure conditions. According to the results, it is clear that the batteries experienced a clear temperature rise in the overcharge/over-discharge process. The temperature rise worsened and required less time when the battery was overcharged/over-discharged to failure with the increasing charge/discharge rate. Besides, the closer the position to the opening of the battery, the higher the surface temperature. It was demonstrated that LIBs can fail when overcharged/over-discharged to a critical degree regardless of the charge/discharge rate. Under different rates, the final capacities were around a critical value. Finally, there existed an explosion phenomenon in the external heating test of battery failure after overcharge, whereas the fire behaviors of the over-discharged battery were much more moderate.
1. Introduction
Lithium-ion batteries as one of the most promising power sources have been widely used for both portable electronics (i.e., telephones, flashlights, laptops, etc.) and transportation (i.e., electronic vehicles and hybrid electronic vehicles) due to their advantages such as high energy density, reduced pollution, stable performance and long-life cycle. However, one of the major problems is the safety issue, especially the failures of LIBs induced by extreme conditions such as external forces, high temperatures, low temperatures, overcharge and over-discharge.1–5 An LIB may experience overcharge or over-discharge when it is used in a battery pack because of the capacity variation of different batteries in the pack and the difficulty in maintaining identical SOC of every single battery. The battery in the pack will inevitably experience overcharge or over-discharge to a certain degree. Hence, the importance of investigating the overcharge or over-discharge of LIBs cannot be emphasized enough.So far, considerable studies have been done to examine the influence of overcharge/over-discharge on LIBs including electrochemical performances and aging characteristics.6–15 Yuan et al.6 investigated the safety behaviors of a 32 A h prismatic LIB under abusive charge conditions by monitoring the internal and external cell temperature variations, and the results showed that the internal resistance of the overcharged battery became 5–7 times than that of the 100% SOC battery. Xu et al.7 systematically studied the failure mechanism of LiFePO4 LIBs during overcharge conditions from 5–20% overcharge. The failure mechanism they proposed was that iron was oxidized to Fe cations on the cathode side during overcharge and then, it was reduced on both the cathode (during discharge) and the anode (during charge) to form Fe dendrites. Liu et al.8 carried out electrochemical impedance spectroscopy (EIS) studies on commercial 18650 LIBs at different SOCs to investigate failure in over-discharge conditions. They found that the impedance of the anode was much smaller than that of the cathode, but it dominated the impedance increase when the cell was over-discharged, which indicated that the SEI (solid electrolyte interface) change on the anode surface was much larger than that on the cathode. Besides, to investigate the degradation of an LiFePO4/graphite battery under an over-discharge process and its effect on further cycling stability, Zheng et al.12 conducted a set of experiments. Their results revealed that batteries over-discharged to 0.5–0.0 V experienced serious irreversible capacity losses of 12.56–24.88%, i.e., a serious loss of active lithium and anode materials occurred during the over-discharge process. Zhang et al.14 analyzed the capacity fading mechanism during long-term cycling of over-discharged batteries by electrochemical and physical characterizations. They declared that the capacity deterioration of over-discharged batteries was mainly caused by the dissolution of the copper current collector and the deposition of Cu on the surface of the anode. Additionally, many scholars performed experiments to probe the thermal failure behaviors of overcharged/over-discharged LIBs under high-temperature conditions.16–20 Larsson et al.16 carried out different types of abuse testings to compare the battery safety for different types of commercial LIBs. The results demonstrated that overcharge could result in violent combustion of the battery similar to that observed for other abuses such as external heating and short-circuiting. Ouyang et al.17 investigated the fire hazards of two commonly used LIBs under overcharge conditions and compared the fire behavior differences between them by analyzing the burning phenomenon, surface temperature, flame temperature, voltage and radiative heat flux. Furthermore, Golubkov et al.18 investigated the thermal runaway characteristics of two types of 18650 LIBs preconditioned to SOC in the range of 0–143%, and they found that LIBs went into thermal runaway when they were heated above a critical temperature.
Nevertheless, limited research has been done to investigate the characteristics of LIB under overcharge/over-discharge failure conditions, and the temperature variation of batteries during the process has not been explored. The effect of the charge/discharge rate on the process has not been of concern. In addition, the fire hazards of batteries failing due to overcharge/over-discharge still lack examination; also, limited studies have been reported concerning the fire hazard difference between a failed battery and a normal battery. In this paper, we report an experimental study to investigate the thermal and fire characteristics of a commercial LIB under overcharge/over-discharge failure conditions. Specific information including voltage, current, capacity and battery surface temperature is measured; the micro-characterization of electrode materials stripped from normal and failed batteries owing to overcharge/over-discharge was analyzed. Finally, external heating experiments of failed batteries were also performed.
2. Experiment
2.1 Materials
The battery samples used in this study were cylindrical SAMSUNG 18650 batteries with a diameter of 18 mm, height of 65 mm and capacity of 1300 mA h. The cathode and anode consisted of Li(Ni0.5Mn0.3Co0.2)O2 and graphite, respectively. Moreover, 1.0 mol cm−3 LiPF6 dissolved in EC![[thin space (1/6-em)]](https://www.rsc.org/images/entities/char_2009.gif) :
:![[thin space (1/6-em)]](https://www.rsc.org/images/entities/char_2009.gif) DEC
DEC![[thin space (1/6-em)]](https://www.rsc.org/images/entities/char_2009.gif) :
:![[thin space (1/6-em)]](https://www.rsc.org/images/entities/char_2009.gif) EMC (1
EMC (1![[thin space (1/6-em)]](https://www.rsc.org/images/entities/char_2009.gif) :
:![[thin space (1/6-em)]](https://www.rsc.org/images/entities/char_2009.gif) 1
1![[thin space (1/6-em)]](https://www.rsc.org/images/entities/char_2009.gif) :
:![[thin space (1/6-em)]](https://www.rsc.org/images/entities/char_2009.gif) 1) was used as the electrolyte. Besides, its cut-off voltage for charging was 4.2 V and that for discharging was 2.5 V. Three major components including safety valve, jellyroll and shell casing constituted the batteries.
1) was used as the electrolyte. Besides, its cut-off voltage for charging was 4.2 V and that for discharging was 2.5 V. Three major components including safety valve, jellyroll and shell casing constituted the batteries.
2.2 Apparatuses and experimental design
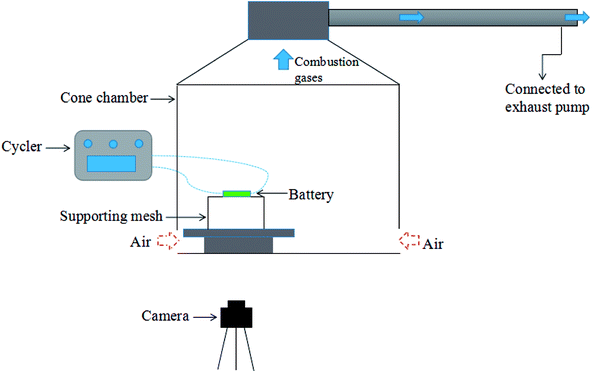
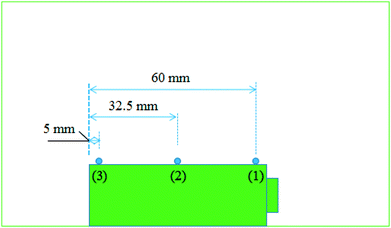
As shown in Fig. 1, experiments were carried out in a well-ventilated cone chamber with dimensions of 1.2 m × 1.2 m × 1.2 m. Batteries were placed upon a supporting mesh made of iron wire in the tests. Three K-type thermocouples with a diameter of 1 mm were attached to each battery to measure its surface temperature, and the temperature was recorded with the data acquisition equipment (NI cDAQ-9174) by a computer. The detailed arrangements of the thermocouples are presented in Fig. 2. The temperatures obtained by the thermocouple numbered (1), (2) and (3) were marked as T1, T2 and T3, respectively. Charging/discharging the battery was achieved using cycle equipment (NEWARE CT-3008) with a parameter of 5 V/6 A. Moreover, an electric heater with 2 kW power was used in the external heating tests, and a camera (SONY XPS160) with 25 fps was employed to record the tests.Two groups of experiments consisting of 4 charge/discharge rates were carried out to explore the variations including voltage, current, capacity and surface temperature of LIBs during overcharge/over-discharge failure. Before the tests, each battery was discharged at 2C rate to the cut-off voltage (2.5 V); then, it was placed still for 24 hours to ensure that it remained stable before testing. The experimental configurations are further listed in Table 1.
| LIB type | Group no. | Test no. | Treatment | Rate (C) |
|---|---|---|---|---|
| NMC | 1 | 1 | Overcharge | 1 |
| 2 | 2 | |||
| 3 | 3 | |||
| 4 | 4 | |||
| 2 | 1 | Over-discharge | 1 | |
| 2 | 2 | |||
| 3 | 3 | |||
| 4 | 4 | |||
| 4 | 4 |
3. Results and discussion
3.1 Overview of the overcharge/over-discharge mechanism
Commonly, the mechanism of overcharge for batteries consists of three stagesStage (a): During the normal charge phase and even the slight overcharge phase, lithium ions were extracted from the cathode crystal and transferred to the graphite anode through electrolytes under the effect of the potential difference between electrodes. There was no clear side reaction inside the battery, and the battery remained stable due to the excess capacity of electrode materials at this stage.
Stage (b): When the battery was severely overcharged and the cathode potential increased, the metal on the cathode was oxidized from its metallic form to the metallic ion. Then, some of the metallic ions diffused to the anode driven by the concentration difference between the cathode and anode. Meanwhile, the metallic lithium started to deposit onto the anode surface after the anode was full of intercalated lithium. This thickened the SEI layer, resulting in increase in the internal resistance.
Stage (c): With the continuous deposition of lithium ions onto the surface of the anode, lithium plating appeared. Meanwhile, the metallic ions transferred from the cathode to the anode as described above were reduced to their metallic form causing the conformation of metallic dendrites. Hereafter, an internal short circuit occurred inside the battery, followed by the reactions between the cathode and anode materials, cathode decomposition, electrolyte decomposition, etc. Once the inner pressure exceeded the threshold, the battery failed.
On the other hand, the mechanism of the over-discharge process can also be divided into three stages
Stage (a): During the initial phase of discharge and even the slight over-discharge phase, a voltage applied across the electrodes forced the lithium ions to be extracted from the anode and transferred to the cathode through electrolytes. These lithium ions intercalated into the cathode crystal. There was no clear side reaction inside the battery.
Stage (b): When the battery was severely over-discharged and the anode potential increased, the copper foil as a current collector on the anode was oxidized to Cu+ and continued to be oxidized to Cu2+. Then, some of the Cu2+ ions diffused to the cathode side driven by the concentration difference between the cathode and anode. Besides, with the excessive loss of lithium ions in the anode, the SEI layer decomposed. Meanwhile, the metallic lithium deposited onto the cathode surface.
Stage (c): With the continuous deposition of lithium on the surface of the cathode, lithium plating appeared. The Cu2+ ions transferred to the cathode as described above reduced to Cu+ ions and Cu metal to form metallic dendrites. The dendrites grew continuously and eventually, the separator was penetrated to cause internal short circuit.
3.2 Overcharge process
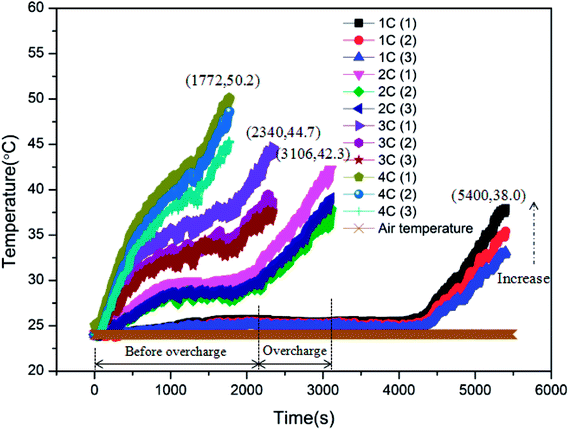
As displayed in Table 1, the overcharge treatment for LIB was carried out at CC (constant current) of 1C, 2C, 3C and 4C, respectively. Before experiments, the batteries were discharged to 2.5 V, namely, 0% SOC. The battery surface temperature curves during the process of LIBs overcharged to failure are shown in Fig. 3. After comparison, it can be seen that the peak temperatures of the batteries corresponding to these four charging rates were 38.0, 42.3, 44.7 and 50.2 °C, respectively. Clearly, with the increase in charging rate, the LIB exhibited more serious temperature rise, and less time was required for the battery to experience failure. On the other hand, it is shown that the temperature curve can be divided into two stages: before the overcharge stage and during the overcharge stage. Taking the 2C condition as an example, 1957 s were required to achieve 100% SOC and then, the overcharge stage lasted for about 1149 s. When the battery failed, there was a clear sound resulting from the safety valve opening to release pressure.Before overcharging, it can be found that the surface temperature increased rapidly at first and then, the rate of temperature rise declined gradually with the processing of charge. At 100% SOC, the temperature rise accelerated again. This variation was mainly induced by the change in internal resistance.21 As for the overcharge stage, it is shown that the surface temperature increased sharply, which was even severer than the initial charge stage. Thus is the result of the thick SEI layer and the internal short circuit inside the battery, which resulted in the increase in internal resistance and the deterioration of heat release. The rate of temperature rise remained stable until the peak temperature.
Finally, it is revealed that there existed a downtrend in T1, T2 and T3 for each battery. In other words, the closer the position to the opening of the battery, the higher the temperature during the overcharge process. This is because high-temperature gases generated inside the battery were released through the opening. Therefore, the positions closer to the opening exhibited higher temperatures.
Fig. 4 shows the typical curves of surface temperature, voltage and current versus capacity during the overcharge process for the battery charged at 2C rate. Based on the similar results exhibited by batteries under different charging rates, here, we take the 2C condition as an example. As described above, the surface temperature in the overcharge process could be divided into two main stages. In Fig. 4, it is shown that the ‘before overcharge’ stage could be further divided into three stages, namely, the initial temperature rise stage, the stable stage and the temperature rise stage near 100% SOC. In addition, it is revealed that the average temperature rising rate in the overcharge stage, i.e., 24.1 °C A−1 h−1 was much larger than that of the other stages. In other words, in the overcharge stage, the battery released much larger amounts of heat per unit capacity. At the end of overcharge, the current of battery sharply declined to 0 A, and the voltage decreased as well. Henceforth, the battery could not be cycled again, which indicated the failure of the battery.
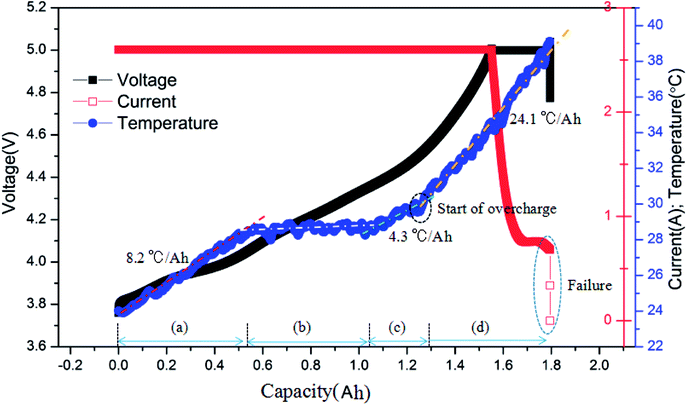 | ||
| Fig. 4 Typical curves of the surface temperature, voltage and current vs. capacity for the battery charged at the 2C rate. | ||
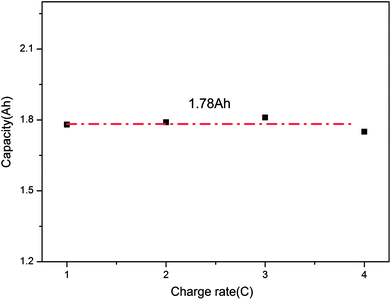
Finally, after comparing the final capacities of the batteries overcharged to failure, as shown in Fig. 5, it is found that the capacity was around 1.78 A h (137% SOC). This demonstrates that the charge rate does not have a considerable effect on the final capacity; instead, it mainly depends on the battery itself. When the battery was overcharged over a critical degree, battery failure occurred.
3.3 Over-discharge process
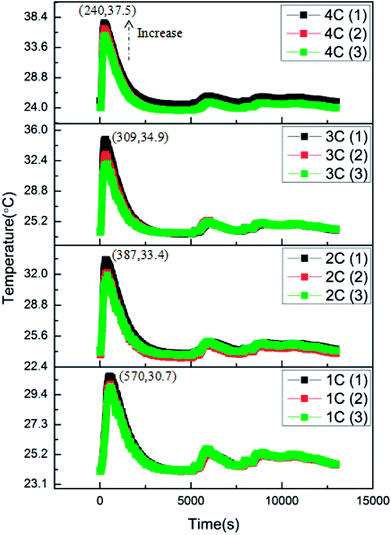
The over-discharge experiments of the batteries were conducted in a similar manner to the overcharge experiments at 1C, 2C, 3C and 4C. All the batteries had 0% SOC before experiments. Fig. 6 shows the variations of the battery surface temperatures during the over-discharge process. According to the results, it is clear that the over-discharge process consisted of two main stages: the initial over-discharge stage and the severe over-discharge stage. During the initial over-discharge stage, the battery surface temperature increased sharply and reached the peak temperature in a short time. Henceforth, the temperature declined gradually accompanied with several minor fluctuations.Similar to the results of the overcharge process, it can be found that the peak battery temperature during over-discharge increased with the increase in discharge rate. The larger the discharge rate, the severer the temperature rise. Additionally, it is revealed that the battery with a larger discharge rate reached peak temperature earlier. Combining these two parameters, the average temperature rising rates at this stage could be calculated as 0.012, 0.024, 0.035 and 0.056 °C s−1 corresponding to 1C, 2C, 3C and 4C conditions. The linear increase in the temperature rising rate demonstrated that the discharge rate had great influence on the initial over-discharge stage by worsening the heat generation. Besides, T3, T2 and T1 exhibited an increasing trend at the same moment, which revealed that the position closer to the opening of the battery was of a higher temperature. This affected the result of the overcharge process.
The typical curves of surface temperature, voltage and current versus capacity in the over-discharge process for the batteries discharged at 2C rate are displayed in Fig. 7. According to the curves, it is clear that the over-discharge process could be divided into three main stages. Stage (a) is the initial over-discharge stage as described above, where the temperature increases at a high rate of 413 °C A−1 h−1. Hereafter, the battery entered the severe over-discharge stage consisting of stages (b) and (c). Stage (b) is a CC discharge process, where the current remained constant, the voltage decreased quickly and the surface temperature declined gradually. During stage (c), CC discharging could not be continued because the battery had been greatly over-discharged; hence, the discharging rate started to decrease sharply. Meanwhile, the voltage decreased at a slower rate. At the end of over-discharge, the voltage and current were near 0.2 V and 0 mA, respectively. Temperature fluctuations appeared due to the corrosion of copper foil and the minor internal short circuit inside the battery.
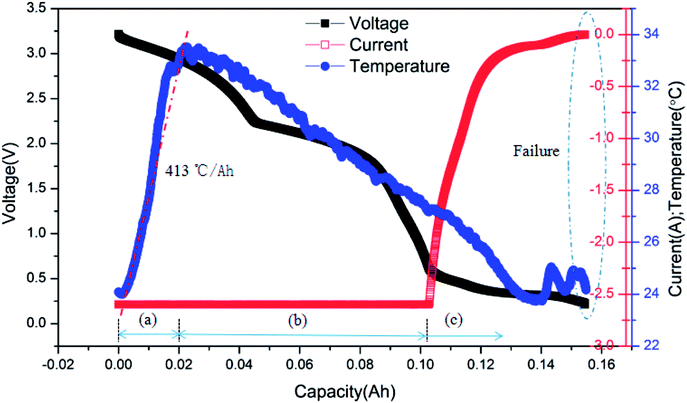 | ||
| Fig. 7 Typical curves of surface temperature, voltage and current vs. capacity for the battery discharged at 2C rate. | ||
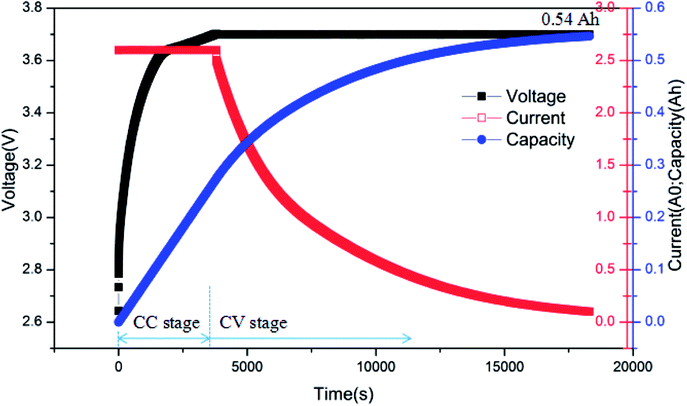
Fig. 8 presents the charging curves of battery after over-discharge, where the battery was charged by the CC-CV (constant current-constant voltage) method. The battery was charged at 2C rate first and then transferred to CV (3.7 V) until the current declined to 0.01C. From Fig. 10, it can be seen that the battery had a capacity of barely 0.54 A h when the charging was completed. In other words, it only had 41.5% SOC, which was much less than 80% SOC, the failure threshold for LIB.22 Therefore, the battery failed after the over-discharge process.
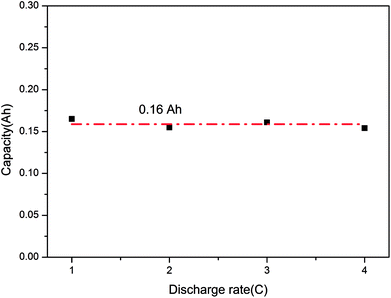
Furthermore, Fig. 9 displays the final capacities of the batteries after over-discharge. Similarly, they were close to each other and were around 0.16 A h, namely, 12.3% DOOD (degree of over-discharge). Also, the discharge rate did not influence the final capacity greatly and mainly relied on the battery, which indicated that the LIB could fail when it was over-discharged above a critical degree.
3.4 Fire behavior of failed LIB
Fig. 10 shows several typical moments during the burning process of LIB affected by a 2 kW power electric heater. The batteries were the ones experiencing failure induced by 2C overcharge/over-discharge. The batteries were placed upon the supporting mesh. The heater was under the batteries with a distance of 1 cm. According to the results, the burning process of the failed LIB consisted of a few stages, which will be discussed in detail: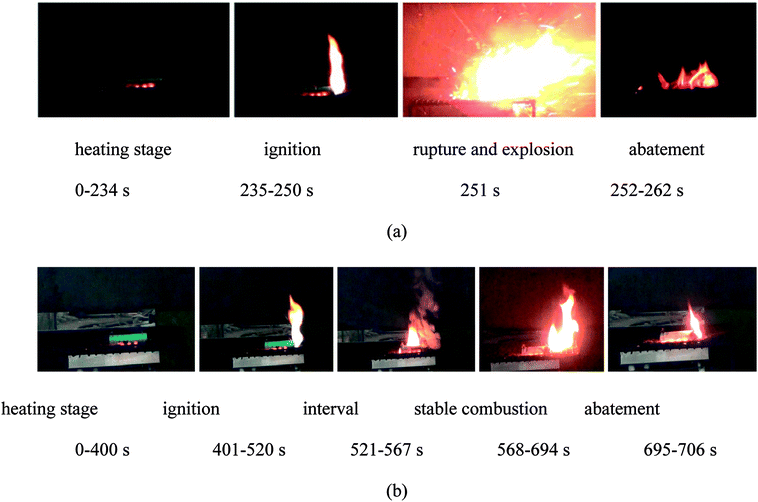 | ||
| Fig. 10 The burning process of the batteries during the tests: (a) battery failure due to overcharge; (b) battery failure due to over-discharge. | ||
The burning process of the failed battery due to overcharge comprised (1) the heating stage, (2) ignition, (3) rupture and explosion and (4) abatement. During the heating stage, the battery remained stable and only a part of the packing melted. With the continuous rise in temperature, the safety valve opened accompanied by a clear sound. Hereafter, some combustible gases were released, and these gases were ignited at 235 s. The flame lasted until the rupture and explosion behaviors at 251 s. When the explosion happened, the safety valve was blown away; the jellyroll was then brought out and exposed to air. This phenomenon was different from the results of the normal batteries reported in previous studies,23–26 where this stage was replaced by ejection and stable combustion. The explosion revealed that the fire behaviors of the failed battery due to overcharge were much more violent than those of normal batteries. On the one hand, this resulted from the redundant energy stored in the overcharged battery. Also, 137% SOC resulted in highly delithiated electroactive materials, which were unstable.27 The damaged structures inside the battery caused by overcharge might contribute to the result. Hence, the fire behaviors of the LIB worsened. The explosion was of a short duration and then, the flame abated gradually.
The burning process of the failed battery due to over-discharge consisted of (1) the heating stage, (2) ignition, (3) the interval, (4) stable combustion and (5) abatement. Compared to the fire behaviors of the LIB described above, much moderate fire behavior was observed for the failure of the LIB due to over-discharge, and more time was required for ignition; the battery did not ignite until 401 s. The flame lasted for a long time and then abated. Then, it entered an interval where large quantities of smoke were released. Some electrolytes leaked from the opening of the battery and then ignited. With the depletion of the electrolytes, it entered the stable combustion stage at 568 s where the flame remained still. Due to the continuous release of combustible gases, this stage lasted for a long time: 127 s. After that, the flame abated and extinguished in the end.
In Fig. 11, the photographs of LIBs after tests are displayed. From Fig. 11(a), it could be seen that the battery was damaged severely with the jellyroll exposed to air, whereas in Fig. 11(b), the white residuals of the electrolytes could be found on the battery surface.
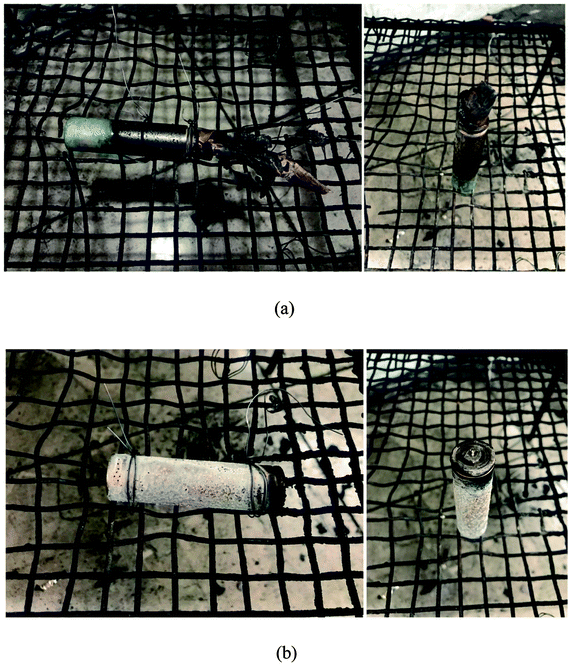 | ||
| Fig. 11 The photographs of LIBs after the tests: (a) the failed battery due to overcharge; (b) the failed battery due to over-discharge. | ||
3.5 The physical characterization of anode materials
To investigate the morphological changes in the battery components inside the battery after the overcharge/over-discharge process, the anode materials in the failed batteries and normal battery were examined using SEM (Scanning Electron Microscopy). Fig. 12 displays the SEM photos of the anode materials stripped from the failed battery due to overcharge and the normal battery and the failed battery due to over-discharge; all of them had 1k× magnification. In the anode part, a copper foil was used as the current collector and two graphite layers sandwiched the copper foil. As shown in Fig. 12(b), the surfaces of the graphite particles in the normal battery were smooth, possessing a similar size, and the arrangements were uniform. However, the surface of the graphite particles in the battery after overcharge became rough, and clear corrosion features could be seen. In Fig. 12(a), it can be found that many holes appeared in the surface and the graphite flakes corroded or melted, resulting in irregular edges. Clearly, the graphite layers of the battery after overcharge were seriously damaged owing to the excessive deposition of lithium ions on the anode. In addition, there existed many minor particles on the surface of graphite (Fig. 12(c)), suggesting that Cu dissolved from the copper foil in the failed battery after over-discharge and then transferred into the graphite layer. In other words, the copper foil was deeply corroded.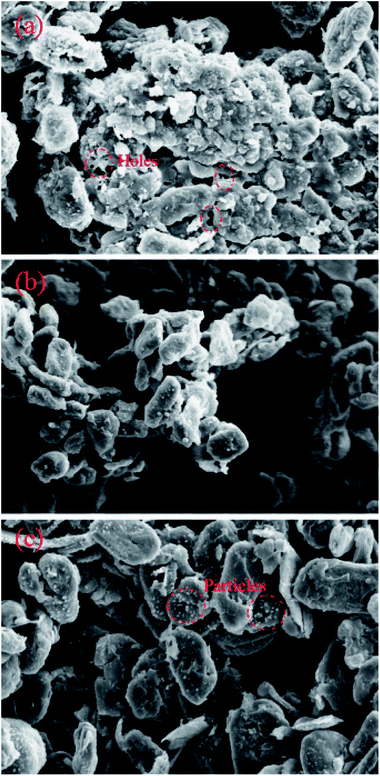 | ||
| Fig. 12 The physical characterization of graphite: (a) the battery after overcharge; (b) the normal battery; (c) the battery after over-discharge. | ||
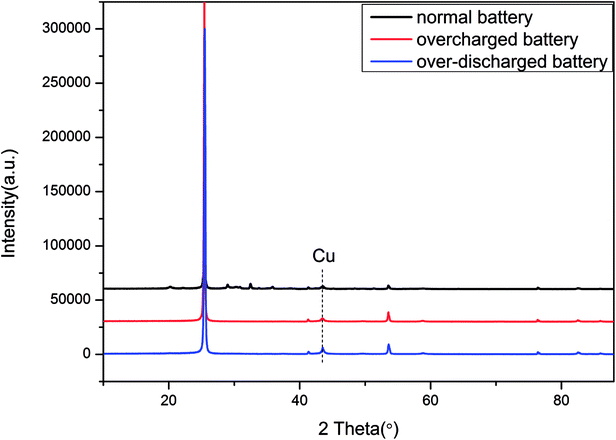
Besides, the XRD (X-ray Diffraction) results of the anode materials are depicted in Fig. 13. The emerging peak of Cu in the curve of the over-discharged battery supported the previous assumption that the copper foil dissolved and then deposited onto the electrode in the over-discharged battery. Furthermore, Table 2 displays the element distribution details for the anode materials by XPS (X-ray Photoelectron Spectroscopy). For a normal battery, its anode comprised C and Li, whereas Cu appeared in the over-discharged battery, and the content of Li declined clearly due to serious loss of lithium ions by over-discharge. As for the overcharged battery, the excessive deposition of lithium ions could be found in the anode; meanwhile, the metals Ni, Mn and Co transferred from the cathode and emerged in the anode. The results of SEM, XRD and XPS were identical to the description of the overcharge/over-discharge mechanism in Section 3.1, and some similar reports could be found in previous studies.7,9,10
| Battery | C | Li | Cu | Ni | Mn | Co |
|---|---|---|---|---|---|---|
| Normal battery | 94.33% | 5.67% | — | — | — | — |
| Overcharged battery | 90.90% | 8.45% | — | 0.33% | 0.19% | 0.13% |
| Over-discharged battery | 95.58% | 3.10% | 1.32% | — | — | — |
4. Conclusion
In this study, we conducted an experiment to investigate the thermal and fire characteristics of a commercial LIB under overcharge/over-discharge failure conditions. Specific information including voltage, current, capacity and battery surface temperature was measured; the micro-characterization of anode materials stripped from normal and failed batteries due to overcharge/over-discharge was also analyzed. Finally, external heating experiments of the failed batteries were performed to research the fire behaviors.According to the results, it is clear that the batteries experienced a clear temperature rise in the overcharge process. Besides, the temperature rise worsened, and it required less time when the battery was overcharged to failure with increasing charging rate. It was also found that during the overcharge process, the area closer to the opening of the battery was of a higher temperature. This resulted from the release of high-temperature gases generated inside the battery through the opening. Additionally, the final capacities of the batteries when overcharged to failure were around 1.78 A h, which demonstrated that the charge rate did not have significant effect on the final capacity and it mainly relied on the battery. Similarly, the same phenomenon also occurred in the over-discharge condition.
On the other hand, it can be seen that the fire behaviors of the failed battery due to overcharge were much more violent than those of the normal batteries, among which an explosion stage existed in the burning process. Compared to the fire behaviors of the overcharged LIB, much moderate fire behaviors were observed for the failed LIB due to over-discharge, and it took more time to be ignited. Therefore, the burning process of the over-discharged LIB lasted much longer.
Finally, according to the physical characterization of anode materials and the mechanism of overcharge, the failure of the battery after overcharge was mainly caused by the excessive deposition of lithium ions in the anode and the formation of an internal short circuit. In addition, the failure of the battery after over-discharge was the result of copper foil dissolution and the formation of Cu dendrites.
Conflicts of interest
There are no conflicts to declare.Acknowledgements
This work was supported by the National Key R&D Program of China (No. 2016YFC0802500) and the Open Foundation of the State Key Laboratory of Fire Science (No. HZ2016-KF13).References
- P. Biensan, B. Simon and J. P. Peres, et al., On safety of lithium-ion cells, J. Power Sources, 1999, 81, 906–912 CrossRef.
- P. Ribière, S. Grugeon, M. Morcrette, S. Boyanov, S. Laruelle and G. Marlair, Investigation on the fire-induced hazards of Li-ion battery cells by fire calorimetry, Energy Environ. Sci., 2012, 5(1), 5271–5280 RSC.
- D. H. Doughty and E. P. Roth, A general discussion of Li ion battery safety, Electrochem. Soc. Interface, 2012, 21(2), 37–44 CrossRef CAS.
- D. Belov and M. H. Yang, Failure mechanism of Li-ion battery at overcharge conditions, J. Solid State Electrochem., 2008, 12(7–8), 885–894 CrossRef CAS.
- H. Maleki and J. N. Howard, Effects of overdischarge on performance and thermal stability of a Li-ion cell, J. Power Sources, 2006, 160(2), 1395–1402 CrossRef CAS.
- Q. F. Yuan, F. Zhao and W. Wang, et al., Overcharge failure investigation of lithium-ion batteries, Electrochim. Acta, 2015, 178, 682–688 CrossRef CAS.
- F. Xu, H. He and Y. D. Liu, et al., Failure investigation of LiFePO4 cells under overcharge conditions, J. Electrochem. Soc., 2012, 159(5), A678–A687 CrossRef CAS.
- Y. Liu, Q. Liu and Z. Li, et al., Failure study of commercial LiFePO4 cells in over-discharge conditions using electrochemical impedance spectroscopy, J. Electrochem. Soc., 2014, 161(4), A620–A632 CrossRef CAS.
- R. Guo, L. Lu and M. Ouyang, et al., Mechanism of the entire overdischarge process and overdischarge-induced internal short circuit in lithium-ion batteries, Sci. Rep., 2016, 6, 30248 CrossRef CAS PubMed.
- H. He, Y. Liu and Q. Liu, et al., Failure investigation of LiFePO4 cells in over-discharge conditions, J. Electrochem. Soc., 2013, 160(6), A793–A804 CrossRef CAS.
- Y. Liu and J. Xie, Failure Study of Commercial LiFePO4 Cells in Overcharge Conditions Using Electrochemical Impedance Spectroscopy, J. Electrochem. Soc., 2015, 162(10), A2208–A2217 CrossRef CAS.
- Y. Zheng, K. Qian and D. Luo, et al., Influence of over-discharge on the lifetime and performance of LiFePO 4/graphite batteries, RSC Adv., 2016, 6(36), 30474–30483 RSC.
- K. Qian, Y. Li and Y. B. He, et al., Abuse tolerance behavior of layered oxide-based Li-ion battery during overcharge and over-discharge, RSC Adv., 2016, 6(80), 76897–76904 RSC.
- L. Zhang, Y. Ma and X. Cheng, et al., Capacity fading mechanism during long-term cycling of over-discharged LiCoO2/mesocarbon microbeads battery, J. Power Sources, 2015, 293, 1006–1015 CrossRef CAS.
- M. Ouyang, D. Ren and L. Lu, et al., Overcharge-induced capacity fading analysis for large format lithium-ion batteries with LiyNi1/3Co1/3Mn1/3O2+ LiyMn2O4 composite cathode, J. Power Sources, 2015, 279, 626–635 CrossRef CAS.
- F. Larsson and B. E. Mellander, Abuse by external heating, overcharge and short circuiting of commercial lithium-ion battery cells, J. Electrochem. Soc., 2014, 161(10), A1611–A1617 CrossRef CAS.
- D. Ouyang, J. Liu and M. Chen, et al., Investigation into the Fire Hazards of Lithium-Ion Batteries under Overcharging, Appl. Sci., 2017, 7(12), 1314 CrossRef.
- A. W. Golubkov, S. Scheikl and R. Planteu, et al., Thermal runaway of commercial 18650 Li-ion batteries with LFP and NCA cathodes–impact of state of charge and overcharge, RSC Adv., 2015, 5(70), 57171–57186 RSC.
- O. S. Mendoza-Hernandez, H. Ishikawa and Y. Nishikawa, et al., Cathode material comparison of thermal runaway behavior of Li-ion cells at different state of charges including over charge, J. Power Sources, 2015, 280, 499–504 CrossRef CAS.
- D. Ren, X. Feng and L. Lu, et al., An electrochemical-thermal coupled overcharge-to-thermal-runaway model for lithium ion battery, J. Power Sources, 2017, 364, 328–340 CrossRef CAS.
- N. Sato, Thermal behavior analysis of lithium-ion batteries for electric and hybrid vehicles, J. Power Sources, 2001, 99(1), 70–77 CrossRef CAS.
- M. Petzl, M. Kasper and M. A. Danzer, Lithium plating in a commercial lithium-ion battery–A low-temperature aging study, J. Power Sources, 2015, 275, 799–807 CrossRef CAS.
- P. Ping, Q. S. Wang and P. F. Huang, et al., Study of the fire behavior of high-energy lithium-ion batteries with full-scale burning test, J. Power Sources, 2015, 285, 80–89 CrossRef CAS.
- M. Chen, J. Liu and Y. He, et al., Study of the fire hazards of lithium-ion batteries at different pressures, Appl. Therm. Eng., 2017, 125, 1061–1074 CrossRef.
- Y. Fu, S. Lu, K. Li, C. Liu, X. Cheng and H. Zhang, An experimental study on burning behaviors of 18650 lithium ion batteries using a cone calorimeter, J. Power Sources, 2015, 273, 216–222 CrossRef CAS.
- D. Ouyang, Y. He and M. Chen, et al., Experimental study on the thermal behaviors of lithium-ion batteries under discharge and overcharge conditions, J. Therm. Anal. Calorim., 2018, 132(1), 65–75 CrossRef CAS.
- O. S. Mendoza-Hernandez, H. Ishikawa and Y. Nishikawa, et al., Cathode material comparison of thermal runaway behavior of Li-ion cells at different state of charges including over charge, J. Power Sources, 2015, 280, 499–504 CrossRef CAS.
| This journal is © The Royal Society of Chemistry 2018 |

