 Open Access Article
An investigation of gaseous hydrogen storage characterizations of Mg–Y–Ni–Cu alloys synthesized by melt spinning
Yanghuan Zhang *ab,
Yanquan Jiab,
Zeming Yuanab,
Wengang Buab,
Yan Qib and
Shihai Guob
aKey Laboratory of Integrated Exploitation of Baiyun Obo Multi-Metal Resources, Inner Mongolia University of Science and Technology, Baotou 014010, China
bDepartment of Functional Material Research, Central Iron and Steel Research Institute, Beijing 100081, China. E-mail: zhangyh59@sina.com
First published on 14th August 2018
Abstract
Melt spinning was successfully utilized to prepare Mg25−xYxNi9Cu (x = 0, 1, 3, 5, 7) alloys, producing nanocrystalline and amorphous structures with improved hydrogenation and dehydrogenation performances. The influence of spinning rate on hydrogenation and dehydrogenation thermodynamics and kinetics was studied in detail. XRD and TEM were utilized to characterize the alloy structures. Hydrogenation and dehydrogenation performances were investigated by Sievert apparatus, DSC and TGA connected to a H2 detector. Dehydrogenation activation energies were estimated using both Arrhenius and Kissinger methods. Results show that melt spinning significantly decreases thermodynamic parameters (ΔH and ΔS) and ameliorates desorption kinetics. Dehydrogenation activation energy markedly lowers with increase in spinning rate and is the real driver of amelioration of dehydrogenation kinetics caused by increasing Y content.
Introduction
Booming consumption of fossil fuels results in acceleration of their exhaustion and seriously damages the environment, especially through progressively serious global warming and air pollution. Reducing consumption of fossil fuels and preventing further damage to our natural environment are two urgent issues that must be addressed. Universally, wide application of clean energy vehicles is a promising strategy for the above issues due to the fact that transport consumes a great deal of energy worldwide1 and vehicular combustion of fossil fuels produces about 23% of CO2 globally.2 Recently, the Ministry of Environmental Protection of China published an authoritative investigation report and proclaimed that the most responsible factor for atmospheric haze in Beijing is vehicle exhaust. Hydrogen is regarded as the best fuel of all available clean energy, due to its advantages of no CO2 emission, inexhaustible supply and high energy efficiency.3–5 The overarching technical challenge for transportation and vehicles is the development of a practical hydrogen storage system that can reach the conventional requirement of at least a 300 mile driving range.6–8 Thus, development of hydrogen storage technology determines whether a hydrogen fuel cell vehicle could be applied commercially and widely in the 21st century.9 Among all hydrogen storage systems, one of the best candidates to satisfy mobile application is metal hydride.10,11 Many studies have been performed on different metal hydrides, seeking a suitable hydrogen storage system. Many metal hydrides have been found and are thought to have potential application prospects. In particular, in the USA, Japan and China, rare-earth-based AB5- and AB2-type alloys have achieved mass production. Unfortunately, satisfying all requirements of performance for vehicular application, as presented by the U.S. Department of Energy (DOE), remains an unrealized goal.12,13 High theoretical gaseous hydrogen storage capacity (3.6 wt%) and electrochemical capacity (1000 mA h g−1) of Mg2NiH4 (ref. 14 and 15) give Mg–Ni-based metal hydrides an advantage in hydrogen storage application in hydrogen fuel cell vehicles and negative electrode material in Ni-MH batteries.16 Nevertheless, Mg-based alloys are still restricted in practical application by intrinsic imperfections, such as poor hydrogenation/dehydrogenation kinetics, relatively high dehydrogenation temperatures and exceedingly weak electrochemical cyclic stability.17,18 Two approaches to ameliorate Mg-based alloys' weaknesses in hydrogen storage properties are alloying and microstructure modification.19,20 Particularly, in the Mg2Ni-type alloy, partially substituting Mg with rare earth elements decreases hydride stability and facilitates hydrogen desorption.21–24 Moreover, it has been confirmed that the microstructure of Mg-based alloys has a significant impact on their hydrogenation/dehydrogenation kinetics.25,26 As reported by Siarhei et al.,27 hydrogenation/dehydrogenation properties of Mg-base alloys are ameliorated drastically when their grain sizes reduce far below micrometer scale. Some preparation technologies, particularly mechanical milling28 and melt spinning,29 have been successfully used in the synthesis of nanocrystalline and amorphous structures with the elements distributed homogeneously. Spassov et al.30 also found that Mm (Mm = Ce, La-rich misch metals) could significantly increase the hydrogenation capacity of as-spun amorphous and nanocrystalline Mg75Ni20Mm5 alloy. Huang et al.31 prepared an as-spun amorphous and nanocrystalline (Mg60Ni25)90Nd10 alloy and found that its maximal discharge capacity is 580 mA h g−1. The improved de-/hydrogenation kinetics of ternary LaCuMg8 alloy could be explained by the influences of MgCu2 and Mg2Cu.32 Transition metals can play the role of catalysts to dissociate the H2 molecule into absorbable monotonic hydrogen atoms.33–35To investigate the effects of Y content on hydrogen storage and thermodynamic and dynamic characteristics, we chose Y to partially substitute for Mg in Mg–Ni-based alloy and applied melt spinning technology to prepare nanocrystalline and amorphous Mg25−xYxNi9Cu (x = 0–7) alloys in the present study.
Experimental
Mg25−xYxNi9Cu (x = 0, 1, 3, 5, 7) alloys were prepared in a vacuum induction furnace filled with 0.04 MPa helium atmosphere to prevent magnesium volatilization. As the alloys have different Y contents, we labeled these alloys as Y0, Y1, Y3, Y5 and Y7 for convenience. Cast ingots were fabricated by pouring the molten alloy in a copper cooled mould. An appropriate number of as-cast alloys were re-melted and dealt by melt-spinning with spinning rates set at 15, 20, 25 and 30 m s−1. As the accurate cooling rate of samples was difficult to measure, we treated the linear velocity of copper roller as the approximate spinning rate.X-ray diffraction (XRD) (D/max/2400) equipped with a CuKα1 radiation filtered by graphite was used for determining the phase structure of alloys. Experimental parameters were set at 160 mA, 40 kV and 10° min−1.
A high-resolution transmission electron microscope (HRTEM) (JEM-2100F) was used to observe the as-spun alloys at 200 kV. Electron diffraction (ED) was performed to ascertain their crystalline states.
An automatically controlled Sieverts apparatus (temperature error within ±2 K) was used to measure P–C–T curves and hydrogenation/dehydrogenation curves of the alloys; 300 mg sample was weighed for each measurement. Hydrogenation was conducted at 3 MPa initial hydrogen pressure and different temperatures of 553, 573 and 593 K. Dehydrogenation was measured at initial hydrogen pressure of 1 × 10⁻⁴ MPa and the same temperatures corresponding to those for hydrogenation. Dehydrogenation properties of alloys at different heating rates of 5, 10, 15 and 20 K min−1 were also measured by differential scanning calorimetry (DSC) and thermogravimetric analysis (TGA) (SDT-Q600).
Results and discussion
Microstructure characteristics
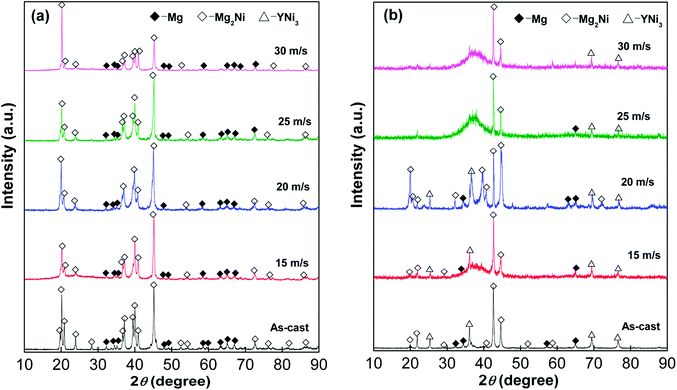
XRD was used to analyze structure and phase composition of the as-cast and as-spun Mg25−xYxNi9Cu (x = 0–7) alloys, as shown in Fig. 1. The as-cast and as-spun Y0 alloys exhibit narrow and sharp diffraction peaks in Fig. 1(a), indicating a typical crystal structure. Moreover, when the spinning rate reaches 25 m s−1, amorphous structure appears in the alloy, as broad and flat diffraction peaks appear in the XRD curves of as-spun Y3 alloy. Therefore, it can be conjectured that promotion of glass forming in Mg–Ni-based alloys was caused by Y substituting Mg. Fig. 2 shows SEM images and EDS spectra of alloys and demonstrates that Y0 alloy is consistent with major phase Mg2Ni and secondary phase Mg. Addition of Y brings on the appearance of secondary phase YNi3 while keeping the Mg2Ni and Mg phases unaltered, as can be seen comparing Fig. 1(a) and (b) and by SEM analysis, as shown in Fig. 2.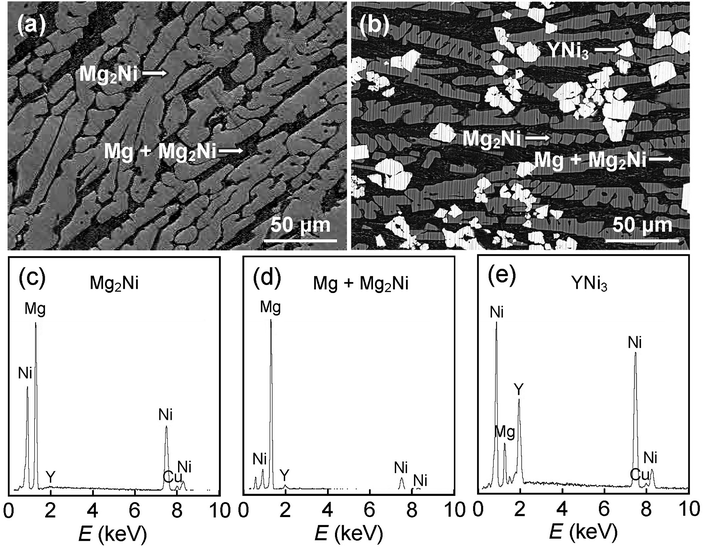 | ||
| Fig. 2 (a and b) SEM images and (c–e) typical EDS spectra of as-cast alloys: (a) Y0 alloy and (b) Y3 alloy. | ||
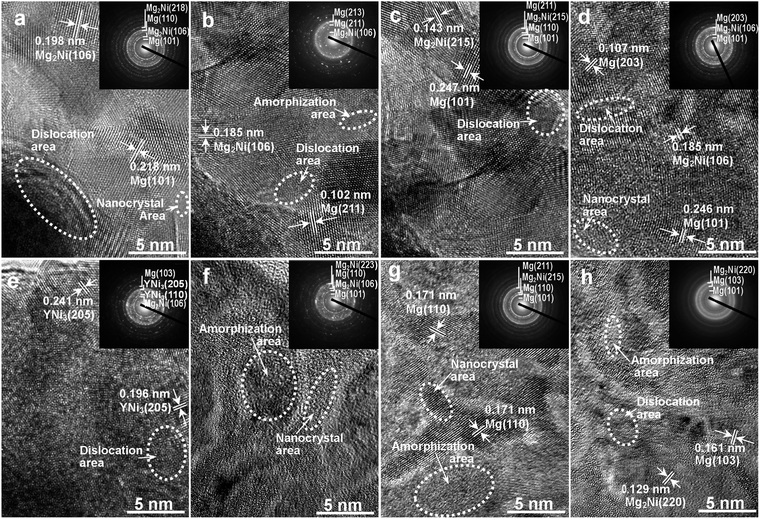
Fig. 3 shows morphologies and crystal states of as-spun alloys, measured by HRTEM and ED, respectively. The crystalline alloy was disordered by melt spinning and forms a nanostructure. Meanwhile, some crystal defects appear, for instance, subgrains and grain boundaries. Through the linear intercept method, we confirm the grain size range to be 20–30 nm on average. Careful observation finds nanocrystalline structure in as-spun Y0 alloys and sharp multi-haloes in their ED patterns, which confirms nanocrystalline structure of Mg2Ni and Mg phases in the alloys. Through the Debye–Scherrer rings, the structure of as-spun Y3 alloy is confirmed to show both clear nanocrystalline and amorphous features.
Hydrogen storage thermodynamics
Fig. 4 shows the P–C–T curves of the as-prepared Mg25−xYxNi9Cu (x = 0–7) alloys at 573 K. It is clear that there are two pressure plateaus in each P–C–T curve, corresponding to the hydriding and dehydriding processes of Mg/MgH2 (lower pressure plateau) and Mg2Ni/Mg2NiH4 (higher pressure plateau), respectively. Moreover, the pressure plateaus of hydrogen absorption and desorption show clear gradients and have large hysteresis (Hf = ln(Pa/Pd)). Melt spinning visibly lifts the absorption and desorption pressure plateaus, which is ascribed to the increase in internal strain introduced by melt spinning. It is worth noting that the increase in spinning rate has a marked influence on hydrogen storage capacity; the correspondence between spinning rate and hydrogen storage capacity is shown in the inset of Fig. 4. Evidently, the hydrogen storage capacity first increases and later decreases with the increase in spinning rate.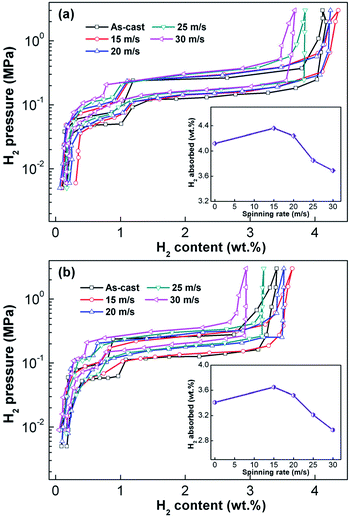 | ||
| Fig. 4 P–C–T curves of the as-cast and as-spun Y0 and Y3 alloys at 573 K: (a) Y0 alloy and (b) Y3 alloy. | ||
The increase in hydrogenation capacity can be attributed to the refined grain size, namely, formation of a nanocrystalline structure.36 As the spinning rate is further increased, more amorphous phase is formed inside the alloy, resulting in a decrease in hydrogenation capacity of the alloy. Maximal capacities of Y0 and Y3 alloys are 4.36 wt% and 3.65 wt% respectively, which indicates that substitution of Mg by Y leads to a significant decrease in hydrogen absorption capacity. It is well known that hydrogenation and dehydrogenation thermodynamic parameters of an alloy are the main standards to evaluate thermal stability of the hydride, which can be derived with Van't Hoff equation as shown below:37
| ln[P(H2)/P0] = ΔH/(RT) − ΔS/R | (1) |
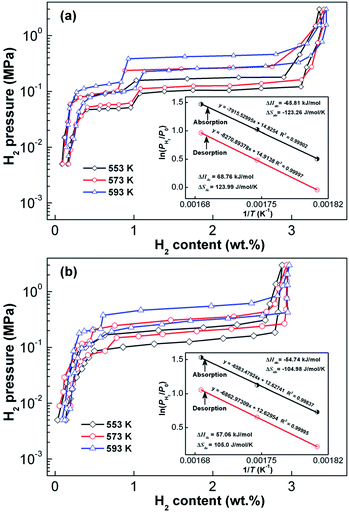 | ||
| Fig. 5 P–C–T curves of the as-cast and as-spun (30 m s−1) Y3 alloys in the temperature range of 553–593 K. Van't Hoff plots (insets): (a) as-cast, (b) as-spun (30 m s−1). | ||
| States | Absorption | Desorption | ||
|---|---|---|---|---|
| ΔH (kJ mol−1) | ΔS (J mol−1 K−1) | ΔH (kJ mol−1) | ΔS (J mol−1 K−1) | |
| As-cast | −65.81 | −123.26 | 68.76 | 123.99 |
| As-spun | −54.74 | −104.98 | 57.06 | 105.0 |
Temperature programmed desorption curves of the as-cast and as-spun Y0 and Y3 alloys, which were in a saturated hydrogen absorption condition at 3 MPa and 573 K, were measured in confined space at 5 K min−1 heating rate and shown in Fig. 6. Samples were taken in equal weight to avoid the influence on desorption temperature caused by increased pressure. As seen from the figures, the increase in spinning rate reduces the initial hydrogen desorption temperature in as-cast and as-spun alloys, which suggests that melt spinning reduces stability of the hydride. Increasing the spinning rate of alloy from 0 (as-cast alloy) to 30 m s−1 results in the decrease in the initial hydrogen desorption temperatures of Y0 and Y3 alloys from 532.8 to 504.2 K and from 511.7 to 494.3 K, respectively. Comparison of Fig. 6(a) and (b) demonstrates that for a fixed spinning rate, Y3 alloy exhibits a lower starting hydrogen desorption temperature compared with Y0 alloy, indicating that replacement of Mg by Y reduces thermal stability of hydride. The decreased starting hydrogen desorption temperature caused by melt spinning can be ascribed to formation of the nanocrystalline and amorphous structures because the refined microstructure plays a dominant role in decreasing the dehydrogenation temperature.38,39
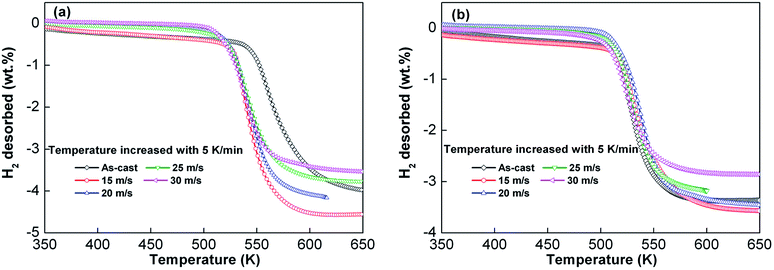 | ||
| Fig. 6 Temperature programmed desorption curve of as-cast and as-spun Y0 and Y3 alloys after hydrogen absorption at a heating rate of 5 K min−1: (a) Y0 alloy and (b) Y3 alloy. | ||
Hydrogen absorption and desorption kinetics
Fig. 7 shows the hydriding curves of Y0 and Y3 alloys of different spinning rates at 573 K and 3 MPa. The as-cast and as-spun alloys absorb hydrogen quickly during the inception phase and then, the hydrogen absorption rate decreases sharply. It takes a long time for alloys to achieve nearly full hydrogen saturation. Apart from hydrogenation capacity, hydrogen absorption and desorption rates are also important influences on the application of hydrogen storage materials. Herein, hydrogen absorption saturation ratio (Ra(t)) was used to characterize hydrogen absorption kinetics of the alloy. Ra(t) is the ratio of absorbed hydrogen content at time t to the maximum absorbed hydrogen content and is expressed as Ra(t) = Ca(t)/Ca(100) × 100%, where Ca(t) and Ca(100) respectively represent the absorbed hydrogen content at times t and 100 min. The Ca(100) value, which is found to be higher than 98% of the maximum hydrogen absorption capacity, is seen as approximately the maximum absorbed hydrogen content of alloys. We chose 5 minutes as the duration for hydrogen absorption and the changes in Ra(5) (t = 5) values with the increase in spinning rate of Y0 and Y3 alloys were recorded, as shown in the insets of Fig. 7(a) and (b). The data show that increasing the spinning rate leads to the Ra(5) value of Y0 alloy to first increase and later decrease, while the value markedly decreases for Y3 alloy. With the spinning rate increasing from 0 to 30 m s−1, the Ra(5) (t = 5) value of Y3 alloy reduces from 88.8% to 78.6%, but grows from 85.8% (0 m s−1) to 91.5% (15 m s−1) first and then decreases to 83.3% (30 m s−1) for Y0 alloy.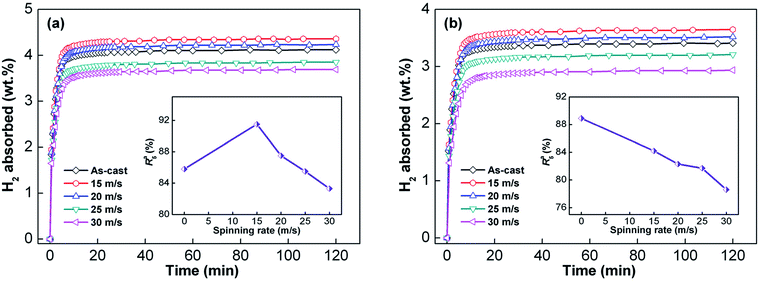 | ||
| Fig. 7 Hydrogen absorption kinetic curves of the as-cast and as-spun Y0 and Y3 alloys at 573 K: (a) Y0 alloy and (b) Y3 alloy. | ||
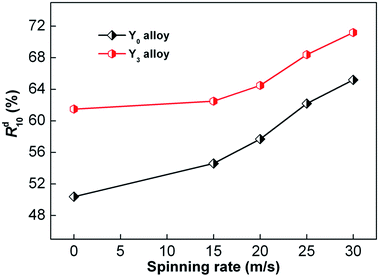
Similarly, hydrogen desorption ratio (Rd(t)) was used to signify the hydrogen desorbing kinetics of the alloy. Rd(t) is the ratio of the desorbed hydrogen content at time t to the maximum absorbed hydrogen content, which can be calculated by Rd(t) = Cd(t)/Ca(100) × 100%, where Cd(t) represents the desorbed hydrogen content at t min and Ca(100) represents the same as previously mentioned. We chose 10 minutes as the duration of hydrogen desorption, and the changes in Rd(10) (t = 10) values with the increase in spinning rate of Y0 and Y3 alloys were established, as shown in Fig. 8. It is clear that with the increase in spinning rate, the dehydriding rates of Y0 and Y3 alloys strictly increase. Specifically, the increase in spinning rate of Y0 and Y3 alloys from 0 to 30 m s−1 enhances their Rd(10) values from 50.4% to 65.2% and from 61.5% to 71.2%, respectively. This evidences that Y3 alloy has a higher Rd(10) value compared with that of Y0 alloy at a fixed spinning rate, indicating that the substitution of Y for Mg has an ameliorative influence on the hydrogen desorption kinetics of alloys.
It is generally acknowledged that hydrogen absorption rate is decided by the following factors: the decomposition rate of hydrogen molecules on surface, the penetration rate of hydrogen atoms on surface into the bulk metal, and the formation rate of hydride in metal. Among these factors, the slowest step primarily dominates the hydrogen absorption rate. The experimental results reveal that hydrogen storage capacity and kinetics are significantly affected by the variation in spinning rate. Regarding the active role of melt spinning in hydrogen storage capacity and kinetics, the change in alloy structure resulting from melt spinning cannot be ignored. Structure identification shows that melt spinning disorders the crystalline structure and turns it, or at least part of it, into nanocrystalline. As grain boundary contains a much higher hydrogen concentration than grain interior and amorphous region,40 the hydrogen storage capacity of this alloy is enhanced through melt spinning due to the numerous crystallites and grain boundaries created. Also, a grain boundary facilitates diffusion of hydrogen inside the alloy and improves its hydrogen absorption kinetics by providing numerous sites that require low diffusion activation energy.41 Regarding the negative influence of melt spinning on hydrogen storage property, the glass phase facilitated by Y replacing Mg and the increase in spinning rate are mainly responsible owing to the fact that it is much easier for hydrogen atoms to diffuse in a nanocrystalline phase than in an amorphous phase. Moreover, the negative influence on hydrogen storage capacity and kinetics resulting from the stored strain energy created during melt spinning cannot be ignored. The promotion in hydrogen desorption kinetics caused by melt spinning is thought to be connected with the decreased grain size and enhanced internal strain because of the drastic improvement in ultrafine powder size (far below micrometer scale) on dehydrogenation performance of Mg-based alloy.42 Moreover, Northwood et al.43 considered that the increase in spinning rate leads to the growth of stored internal strain, which consequently causes a significant decline in the stability of metal hydrides, thus facilitating hydrogen desorption.
Dehydrogenation activation energy
Generally, the total energy barrier that a reaction needs to surmount is known as the activation energy, which is an important factor that determines the kinetics of a gas–solid reaction. With respect to hydrogen desorption reaction, activation energy is the total energy barrier during dehydrogenation processes. Hence, the driving force for the dehydrogenation process can be measured through activation energy. In this study, the Arrhenius and Kissinger methods, two common methods for estimating hydrogen desorption activation energy, were used to reveal the influence of melt spinning on dehydrogenation kinetics. To determine the kinetics of alloys by the Arrhenius method, experimental alloys were measured in the temperature range of 553 to 593 K. The as-cast and as-spun Y3 alloys were chosen as representatives, and their dehydrogenation kinetic curves are shown in Fig. 9. Usually, the nucleation and growth processes of dehydrogenation can be simulated by the Johnson–Mehl–Avrami (JMA) model with the following JMA equation:44
ln[−ln(1 − α)] = η![[thin space (1/6-em)]](https://www.rsc.org/images/entities/char_2009.gif) ln ln![[thin space (1/6-em)]](https://www.rsc.org/images/entities/char_2009.gif) k + η k + η![[thin space (1/6-em)]](https://www.rsc.org/images/entities/char_2009.gif) ln ln![[thin space (1/6-em)]](https://www.rsc.org/images/entities/char_2009.gif) t t
| (2) |
![[thin space (1/6-em)]](https://www.rsc.org/images/entities/char_2009.gif) t can be constructed, as shown in the inset of Fig. 9. The JMA plots are found to be nearly linear, implying that the dehydriding reaction of alloys abides by instantaneous nucleation and interface controlled three-dimensional growth process.45 Thus, the η and η
t can be constructed, as shown in the inset of Fig. 9. The JMA plots are found to be nearly linear, implying that the dehydriding reaction of alloys abides by instantaneous nucleation and interface controlled three-dimensional growth process.45 Thus, the η and η![[thin space (1/6-em)]](https://www.rsc.org/images/entities/char_2009.gif) ln
ln![[thin space (1/6-em)]](https://www.rsc.org/images/entities/char_2009.gif) k values at different temperatures can be derived from the slope and intercept of JMA plots and the value of k can be easily calculated. The activation energy (Ea) of dehydrogenation can be derived from the Arrhenius equation as follows:46
k values at different temperatures can be derived from the slope and intercept of JMA plots and the value of k can be easily calculated. The activation energy (Ea) of dehydrogenation can be derived from the Arrhenius equation as follows:46
k = A![[thin space (1/6-em)]](https://www.rsc.org/images/entities/char_2009.gif) exp[−Ea/(RT)] exp[−Ea/(RT)]
| (3) |
![[thin space (1/6-em)]](https://www.rsc.org/images/entities/char_2009.gif) k vs. 1/T, from the slopes of which the activation energy Ea can be derived. Ea values of the as-cast and as-spun (30 m s−1) Y3 alloys are 69.12 and 61.01 kJ mol−1, respectively, indicating that melt spinning can decrease the dehydrogenation activation energy.
k vs. 1/T, from the slopes of which the activation energy Ea can be derived. Ea values of the as-cast and as-spun (30 m s−1) Y3 alloys are 69.12 and 61.01 kJ mol−1, respectively, indicating that melt spinning can decrease the dehydrogenation activation energy.
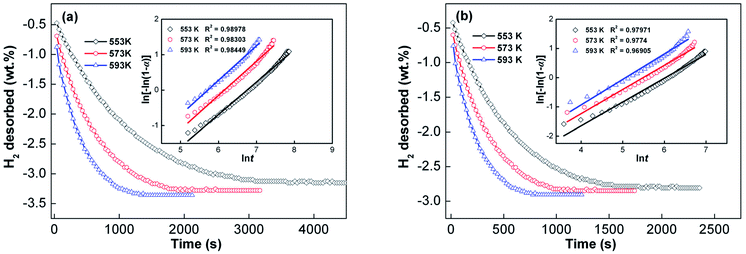 | ||
Fig. 9 Hydrogen desorption kinetic curves of the as-cast and as-spun (30 m s−1) Y3 alloy at 553, 573 and 593 K and Avrami plots of ln[−ln(1 − α)] vs. ln![[thin space (1/6-em)]](https://www.rsc.org/images/entities/char_2009.gif) t: (a) as-cast and (b) as-spun (30 m s−1). t: (a) as-cast and (b) as-spun (30 m s−1). | ||
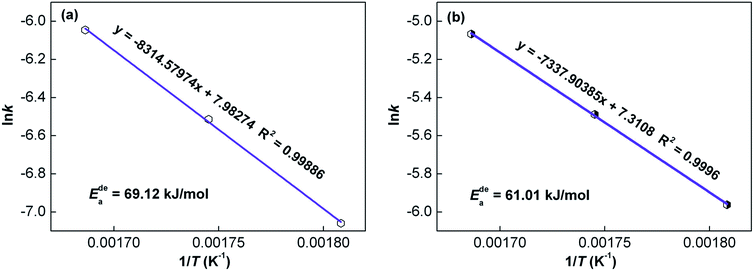 | ||
| Fig. 10 Arrhenius plots of the as-cast and as-spun (30 m s−1) Y3 alloy: (a) as-cast and (b) as-spun (30 m s−1). | ||
To verify the result achieved from the Arrhenius method, the Kissinger method was used for calculating the dehydrogenation activation energy using the Kissinger equation given below:47
| d{ln[β/(Tp)2]}/d(1/Tp) = −Ek/R | (4) |
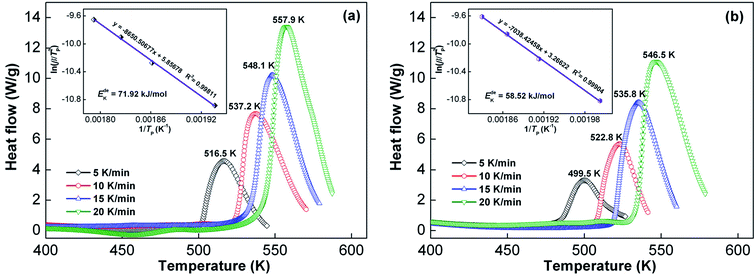 | ||
| Fig. 11 DSC curves of the as-cast and as-spun (30 m s−1) Y3 alloy at various heating rates and Kissinger plots: (a) as-cast, (b) as-spun (30 m s−1). | ||
Arrhenius and Kissinger methods were both used to calculate the activation energy Ede (Ede = Ea for Arrhenius method and Ede = Ek for Kissinger method). Fig. 12 shows the relationship between Ede values and spinning rate, which reveals that the Ede values markedly decline with the increase in spinning rate. Moreover, it is also noted that Y3 alloy has a lower Ede than Y0 alloy for any fixed spinning rate. We draw a conclusion from the abovementioned findings that the decrease in dehydrogenation activation energy, which is the result of Y partly substituting Mg and melt spinning, is the real driver for the improvement of dehydrogenation kinetics.
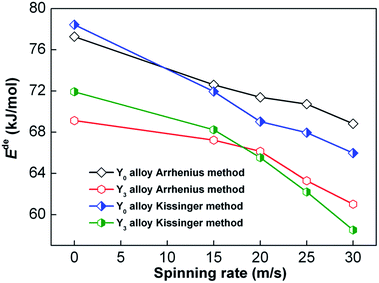 | ||
| Fig. 12 Evolutions of hydrogen desorption activation energies of Y0 and Y3 alloys calculated by Arrhenius and Kissinger methods with increase in spinning rate. | ||
Conclusions
Hydrogen storage thermodynamics and kinetics of as-cast and as-spun Mg25−xYxNi9Cu (x = 0–7) alloys were systematically studied and the major conclusions are listed below.(1) Melt spinning results in a significant decrease in thermodynamic parameters (ΔH and ΔS) and a dramatic improvement in dehydrogenation kinetics due to the declining dehydrogenation activation energy incurred by melt spinning.
(2) Melt spinning facilitates reduction of hydride stability. Increasing spinning rate from 0 to 30 m s−1 decreases starting dehydrogenation temperature from 532.8 to 504.2 K for Y0 alloy and 511.7 to 494.3 K for Y3 alloy.
(3) Dehydrogenation activation energies of experimental alloys were evaluated by both Arrhenius and Kissinger methods. Result reveal that dehydrogenation activation energy declines with the increase in spinning rate, which is regarded to be the real driver for improvement of dehydrogenation kinetics caused by melt spinning.
Conflicts of interest
There are no conflicts to declare.Acknowledgements
This study was financially supported by National Natural Science Foundations of China (51761032 and 51471054)References
- D. Mori and K. Hirose, Int. J. Hydrogen Energy, 2009, 34, 4569–4574 CrossRef.
- R. Lan, J. T. S. Irvine and S. Tao, Int. J. Hydrogen Energy, 2012, 37, 1482–1494 CrossRef.
- I. P. Jain, Int. J. Hydrogen Energy, 2009, 34, 7368–7378 CrossRef.
- Y. Bai, C. Wu, F. Wu, J. H. Yang, L. L. Zhao, F. Long and B. L. Yi, Int. J. Hydrogen Energy, 2012, 37, 12973–12979 CrossRef.
- V. S. Arunachalam and E. L. Fleischer, MRS Bull., 2008, 33, 264–275 CrossRef.
- L. Schlapbach and A. Züttel, Nature, 2001, 414, 353–358 CrossRef PubMed.
- V. Bhat, A. Rougier, L. Aymard, G. A. Nazri and J. M. Tarascon, Int. J. Hydrogen Energy, 2007, 37, 4900–4906 CrossRef.
- Y. Zhang, M. Ji, Z. Yuan, W. Bu, Y. Qi and S. Guo, RSC Adv., 2017, 7, 37689–37698 RSC.
- W. Hui, S. Takenaka and K. Otsuka, Int. J. Hydrogen Energy, 2006, 31, 1732–1746 CrossRef.
- Z. M. Yuan, W. Zhang, P. L. Zhang, Y. H. Zhang, W. G. Bu, S. H. Guo and D. L. Zhao, RSC Adv., 2017, 7, 56365–56374 RSC.
- W. J. Song, J. S. Li, T. B. Zhang, X. J. Hou and H. C. Kou, Mater. Lett., 2015, 145, 193–196 CrossRef.
- L. E. Klebanoff and J. O. Keller, Int. J. Hydrogen Energy, 2013, 38, 4533–4576 CrossRef.
- L. Shaw, J. Pratt, L. Klebanoff, T. Johnson, M. Arienti and M. Moreno, Int. J. Hydrogen Energy, 2013, 38, 2810–2823 CrossRef.
- D. Chandra, A. Sharma, R. Chellappa, W. N. Cathey, F. E. Lynch, R. C. Bowman Jr., J. R. Wermer and S. N. Paglieri, J. Alloys Compd., 2008, 452, 312–324 CrossRef.
- N. Juahir, N. S. Mustafa, A. M. Sinin and M. Ismail, RSC Adv., 2015, 5, 60983–60989 RSC.
- A. Ebrahimi-Purkani and S. F. Kashani-Bozorg, J. Alloys Compd., 2008, 456, 211–215 CrossRef.
- I. P. Jain, C. Lal and A. Jain, Int. J. Hydrogen Energy, 2010, 35, 5133–5144 CrossRef.
- Y. B. Pan, H. Y. Leng, J. Wei and Q. Li, Int. J. Hydrogen Energy, 2013, 35, 5133–5144 Search PubMed.
- Y. F. Liu, H. G. Pan, M. X. Gao and Q. D. Wang, J. Mater. Chem., 2011, 21, 4743–4755 RSC.
- A. L. Eric, Int. J. Hydrogen Energy, 2011, 36, 10787–10796 CrossRef.
- T. Spassov and U. Köster, J. Alloys Compd., 1999, 287, 243–250 CrossRef.
- B. Darriet, M. Pezat, A. Hbika and P. Hagenmuller, Int. J. Hydrogen Energy, 1980, 5, 173–178 CrossRef.
- E. A. Lass, Int. J. Hydrogen Energy, 2011, 36, 10787–10796 CrossRef.
- D. H. Xie, P. Li, C. X. Zeng, J. W. Sun and X. H. Qu, J. Alloys Compd., 2009, 478, 96–102 CrossRef.
- A. Teresiak, A. Gebert, M. Savyak, M. Uhlemann, C. Mickel and N. Mattern, J. Alloys Compd., 2005, 398, 156–164 CrossRef.
- A. Montone, J. G. Novakovic, M. V. Antisari, A. Bassettib, E. Bonetti, A. L. Fiorini, L. Pasquini, L. Mirenghic and P. Rotolo, Int. J. Hydrogen Energy, 2007, 32, 926–2934 CrossRef.
- K. Siarhei, R. Lars, R. Thomas, G. Thomas, W. Thomas and K. Bernd, Int. J. Hydrogen Energy, 2011, 36, 1592–1600 CrossRef.
- M. Y. Song, Y. J. Kwak, H. S. Shin, S. H. Lee and B. G. Kim, Int. J. Hydrogen Energy, 2013, 38, 1910–1917 CrossRef.
- T. Spassov, L. Lyubenova, U. Koster and M. D. Baro, Mater. Sci. Eng., A, 2004, 375–377, 794–799 CrossRef.
- T. Spassov and U. Köster, J. Alloys Compd., 1999, 287, 243–250 CrossRef.
- L. J. Huang, G. Y. Liang, Z. B. Su and D. C. Wu, J. Power Sources, 2006, 160, 684–687 CrossRef.
- S. Couillaud, E. Gaudin, J. Andrieux, S. Gorsse, M. Gayot and J. L. Bobet, Int. J. Hydrogen Energy, 2012, 37, 11824–11834 CrossRef.
- J. Cui, J. Liu, H. Wang, L. Ouyang, D. Sun, M. Zhu and X. D. Yao, J. Mater. Chem. A, 2014, 2, 9645–9655 RSC.
- M. Pozzo and D. Alfe, Int. J. Hydrogen Energy, 2009, 34, 1922–1930 CrossRef.
- F. Tang, T. Parker, H. F. Li, G. C. Wang and T. M. Lu, Nanotechnology, 2008, 19, 465706 CrossRef PubMed.
- W. J. Song, J. S. Li, T. B. Zhang, H. C. Kou and X. Y. Xue, J. Power Sources, 2014, 245, 808–815 CrossRef.
- H. Falahati and D. P. J. Barz, Int. J. Hydrogen Energy, 2013, 38, 8838–8851 CrossRef.
- W. J. Song, J. S. Li, T. B. Zhang, X. J. Hou and H. C. Kou, RSC Adv., 2015, 5, 54258–54265 RSC.
- T. B. Zhang, W. J. Song, H. C. Kou and J. S. Li, Appl. Surf. Sci., 2016, 371, 35–43 CrossRef.
- T. Spassov, V. Rangelova and N. Neykov, J. Alloys Compd., 2002, 334, 219–223 CrossRef.
- L. Hima Kumar, B. Viswanathan and S. S. Murthy, J. Alloys Compd., 2008, 461, 72–76 CrossRef.
- T. Sadhasivam, M. Sterlin Leo Hudso, S. K. Pandey, A. Bhatnagar, M. K. Singh, K. Gurunathan and O. N. Srivastava, Int. J. Hydrogen Energy, 2013, 387, 353–7362 Search PubMed.
- H. Niu and D. O. Northwood, Int. J. Hydrogen Energy, 2002, 27, 69–77 CrossRef.
- M. Pourabdoli, S. Raygan, H. Abdizadeh and D. Uner, Int. J. Hydrogen Energy, 2013, 38, 11910–11919 CrossRef.
- T. Czujko, R. A. Varin, Ch. Chiu and Z. Wronski, J. Alloys Compd., 2006, 414, 240–247 CrossRef.
- T. Kimura, H. Miyaoka, T. Ichikawa and Y. Kojima, Int. J. Hydrogen Energy, 2013, 38, 13728–13733 CrossRef.
- H. E. Kissinger, Anal. Chem., 1957, 29, 1702–1706 CrossRef.
| This journal is © The Royal Society of Chemistry 2018 |

