
 Open Access Article
 This Open Access Article is licensed under a Creative Commons Attribution-Non Commercial 3.0 Unported Licence
Self-discharge rates in cells have a critical effect on the cycle life of parallel lithium-ion batteries†
Fuqiang An ,
Hongliang Zhao and
Ping Li*
,
Hongliang Zhao and
Ping Li*
Institute for Advanced Materials and Technology, University of Science and Technology Beijing, Beijing, China. E-mail: liping@ustb.edu.cn
First published on 31st August 2018
Abstract
More than two parameters are adopted to sort the lithium ion cells (LICs) for better performance in the production process, such as capacity, open-circuit voltage (OCV), direct current resistance (DCR), et al. However, more sorting parameters make mass production more complex. In order to solve this conflict, we compare capacity, OCV, DCR, and self-discharge rate (kOCV) in this paper, investigate their different effects on the cycle life of parallel LICs through analyzing the relationship between component cell variations and the durability of the parallel blocks. We find that the variations of the self-discharge rate in cells significantly affect the discharge capacity retention of the blocks: bigger variation in the cells results in a better cycle life of parallel LICs. Thus, it is prudent to perform cell sorting for the assembly of superior blocks based on the self-discharge rates of the cells.
1. Introduction
Normally, hundreds of lithium-ion cells (LICs) are connected in parallel and series in electric vehicles (EVs). Cell to cell variation (CtCV) is one of the most critical factors affecting the performance of the EVs,1–4 including calendar life, power characteristics and safety issues.5–7 In general, there are two approaches to improve the CtCVs.8–11The first approach is to strictly control the production process, including cell production and pack assembly. The corresponding solution involves the advancement of the LIC design to render it more compatible with the production line.9 The improvement of production automation and quality control,10 and optimization of the pack design by ensuring a uniform temperature, includes an accurate battery management system (BMS).11
The second approach is to eliminate the outliers through a sorting method. The main parameters include capacity, open current voltage (OCV), resistance, et al. However, in the published references, they mainly focus on the CtCVs in the initial state,8 and there is a gap in the knowledge of the effect of sorting parameters on the whole life period of the LICs.
We can understand that this work is important to LIC companies. Thus, to align the CtCVs of LICs across their whole life span, a number of special parameters must be proposed.
Based on these observations and our previous research conclusions,3 we consider the self-discharge rate (kOCV) of LICs, which can effectively combine the CtCVs of fresh and aged cells. Firstly, we test the capacity, OCV, direct current resistance (DCR) and kOCV of 100 cells, and sort 18 cells which can represent the characteristics of the whole cells; secondly, we analyze the CtCVs during the aging process by testing two cell parallel blocks (2P blocks) and obtain a sequence of parameters for CtCVs; in the end, we verify the above results using other 2P-blocks.
2. Experimental
Details regarding the LICs obtained from Boston Power Company (BPI) with a nominal capacity of 5300 mA h are outlined in Table 1. Fixtures for the 2P blocks were prepared using an acrylonitrile–butadiene–styrene (ABS) polymer, while the positive and negative electrodes were connected using copper bars, the specifications of which are outlined in Table 2.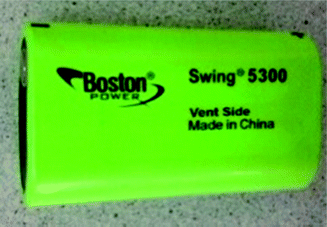
| Item | Value | |
|---|---|---|
| Type | 2P structure | 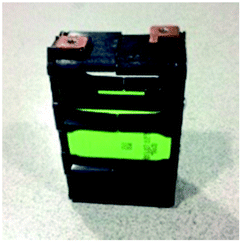 |
| Material | ABS | |
| Current collector | Copper bar | |
| Assembly method | Bolt only |
2.1 Sorting parameters
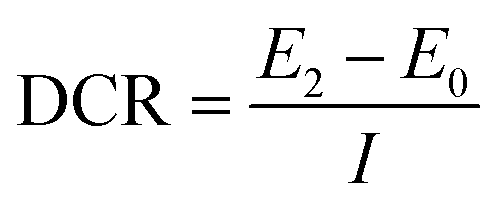
Capacity, DCR, OCV, and kOCV were measured for fresh cells, and also for the aged cells of 2P cycled blocks at 25 °C. Capacity was tested at a rate of 0.3C (1.59 A) in constant current–constant voltage (CC–CV) mode. The cutoff current for the constant voltage phase was 160 mA, with a discharge of 0.3C, and a voltage range of 2.75–4.2 V.DCR was tested using the current pulse method (Fig. S1, listed in the ESI†) using an electrochemical workstation (Solartron Modulab, Ametek, UK) at 100% SOC (State of Charge) and calculated using eqn (1); the discharge rate was 1C, duration time was 10 s, and the sampling frequency was 10 Hz.
 | (1) |
Fig. 1 shows a schematic representation of the test conducted for the self-discharge rate (kOCV). As the cells were fully charged, the OCV was immediately dominated by the relaxation caused by diffusion and charge-transfer dynamics, while the voltage decrease was significantly slower than the relaxation of the over-potential from the charging process.12 The OCV (t) was recorded at 2 h intervals over 2 days with a HIOKI BT3542. The OCV was the first data obtained for kOCV.
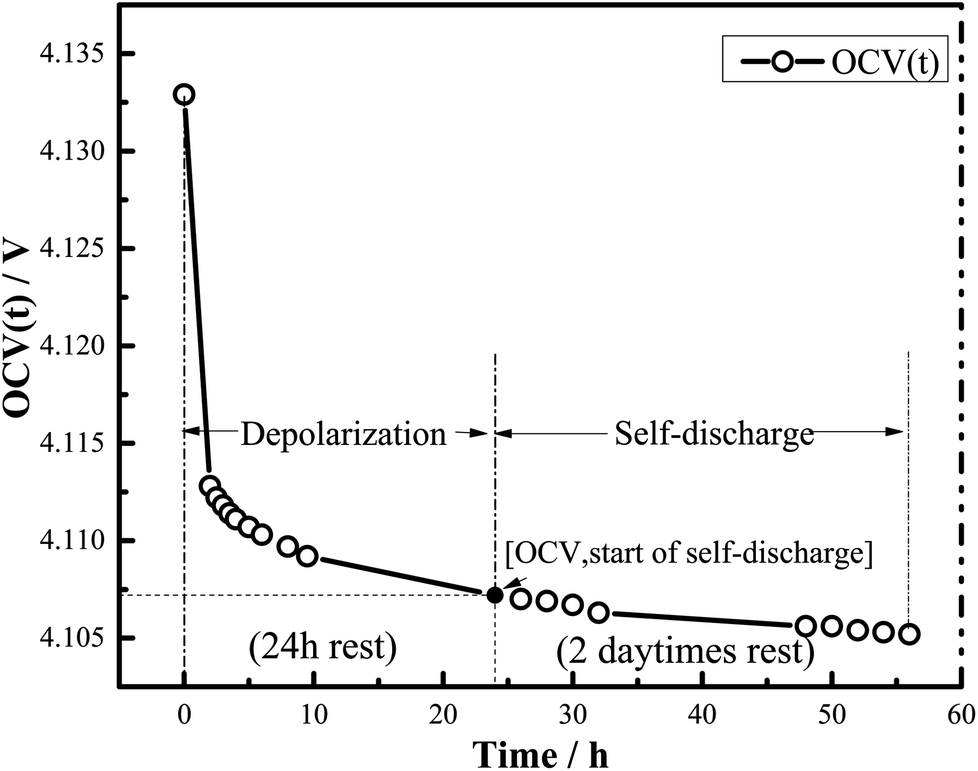 | ||
| Fig. 1 Schematic representation of the self-discharge test. | ||
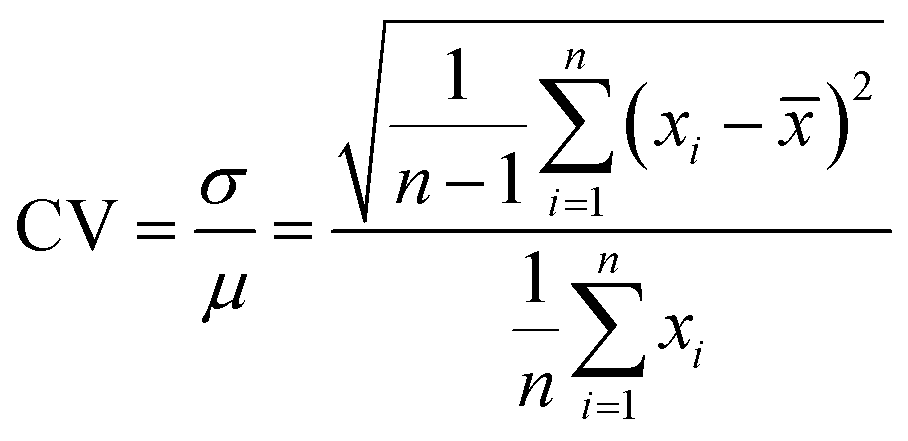
The coefficient of variation (CV, eqn (2)) is employed to compare the variation for different units:13
 | (2) |
For 2P blocks, cycle life was measured at a charge and discharge rate of 1C at 55 °C, capacity changes were calibrated after every 50 cycles at 25 °C, and the blocks were disassembled into cells to test the capacity, DCR, OCV, and kOCV values.
2.2 Experimental design
A vectorized computation of parameter variations was executed using Matlab. According to the division based on quartiles and extreme values, all variations were parameterized as low (code 1), middle (code 2), or high (code 3).Nine pairs of cells were randomly selected until the correct combination was obtained, the codes of which matched the experimental design codes. Using the design rules outlined in Table 3, the sorting principles were based on an orthogonal array, without considering minor interactions between the factors. These 9 pairs of cells were characterized over the whole experiment for statistical modeling. Moreover, 6 pairs of cells were randomly picked from the 100 cells considering only the levels to validate the results obtained from statistical modeling.
| Sample | Controlling factor | Response | ||||||
|---|---|---|---|---|---|---|---|---|
| Block SN | Cell SN | Capacity | DCR | CV | kOCV | CR50b | CR100 | CR150 |
| Variation | ||||||||
| a Levels 1, 2, and 3 represent the canonical coding of low, middle, and high levels in the experimental design, where the variation between the minimum value and 1/3 quartile of every sample feature is labeled level 1, the variation between the 1/3 quartile and 2/3 quartile of every sample feature is labeled level 2, and the variation between the 2/3 quartile and maximum of every sample feature is labeled level 3.b CR50, CR100, and CR150 represent the capacity retention of the blocks after 50, 100, and 150 cycles, respectively. | ||||||||
| Block 1 | Cell 1-1, cell 1-2 | 1a | 1 | 1 | 1 | |||
| Block 2 | Cell 2-1, cell 2-2 | 1 | 2 | 2 | 2 | |||
| Block 3 | Cell 3-1, cell 3-2 | 1 | 3 | 3 | 3 | |||
| Block 4 | Cell 4-1, cell 4-2 | 2a | 1 | 2 | 3 | |||
| Block 5 | Cell 5-1, cell 5-2 | 2 | 2 | 3 | 1 | |||
| Block 6 | Cell 6-1, cell 6-2 | 2 | 3 | 1 | 2 | |||
| Block 7 | Cell 7-1, cell 7-2 | 3a | 1 | 3 | 2 | |||
| Block 8 | Cell 8-1, cell 8-2 | 3 | 2 | 1 | 3 | |||
| Block 9 | Cell 9-1, cell 9-2 | 3 | 3 | 2 | 1 | |||
3. Results and discussion
3.1 Calculation of the self-discharge rate (kOCV)
Fig. 2 shows the variation in kOCV with time, where R2 is always >0.99, and the regular residuals are located on both sides of the zero line. In addition, a linear relationship is observed between the percentiles and regular residuals, reflective of the normal distribution of the residuals. A good linear relationship is observed between voltage and rest time:14| y = kx + b | (3) |
 | (4) |
| b = (Σyi)/m − k(Σxi)/m | (5) |
 | (6) |
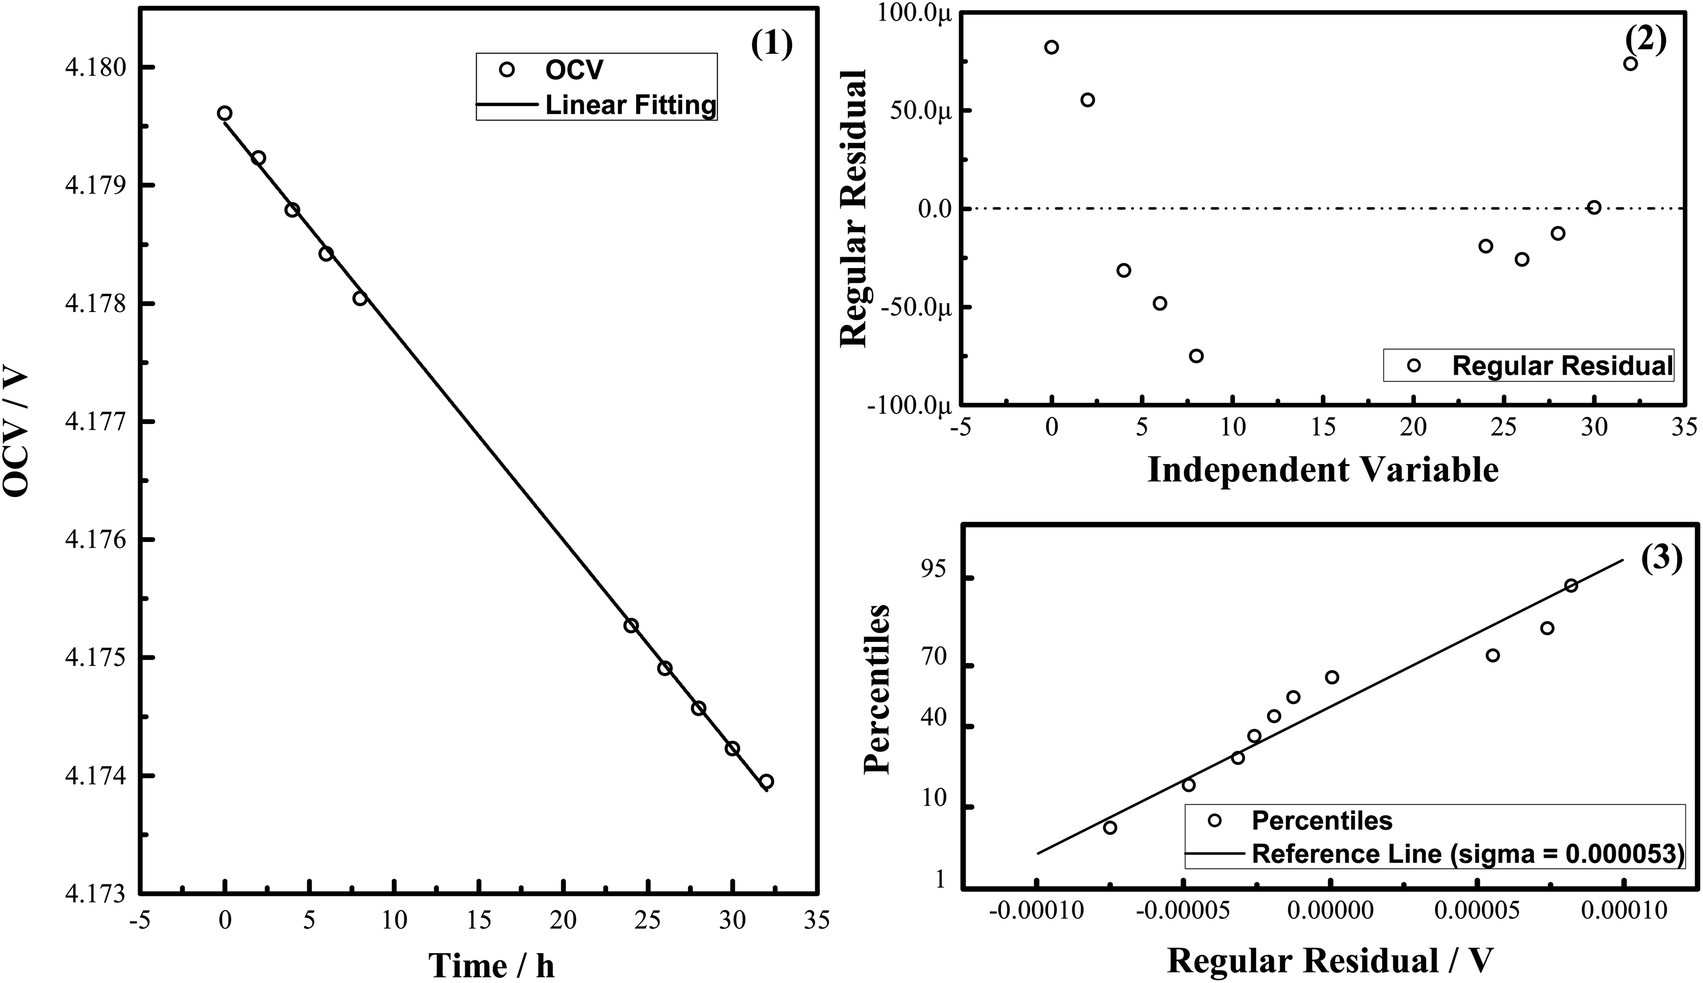 | ||
| Fig. 2 Relationship between OCV and time during the self-discharge test: (1) plot of decreasing OCV versus time; (2) regular residual of OCV based on the linear fitting of OCV vs. time; and (3) regular residual versus percentiles. | ||
3.2 Selection of 18 cells from 100 cells
Resampling was performed using Matlab. Initially, the vectorized computation of parameter variation was executed. As shown in Fig. 3, all variations of selectable pairs of cells for the 2P blocks of approximately C1002 = 4950 dots are mapped in the upper left-hand area, and the dots are subsequently divided into three classes by the 1/3 and 2/3 quartiles of each feature. Nine pairs of cells were then randomly pre-allocated to an array, where all elements of the array are unique. Finally, the pre-allocated array in the variation space of the 2P cells and in the design space of the orthogonal array was compared using Matlab.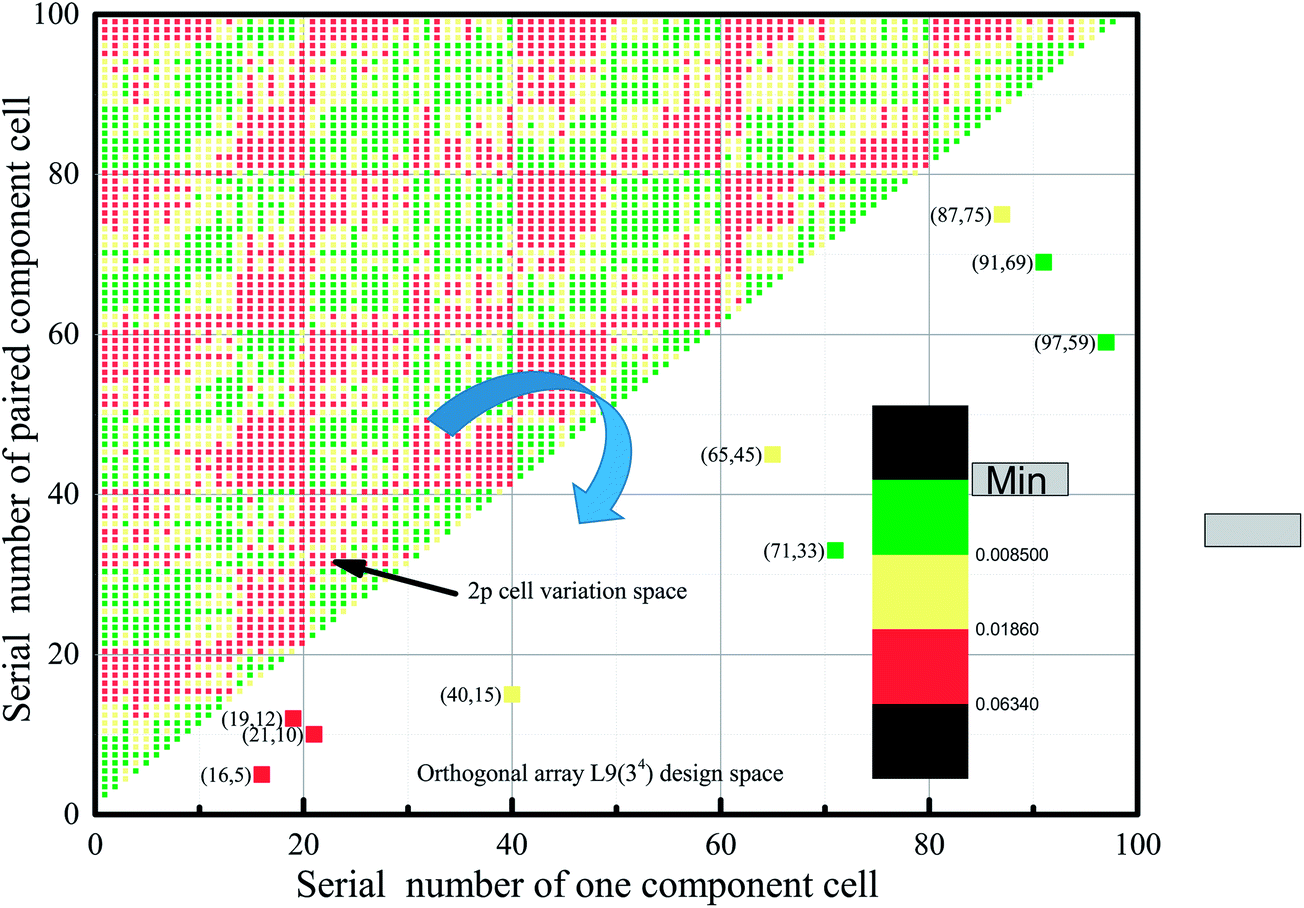 | ||
| Fig. 3 Schematic representation of the sampling of experimental cells from the total sample using Matlab. | ||
The experimental sample was obtained from the total sample, as guided by the design of experiment (DOE). However, it is still imperative to ascertain whether the experimental sample could represent the total sample based on statistical analysis.
Fig. 4 shows the feasibility of resampling these 9 cells from the total sample. All hollow dots and filled block dots are cluttered in a fixed range for each feature, and the observed values exhibit no clear trend with increasing serial number. Hence, the total and experimental samples were considered stochastic. Moreover, elementary statistics for all features were obtained from Box–Whisker plots, which represent the height of the box (representative of 50% of the sample), medians, outliers, and other factors, as can be seen in panels (5–8). As shown, the heights of all the gray boxes were comparable to or less than those of the white boxes. In addition, the median line in the gray box was comparable to that of the white box, and the outliers outside of the white Box–Whisker plot disappeared in the gray one. Hence, the experimental samples can be considered representative of the total sample.
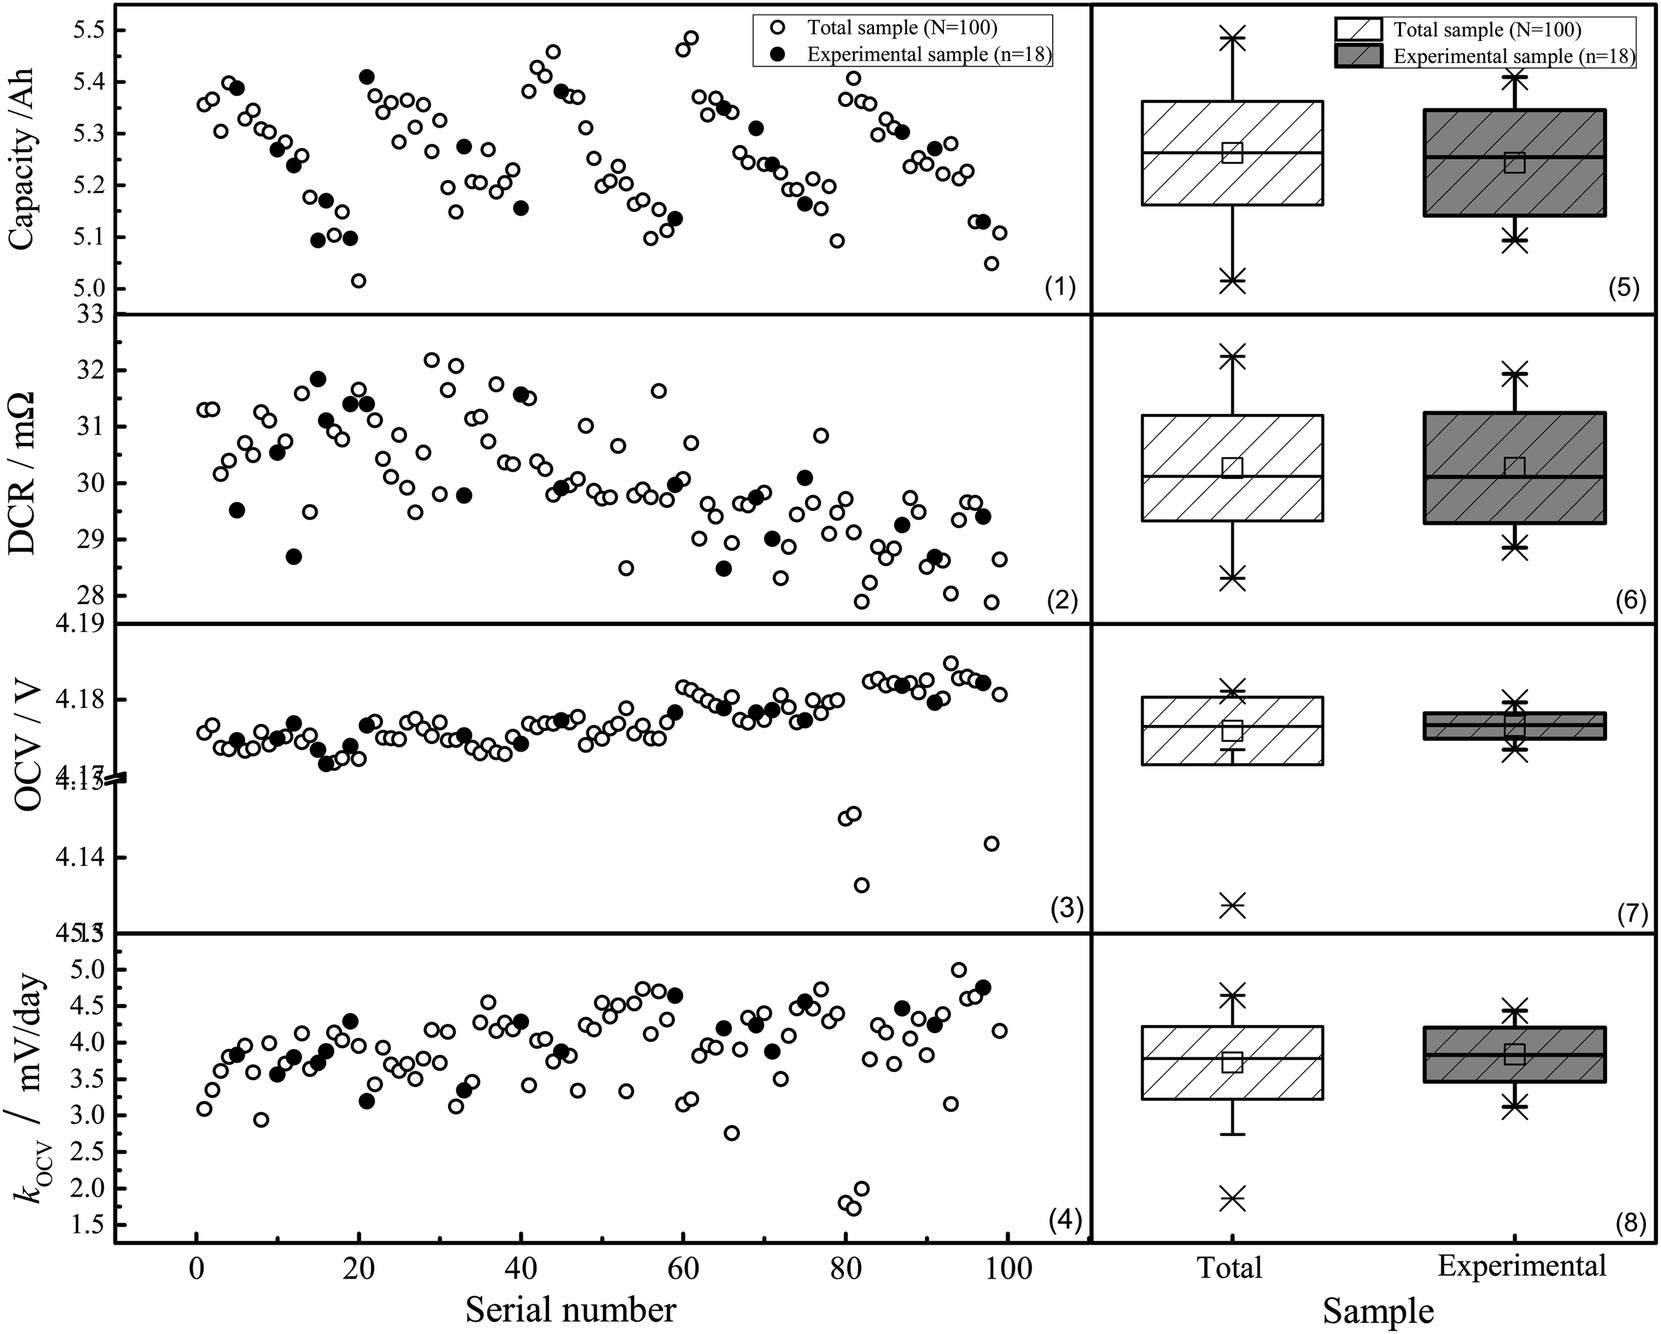 | ||
| Fig. 4 Description of sample features. Scatter graphs on the left show the following sample features: (1) capacity, (2) DCR, (3) OCV, and (4) kOCV, while the Box–Whisker plots on the right show the elementary statistics of the features: (5) capacity, (6) DCR, (7) OCV, and (8) kOCV. Hollow circles in the left-hand panels and white boxes in the right-hand panels represent the data of the total sample, while black circles and gray boxes represent the statistical data of the experimental sample. | ||
As shown in Fig. 5, for further statistical analysis of the normal distribution sample, histograms were constructed for the initial features of the total and experimental samples from the data shown in Table S1 (listed in the ESI†). Experimental samples were selected from the majority of bins of the total sample, rather than from a select few.
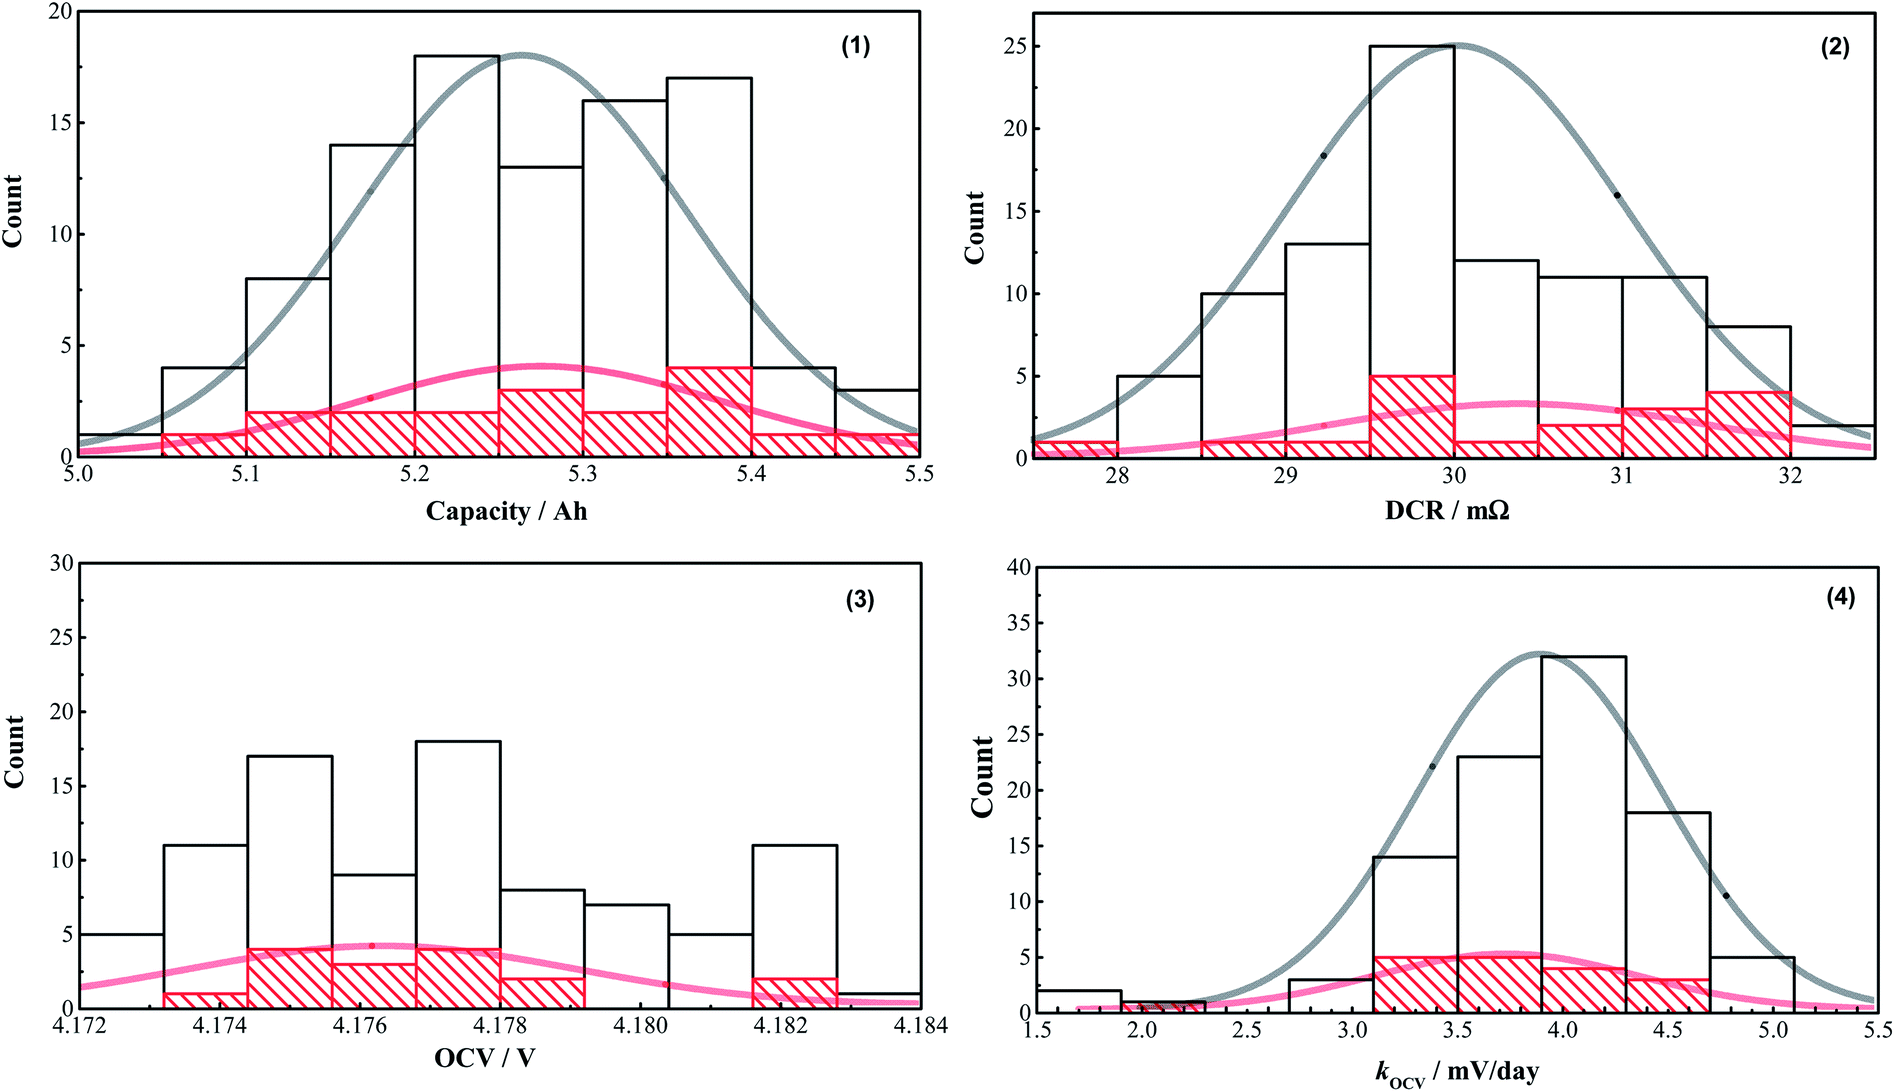 | ||
| Fig. 5 Histograms of the initial sample features. Unshaded and shaded (red) histograms represent the descriptive features of 100 and 18 cells, respectively. Gray and red curves represent the distribution of: (1) capacity, (2) DCR, (3) OCV, and (4) kOCV. | ||
However, there was a concern that marginal differences were observed with respect to the means or standard deviations between the total and experimental samples. Therefore, the Shapiro–Wilk test was employed to determine whether a normal distribution existed.15 Shapiro–Wilk is a test of normality, where the sample size is less than 50. As shown in Table S1,† with the exception of the OCV value of the total samples, the probability (P) value was greater than the significance level of α = 0.05, while all coefficients of the Wilk test (W) values were close to 1. Hence, all features of the total and experimental samples exhibit a normal distribution, with the exception of OCV. Therefore, according to the central limit theorem, 18 cells are sufficient for analysis.
According to the responses for the orthogonal array L9 (34) for four factors at three levels, based on the DOE theory, 9 blocks were employed to investigate the relationship between the variation of the cells and the durability of the assembled blocks.
3.3 Cycle performance and CTCVs of the blocks
In order to avoid any other inherent interference (i.e. electrolyte mass-consumption) in a long-term cycle test at higher temperature, we carried out the cycle test in relatively short cycles to study the variation of the component cells. Fig. 6 shows the cycle performance of the blocks at 1C and at 55 °C. In addition, the capacity was calibrated for each of the 50 cycles at 25 °C.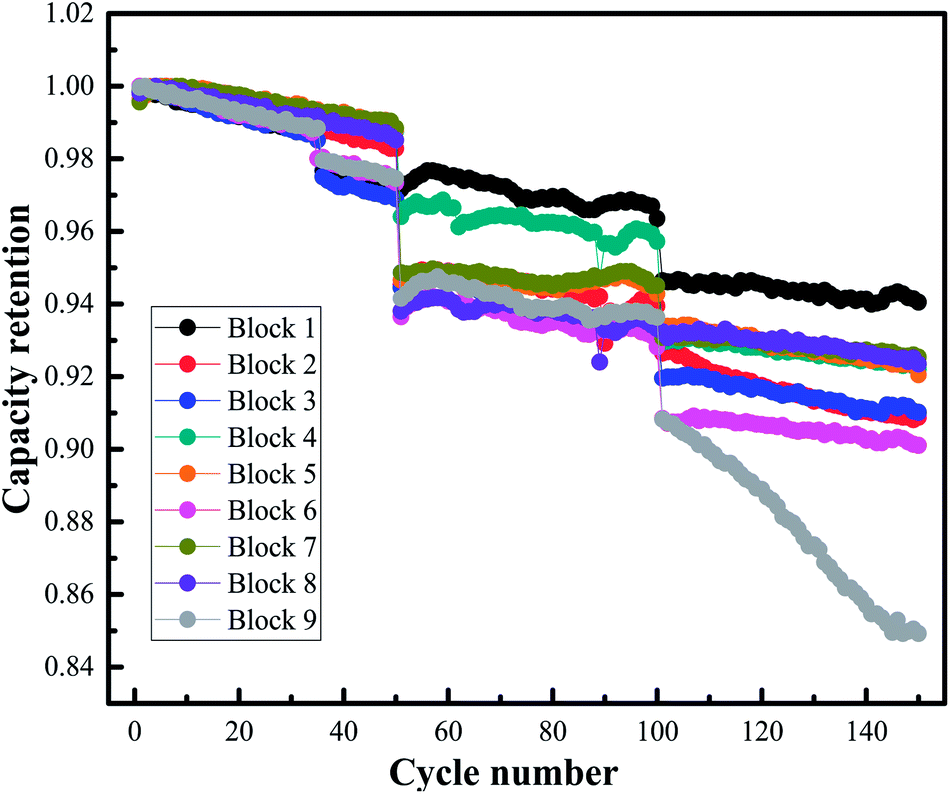 | ||
| Fig. 6 Dependence of the discharge capacity retention of the blocks on accelerated aging. | ||
Following each set of 50 cycles, the blocks were disassembled into cells, and the capacity, DCR, OCV, and kOCV of the cells were tested, as shown in Fig. 7. Unfortunately, no clear trends were observed over the whole aging process. However, by comparison of the means or medians of the features, which are plotted as hollow squares or lines in Fig. 7 parts 5–9, the overall trends were clearly observed. Hence, the preliminary results suggested that with an increase in the number of cycles, a decrease in capacity and an increase in DCR were observed for the overall charge–discharge process. In addition, following the initial 50 cycles, where the OCV and kOCV sharply increased and decreased, respectively, no significant changes were observed (i.e., between 50 and 150 cycles).
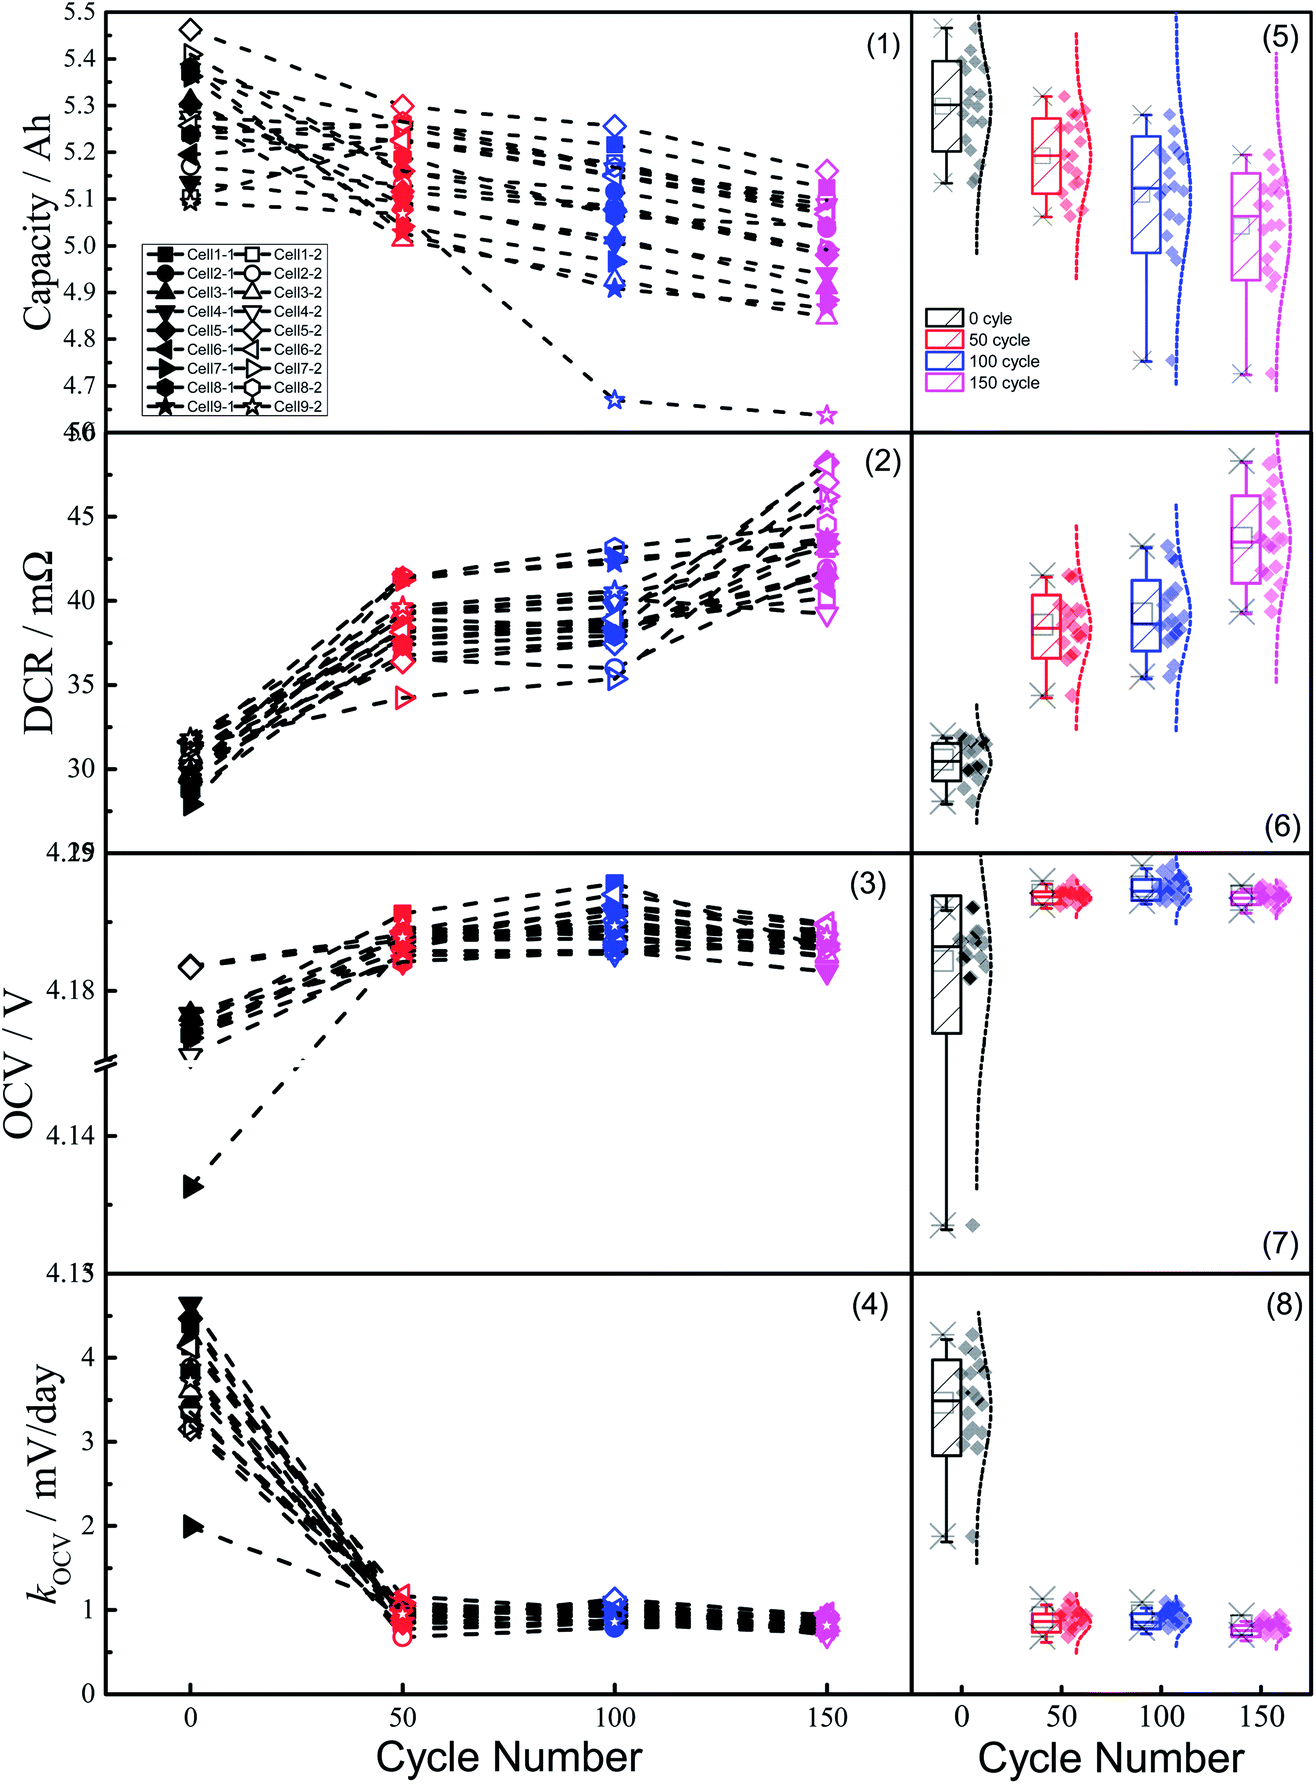 | ||
| Fig. 7 Features of cells in 2P blocks during aging. Left-hand plots indicate variation in the features with increasing cycle number: (1) capacity, (2) DCR, (3) OCV, and (4) kOCV, where the symbols and colors represent blocks and cycles, respectively. The right-hand Box–Whisker plots show the elementary statistics of the changing features with cycle number: (5) capacity, (6) DCR, (7) OCV, and (8) kOCV. | ||
In addition, Fig. 8 shows the extent of variation in cell characteristics in each block with number of cycles. Due to the complicated relationship between the various features and the cycle numbers, it was difficult to assign simple trends. Furthermore, the different tendencies could not be simply determined using one level of initial variation, as the trend was different among blocks exhibiting the same level of variation. Thus, one-factor-at-a-time (OFAT) analysis was not suitable to determine the relationship between the initial variation and the capacity retention. As shown in Fig. 8 parts 5–8, the extent of variation in the DCR sharply decreased after 100 cycles, while that of kOCV decreased earlier (i.e., before 100 cycles had been completed).
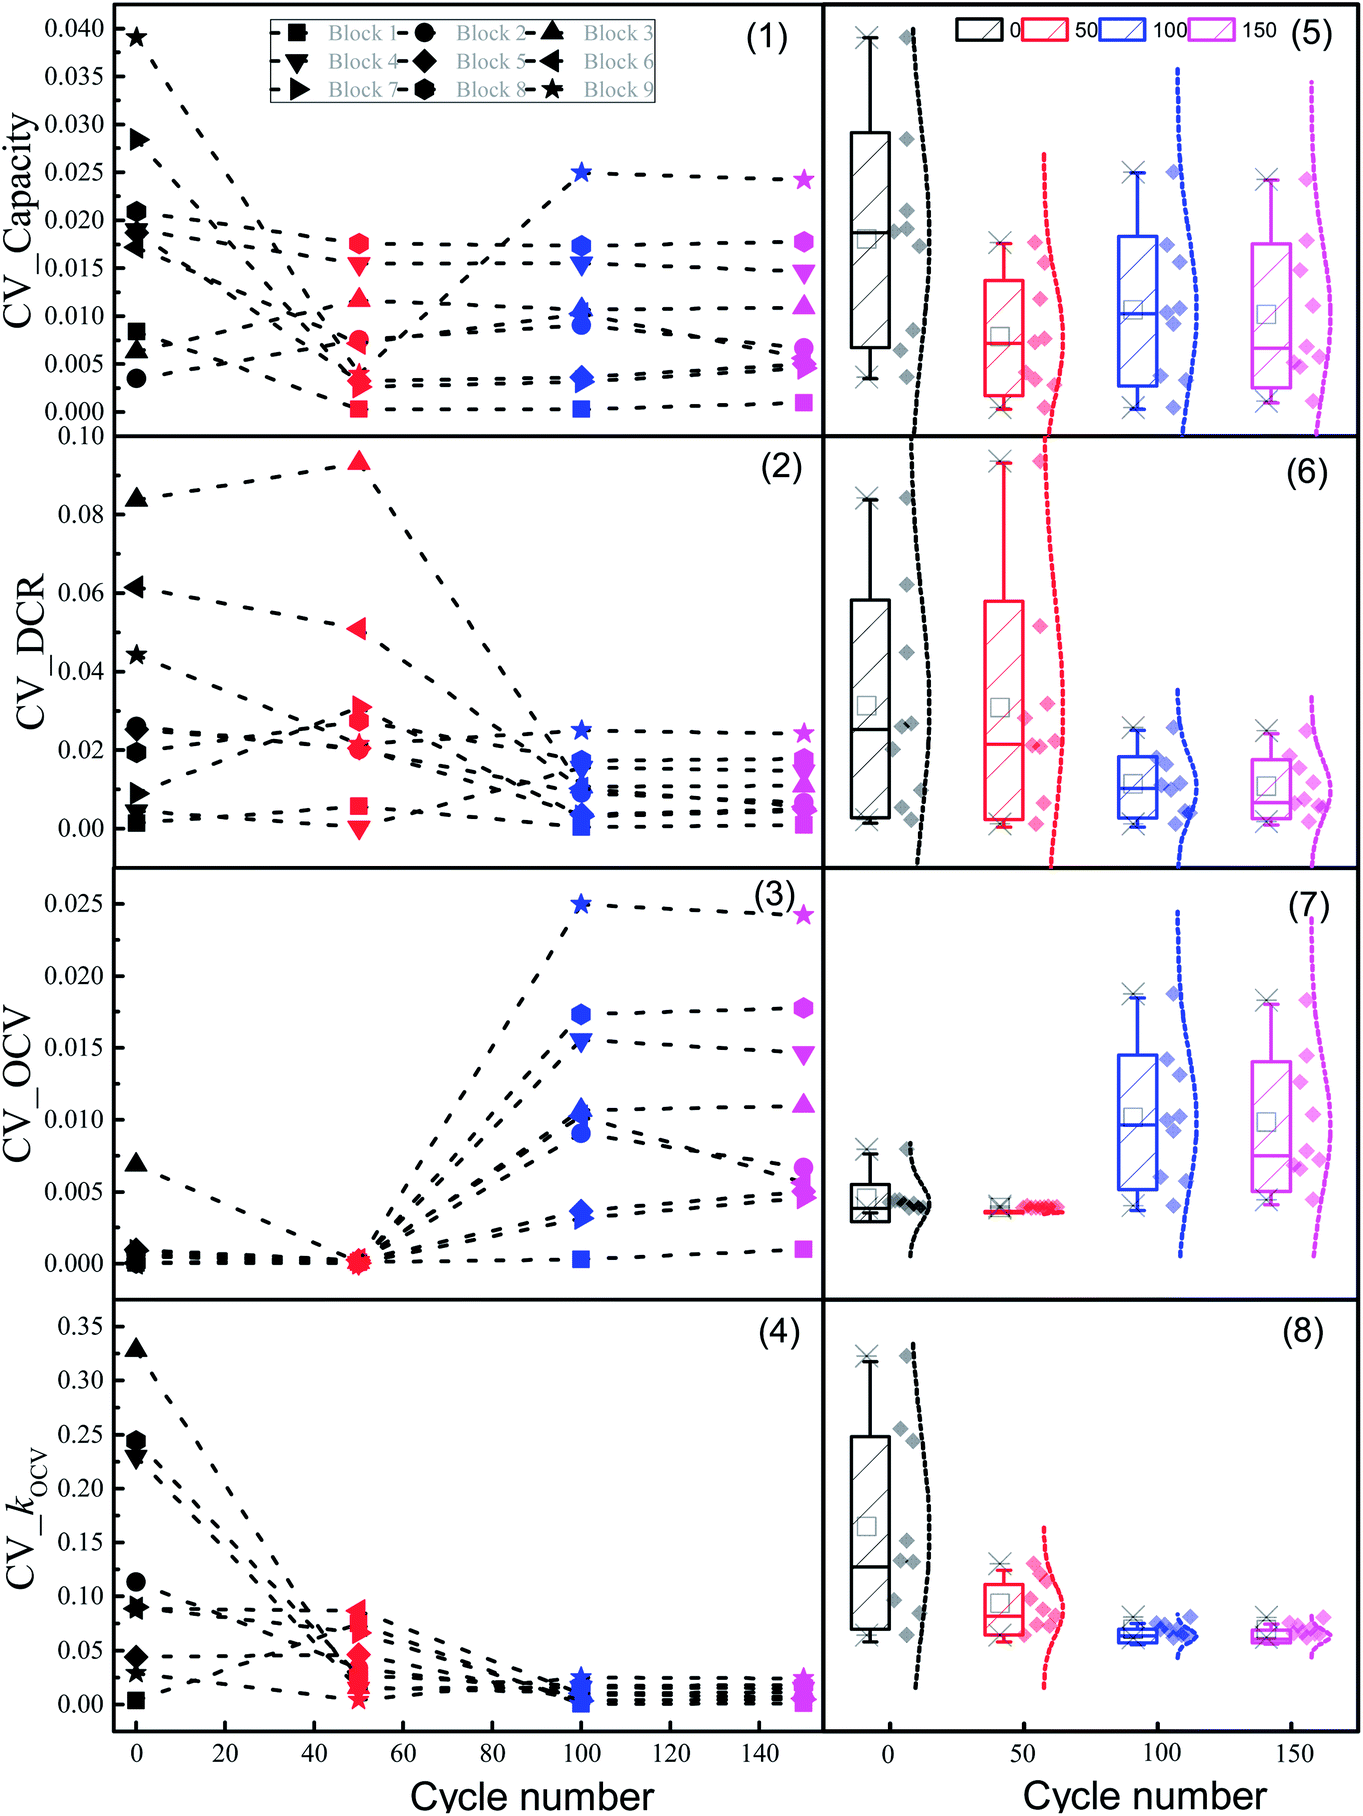 | ||
| Fig. 8 Variations of the component cells in 2P blocks during aging. Left-hand plots show the extent of variation of the features with cycle number: (1) capacity, (2) DCR, (3) OCV, and (4) kOCV, where the various symbols and colors represent blocks and cycles, respectively. The right-hand Box–Whisker plots show elementary statistics of the extent of feature variation with cycle number: (5) capacity, (6) DCR, (7) OCV, and (8) kOCV. | ||
Indeed, the overall trend was so complex that the relationship between the initial variation of features and the capacity retention by OFAT analysis could not be obtained. Nevertheless, conclusions could be made using statistical analysis.
3.4 Statistical analysis of the cell variation effect
The effects of the four controlling factors (i.e., CV_Capacity, CV_DCR, CV_OCV, and CV_kOCV) on the three responses (CR50, CR100, CR150) were analyzed using ordinary linear regression.Fig. 9 shows the leverage plots of the relationships between the variation of features and capacity retention, which indicate the main effects of the factors on the responses. The black circles, dashed blue lines, solid red lines, and dashed red lines represent the data points, means, linear fitting curves, and significance curves at α = 0.05, respectively. All bands in the significance curves of CV_kOCV, CV_DCR, and CV_OCV at α = 0.05 passed through the mean lines, indicating that they exhibit a significant effect on the responses.16 In contrast, other effects appeared less significant, as neither the bands themselves nor their extrapolated lines could be approximated to or passed through the lines. The lines were therefore encompassed in the bands. Furthermore, CV_kOCV exhibited a positive effect on CR, CV_DCR, and CV_OCV, while exhibiting both negative and positive effects on CR50.
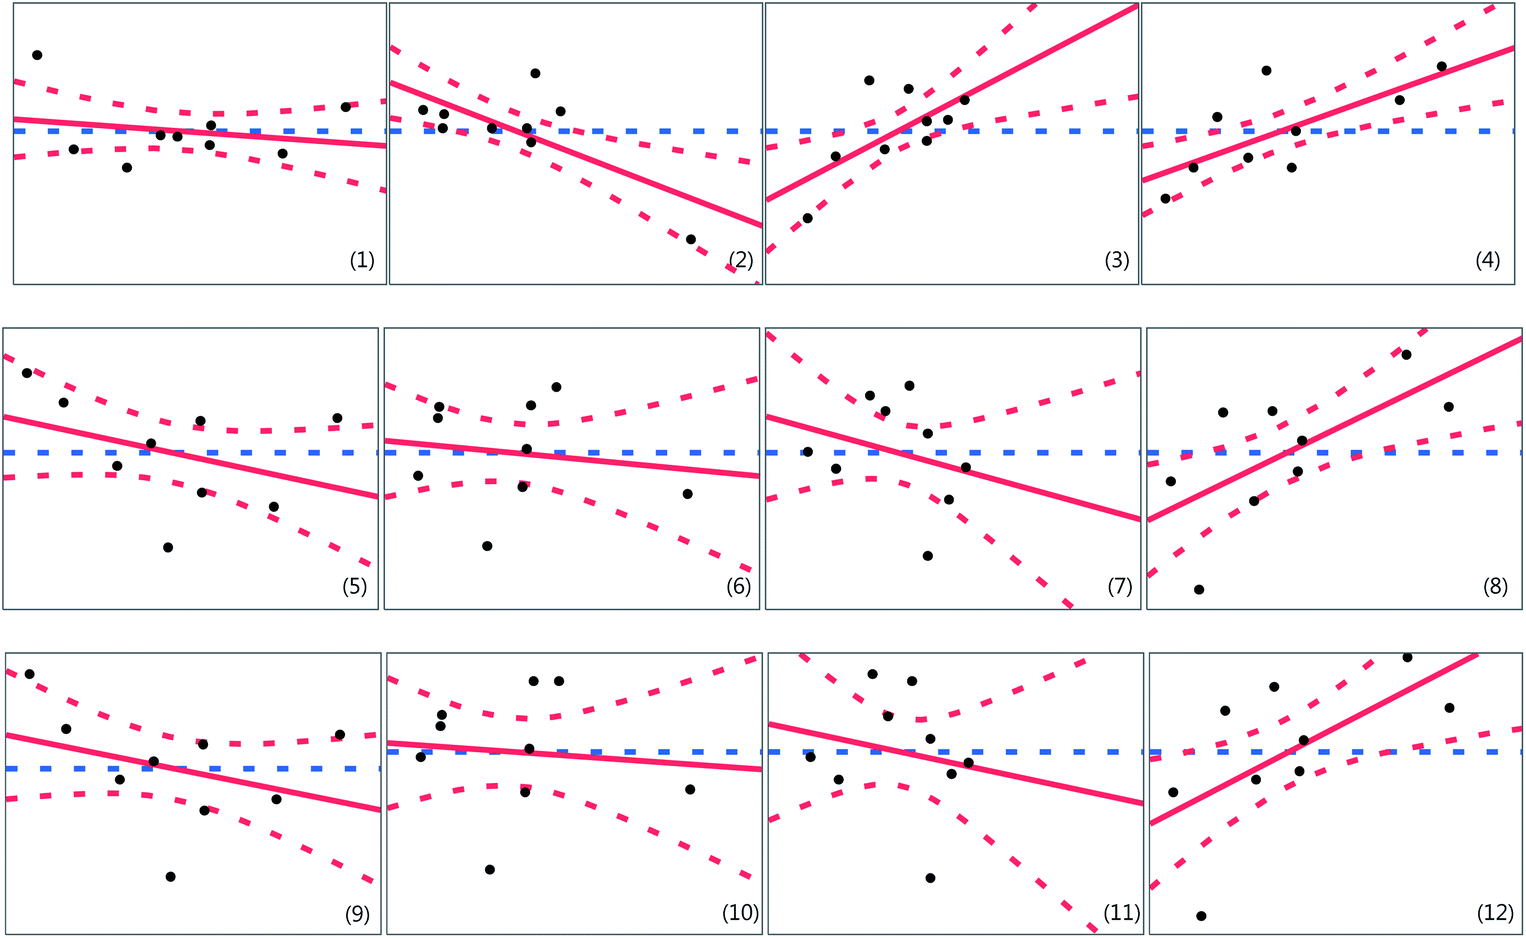 | ||
| Fig. 9 Leverage plots for the relationships between the variation of features and capacity retention based on ordinary linear regression. (1) CV_Capacity vs. CR50, (2) CV_DCR vs. CR50, (3) CV_OCV vs. CR50, (4) CV_kOCV vs. CR50, (5) CV_Capacity vs. CR100, (6) CV_DCR vs. CR100, (7) CV_OCV vs. CR100, (8) CV_kOCV vs. CR100, (9) CV_Capacity vs. CR150, (10) CV_DCR vs. CR150, (11) CV_OCV vs. CR150, and (12) CV_kOCV vs. CR150. The black circles, dashed blue lines, solid red lines, and dashed red lines represent the data points, means, linear fitting curves, and significance curves at α = 0.05, respectively. | ||
In practice, a cell-sorting method incorporating all controlling factors can’t be employed. Hence, a number of critical factors must be selected to establish the relationship between the responses based on correlation analysis. As shown in Table S2 (see ESI†), moderate correlations were observed in the pairs of CV_OCV versus CV_DCR, CV_OCV, and CV_kOCV; however, some minor correlations were also observed for other pairs. Such multi-collinearity among the various factors resulted in a complex model where ordinary linear regression based on the standard least-squares method was adopted.
Thus, step-wise regression, which can reduce the number of factors, was employed to determine the most critical controlling factors, such that the factors in the final model were significantly critical to the responses, resulting in minimal multi-collinearity.17 The criterion for preventing step-wise regression is the minimum Bayesian information criterion (BIC), as shown in eqn (7):
BIC = −2![[thin space (1/6-em)]](https://www.rsc.org/images/entities/char_2009.gif) logLikelihood + kln(n) logLikelihood + kln(n)
| (7) |
To obtain a relatively valuable statistical model, the t-test and the F-test were carried out. The t-test and the F-test are respectively a significance test for every explanatory factor and the regression equation itself in the statistical model. If the probability of P > F or |t| is less than 0.10, the explanatory factors and their coefficients all have statistical significance. Table S3 (see ESI†) shows the results obtained from the t-test and the F-test. Three critical features (i.e., CV_DCR, CV_OCV, and CV_kOCV) for CR50 and only one critical feature (i.e., CV_kOCV) for CR100 and CR150 were observed. All effects on the responses are still marginally significant in this model, which is attributed to their P-value being less than the significance level at α = 0.1.18 However, no significant relationship was observed between the initial CV_Capacity and the CR of the model, due to the P-value being greater than the significance level at α = 0.1. Hence, this simplified model was adopted to control the cell-sorting process, without any significant loss in accuracy being observed.
In addition, the adjusted R squared (adj-R2) value is a statistic to estimate the explanatory ability of the model based on multiple linear regression. The adj-R2 values of the model based on ordinary linear regression were 0.7574, 0.3929, and 0.3542 for CR50, CR100, and CR150, respectively. In terms of the model based on step-wise regression, the adj-R2 values were 0.7674, 0.3178, and 0.3604, respectively. Hence, prediction of the durability performance using the initial variation is not recommended as adj-R2 is l < 0.9; adj-R2 reveals the explanatory ability of the model, but it cannot explain the effect of each factor in the model. Thus, a number of factors continue to exert significant effects on capacity retention, which is sufficient to obtain superior blocks.
As a result, component cells with a large kOCV variation lead to a good block durability performance. However, explaining why a pair of component cells with a large kOCV variation resulted in a superior block with a large CR is difficult, and so the statistical model must be validated by testing a new sample.
3.5 Validation
In the production line, cells are typically divided into several bins based on critical factors. In this study, the total samples were divided into three levels (i.e., level 1, level 2, and level 3) based on the variation of kOCV. The sample was therefore divided into three bins, corresponding to the three levels, and then the relationship between the capacity retention of the blocks and the level of CV_kOCV was analyzed.Thus, 12 cells were randomly selected to assemble six blocks to verify the relationship between the level of CV_kOCV and CR100 (or CR150). Standard regression was employed to ensure that an appropriate sample was used based on the statistical model. As shown in Fig. 10, a linear relationship was observed between the level of CV_kOCV and CR100 (or CR150), indicating that the CR value increased with an increase in CV_kOCV. The conclusions of the statistical model were then verified.
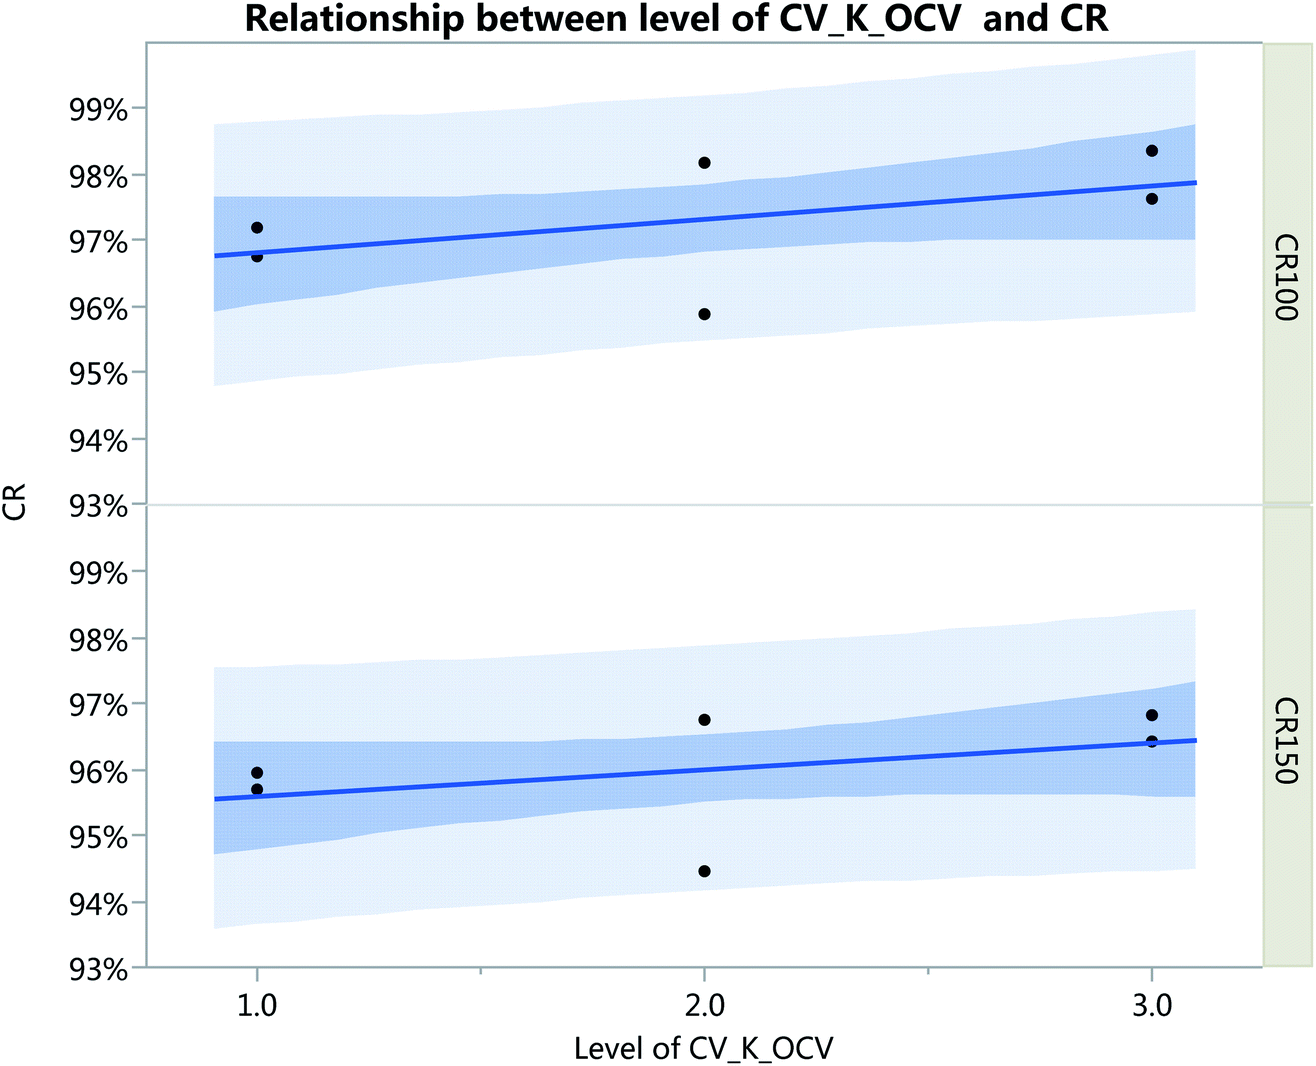 | ||
| Fig. 10 Relationship between the level of CV_kOCV and CR. The line is the linear fit of the data, while the dark and light blue bands correspond to the confidence interval and the prediction interval of the data, respectively, based on the fitting. | ||
One-way analysis of variance (ANOVA) is a very important statistical analysis, widely used in the significance test of several means of samples.19 According to the ANOVA results of comparative experiments, different samples could be obtained, which exhibit remarkable differences in CR. The least significant difference (LSD) threshold matrix was employed to determine the difference in the samples, the elements of which can be calculated by the difference between the absolute value of the means and the LSD of the two samples, as outlined in eqn (8):13
 | (8) |
Fig. 11 shows a visual representation of the one-way ANOVA based on the modeling and validation data set; the three diamonds shown on the left of each plot are similar to the box plots in statistics, indicating the CR statistical values decided for the three levels.
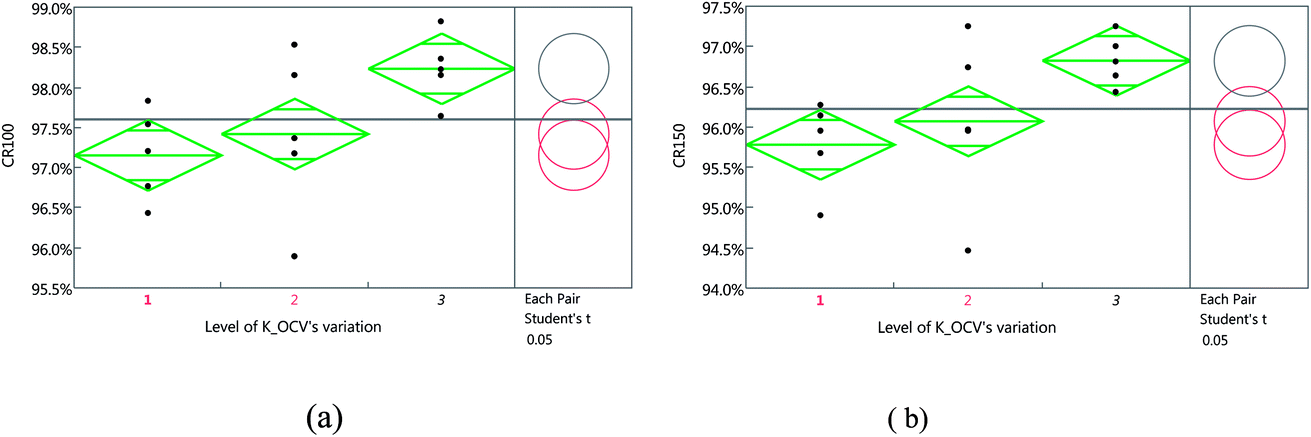 | ||
| Fig. 11 One-way ANOVA diagram of CRi versus the CV_kOCV level, based on the modeling and validation data set: (a) diagram of CR100 versus the CV_kOCV level; and (b) diagram of CR150 versus the CV_kOCV level. | ||
Furthermore, negative elements in the LSD threshold matrix indicated that there was no significant difference between the samples, while positive elements indicated the opposite. Thus, as shown in Table S4 (see ESI†), no significant difference was observed between the samples with level 1 and 2 CV_kOCV values, although other differences between pairs of levels were significant.
In addition, the right-hand segments of the two plots in Fig. 10 show the transformation of the left-hand plot according to each pair. Student’s t test is a significantly more visual graphic for analysis, and allowed different mean values between the samples to be obtained, in addition to identifying two samples with significant differences in responses.
Finally, from Fig. 11, the angle of intersection between comparison circles 1 and 2 was found to exceed 90°, indicating that no significant difference exists between the mean values of CR100 (or CR150) determined by the two levels.20 However, the angles of intersection between the other circles were <90°, revealing significant differences between the mean values. Compared with sample 1 (i.e., low CV_kOCV), sample 2 (i.e., high CV_kOCV) exhibited an improved durability performance of the blocks when compared with that with intermediate values of CV_kOCV. In contrast, no statistical difference was observed in terms of obtaining superior blocks from samples 1 or 2.
4. Conclusions
We have studied the variation of capacity, direct current resistance (DCR), open-circuit voltage (OCV), and self-discharge rate (kOCV) in the initial and aged states, and analyzed the sequence of their variation effects on the cycle life of 2 parallel blocks. We conclude that the initial variation of the self-discharge rate is a particularly critical factor which significantly affects the durability of the assembled blocks. Indeed, less variation in durability originated from the component cells exhibiting a large variation in self-discharge rate, although a reduction in durability was observed only in the case of significantly increased variation in kOCV. Thus, according to cell sorting based on the criterion of kOCV variation rather than capacity alone, such variations could lead to blocks exhibiting improved durability.Notes: this conclusion has some differences to previous reports: the smaller the variation, the better the performance. However, the conclusion was verified with other samples. We point out that this conclusion is right for this kind of cell, but we should do similar experiments for other kinds of LIC.
Conflicts of interest
There are no conflicts to declare.Glossary
| OCV | Open-circuit voltage |
| DCR | Direct current resistance |
| kOCV | Self-discharge rate of cells |
| CtCV | Cell to cell variation |
| CC–CV | Constant current–constant voltage charging protocol |
| CR | Capacity retention of aged block |
| CR50 | Capacity retention of aged block at the 50th cycle |
| CR100 | Capacity retention of aged block at the 100th cycle |
| CR150 | Capacity retention of aged block at the 150th cycle |
| CV_Capacity | Variation of component cells with capacity |
| CV_DCR | Variation of component cells with DCR |
| CV_OCV | Variation of component cells with OCV |
| CV_kOCV | Variation of component cells with kOCV |
| CV | Coefficient of variation, quantitative expression of variation |
| R | The correlation coefficient |
| OFAT | One-factor-at-a-time analysis |
| BIC | Bayesian information criterion |
| adj-R2 | The adjusted R squared values of the model |
| P | Probability |
| F | Statistic of the F-test |
| |t| | Statistic of the two-sided t-test |
| ANOVA | Analysis of variance |
| LSD | The least significant difference threshold matrix |
Acknowledgements
This work was supported by the China Postdoctoral Science Foundation under the grant number 2018M631335 and also supported by the Fundamental Research Funds for the Central Universities under the grant number FRF-TP-18-024A1.References
- S. Prakash, W. E. Mustain and P. A. Kohl, Performance of Li-ion secondary batteries in low power, hybrid power supplies, J. Power Sources, 2009, 189, 1184–1189 CrossRef.
- J. B. Goodenough and Y. Kim, Challenges for rechargeable batteries, J. Power Sources, 2011, 196, 6688–6694 CrossRef.
- F. Q. An, J. Huang, J. B. Zhang and P. Li, Cell sorting for parallel lithium-ion battery systems: evaluation based on an electric circuit model, J. Energy Storage, 2016, 6, 195–203 CrossRef.
- M. Dubarry, N. Vuillaume and B. Y. Liaw, Origins and accommodation of cell variations in Li-ion battery pack modeling, Int. J. Energy Res., 2009, 34, 216–231 CrossRef.
- S. Santhanagopalan and R. E. White, Quantifying Cell-to-Cell Variations in Lithium Ion Batteries, Int. J. Electrochem., 2012, 2012, 1–10 CrossRef.
- R. Gogoana, M. B. Pinson, M. Z. Bazant and S. E. Sarma, Internal resistance matching for parallel-connected lithium-ion cells and impacts on battery pack cycle life, J. Power Sources, 2014, 252, 8–13 CrossRef.
- T. Bruen and J. Marco, Modelling and experimental evaluation of parallel connected lithium ion cells for an electric vehicle battery system, J. Power Sources, 2016, 310, 91–101 CrossRef.
- B. Thorsten, B. Manuel and R. Susanne, et al., Production caused variation in capacity aging trend and correlation to initial cell performance, J. Power Sources, 2014, 247, 332–338 CrossRef.
- X. Han, M. Ouyang, L. Lu and J. Li, A comparative study of commercial lithium ion battery cycle life in electric vehicle: capacity loss estimation, J. Power Sources, 2014, 268, 658–669 CrossRef.
- B. Kenney, K. Darcovich, D. D. MacNeil and I. J. Davidson, Modelling the impact of variations in electrode manufacturing on lithium-ion battery modules, J. Power Sources, 2012, 213, 391–401 CrossRef.
- Y. Zheng, M. Ouyang and L. Lu, et al., Cell state-of-charge inconsistency estimation for LiFPO4 battery pack in hybrid electric vehicles using mean-difference model, Appl. Energy, 2013, 111, 571–580 CrossRef.
- J. P. Schmidt, A. Weber and E. Ivers-Tiffée, A novel and fast method of characterizing the self-discharge behavior of lithium-ion cells using a pulse-measurement technique, J. Power Sources, 2015, 274, 1231–1238 CrossRef.
- N. J. Salkind, Encyclopedia of Research Design, Sage Publications Ltd, 2010, vol. 135, pp. 105–106 Search PubMed.
- R. F. Ling, Residuals and Influence in Regression, Chapman and Hall, 1982 Search PubMed.
- A. Ghasemi and S. Zahediasl, Normality tests for statistical analysis: a guide for non-statisticians, Int. J. Endocrinol. Metabol., 2012, 10, 604–610 CrossRef PubMed.
- J. Sall, Leverage Plots for General Linear Hypotheses, Am. Statistician, 1990, 44, 308–315 Search PubMed.
- B. G. Tabachnick and L. S. Fidell, Using multivariate statistics, Allyn and Bacon, 2001 Search PubMed.
- L. Pritschet, D. Powell and Z. Horne, Marginally Significant Effects as Evidence for Hypotheses Changing Attitudes Over Four Decades, Psychol. Sci., 2016, 27(7), 1036 CrossRef PubMed.
- S. J. Amster, Beyond ANOVA, Basics of Applied Statistics, Wiley, 1986 Search PubMed.
- H. Rushing, J. Wisnowski and A. Karl, Design and Analysis of Experiments by Douglas Montgomery: A Supplement for Using JMP, SAS Institute Inc., 2013 Search PubMed.
Footnote |
| † Electronic supplementary information (ESI) available. See DOI: 10.1039/c8ra05403g |
| This journal is © The Royal Society of Chemistry 2018 |