 Open Access Article
Synthesis, characterization and osteogenesis of phosphorylated methacrylamide chitosan hydrogels
Huishang Yang†
b,
Shenggui Chen† b,
Lei Liub,
Chen Laia and
Xuetao Shi
 *b
*b
aPeking University Shenzhen Institute, Peking University, Shenzhen, China
bNational Engineering Research Centre for Tissue Restoration and Reconstruction, School of Material Science and Engineering, South China University of Technology, Guangzhou, 510640, P. R. China. E-mail: shxt@scut.edu.cn
First published on 25th October 2018
Abstract
Phosphorylated biopolymers can induce mineralization, mimic the process of natural bone formation, and have the potential as scaffolds for bone tissue engineering. 2-Methacryloyloxyethyl phosphorylcholine (MPC), a low cytotoxicity phosphorus source, is mainly applied in vascularization and promoting blood compatibility and has been less researched for bone repair. In this study, phosphorylated methacrylamide chitosan (PMAC) hydrogel was prepared by mixing methacrylamide chitosan (MAC) and different mass of MPC with photoinitiator under UV irradiation. A series characterization tests showed that PMAC hydrogels were successful prepared and had a pretty good mineralization ability. Moreover, human fetal osteoblastic (hFOB) cells cultured on PMAC hydrogels exhibited not only highly viability but also the enhanced ALP activity and calcium deposition. The PMAC hydrogels have great potential in bone tissue engineering applications.
1 Introduction
Bone tissue consists of two parts: organic phase, including collagen and amorphous matrix, and inorganic phase, dominated by calcium phosphate. The basic structure unit of bone is mineralized collagen fibers.1 Although biomineralization mechanisms remains controversial,2 phosphate groups are proved to play a significant role in regulating cell, proliferation and signal transduction pathways3–6 and assisting and modulating calcification.7–11Phosphorylated biopolymers can induce mineralization, mimic the process of natural bone formation, and have the potential as scaffolds for bone repair applications.12–18 The encapsulation of human mesenchymal stem cells (hMSCs) in phosphate-modified polyethylene glycol hydrogels showed that cytoactive increased from 15% to 97%, the material mineralization rate and final mineralization degree were also improved.19 Without the osteoinductive factor, the osteogenic differentiation of hMSCs on phosphorylated polyethylene glycol (PEG) hydrogel material suggested that osteogenic differentiation was caused by the presence of a small molecule of phosphate groups.20 By mimicking the role of phosphate groups in native tissues and encouraging tissue formation, phosphate-containing polymers have been implemented to accelerate osteogenic differentiation and the formation of bone tissue.21–27 There are generally two kinds of reagents used in the synthesis of phosphorylated biopolymers: skeleton phosphorylation and side group phosphorylation. Skeleton phosphorylation biopolymers are polymers themselves so they are not suitable to modify other polymeric materials. Side group phosphorylation biopolymers are mostly cytotoxic, oil-soluble, poor biological functionality and may not be suitable to be modified into biopolymer materials because of their toxic degradation products. Therefore, the key to the preparation of phosphorylated hydrogels is to find phosphorus sources with low cytotoxicity. 2-Methacryloyloxyethyl phosphorylcholine (MPC), a low cytotoxicity phosphorus source, is mainly applied in vascularization and promoting blood compatibility28,29 and has less been researched for bone repair.
In this study, methacrylamide chitosan (MAC) was prepared by reaction of chitosan and methacrylic anhydride (MA) to graft carbon–carbon double bonds of methacrylic anhydride onto amino groups of chitosan, which provide the reaction point for the subsequent crosslinking reaction.30 Then MAC was reacted with 2-methacryloyloxyethyl phosphorylcholine (PMAC) with different mass fraction and photo-crosslinked by adding photoinitiator under UV irradiation to prepare phosphorylated methacrylamide chitosan (PMAC) hydrogels. Human fetal osteoblastic (hFOB) cells were cultured on the materials to evaluate biocompatibility and osteogenesis.
2 Materials and method
2.1 Materials
Methacrylic anhydride, 2-hydroxy-4′-(2-hydroxyethoxy)-2-methylpropiophenone (Irgacure 2959), alizarin red S and sodium dodecyl sulfate (SDS) were purchased from Sigma-Aldrich (USA). Chitosan (CS, viscosity average molecular weigh: 47 × 104 g mol−1, degree of deacetylation >95%) was purchased from Aladdin (China). Dulbecco's modified Eagle's medium (DMEM)/F12 (DMEM-F12), phosphate-buffered saline (PBS), trypsin–EDTA, and foetal bovine serum (FBS) were obtained from Gibco (USA).2.2 Preparation of MAC
A 1 wt% solution of chitosan was prepared by dissolving 1 g of chitosan (μ = 200–400 mPa s) in 99 mL deionized water, and then 1 mL acetic acid was added into the solution with constant string. 4 mL of methacrylic anhydride was added into the solution and stirred overnight at room temperature. Several dialysis bags were filled with 1/3–1/2 the solution and were put in deionized water for about 5 days with the water changed three times a day. Then the solution was transferred into glass culture dishes and lyophilized.2.3 Preparation of PMAC hydrogels
Three different mass fraction PMAC hydrogels were prepared. Briefly, a 1 wt% solution of MAC was prepared by totally dissolved in deionized water with constant string. Different mass fraction MPC and 1 wt% cytocompatible photo-initiator Irgacure 2959 were added into the solution separately.13,20 The mixture was transferred into 48-well plate with 250 μL each hole by pipette. The plate was placed in ultrasonic cleaning machine for 10 minutes with 70% power to remove the air bubble. Then the plate was placed under UV-irradiation for 30 minutes to produce free radicals for irradiation and further initiate polymerization. The mass fraction ration of MAC/MPC was 1, 0.5 and 0.1 and named PMAC 1, PMAC 0.5 and PMAC 0.1, respectively. The PMAC hydrogels were immersed in deionized water to remove the unreacted monomer before characterization.12,18,262.4 Fourier transform infrared spectrometer (FITR)
The FITR (CCR-1, Thermo-Nicolet, USA) was collected between 400 and 4000 cm−1 with a resolution of 2 cm−1 and was used to compare the structure differences among pure CS, MAC and different mass fraction of PMAC according to a modified published procedure.2.5 1H NMR and 31P NMR spectrometer
1H NMR and 31P NMR were used to confirm the structure composition of CS, MAC and PMAC according to a modified published procedure.31 1H and 31P NMR spectra were obtained using a 400 MHz spectrometer (AVANCE Digital 400, Bruker, Germany). The samples were dissolved in D2O with 1% acetic acid-d4 to a concentration of 10 mg mL−1.2.6 Thermogravimetric analysis (TG)
TG was used to test the thermal stability of MAC and PMAC. Thermal stability of the synthesized materials was analysed in nitrogen atmosphere (20 mL min−1) using a synchronous thermal analyser (STA 449C, NETZSCH Scientific Instruments Trading, Germany). 5–10 mg of different lyophilized material was tested under an atmosphere of N2, with test temperature of 30–800 °C and heating rate of 10°C min−1.2.7 Swelling ratio
Swelling ratio is the ratio of the mass difference between the swelling gel and the xerogel after a certain time (formula (1)). The lyophilized hydrogels were immersed in deionized water and token out at the specific time points. The surface water of MAC and PMAC hydrogels was dried with filter paper and weighted. The test was stopped when the mass of material remained approximately the same. Wt and W0 refer to the mass of gel after water absorption and xerogel, respectively.
 | (1) |
2.8 Compression modulus
The compression modulus is usually determined by a slope of 10% or 15% from the stress–strain curve. The module with 10 mm diameter and 5 mm high was used to prepare the samples. Different mixture was slowly transferred into the module and the slides were used to cover the module, then the module was placed under UV-irradiation for 30 min. The samples were placed on the Universal Mechanical Tester platform (INSTRON 5967, INSTRON, America) and the upper contact plate was slowly controlled to get close to the sample. The parameter of compression rate was adjusted as 1 mm min−1. The test was stopped when the sample was compressed to 60%.2.9 Mineralization
2 × stimulated body fluid (SBF) was prepared by sequentially dissolving NaCl, NaHCO3, KCl, K2HPO4·3H2O, MgCl2·6H2O, CaCl2, and Na2SO4 in distilled deionized water at 37 °C. The MAC and PMAC hydrogels were incubated in 2 × SBF for 7 days, washed three times with deionized water, and then lyophilized. After coating the hydrogels with gold, they were examined by a tungsten filament scanning electron microscope (Thermo Fisher Scientific, USA) at an accelerating voltage of 10 kV.2.10 Cell culture
The hFOB cell line (CRL-11372, ATCC, USA) was maintained at 34 °C in DMEM-F12 containing 10% foetal bovine serum. The cells were cultured in a humidified atmosphere of 5% CO2 until confluency was achieved.2.11 Live/dead staining
The live/dead staining reagents PI and AM were used to prepare the original solution at 1![[thin space (1/6-em)]](https://www.rsc.org/images/entities/char_2009.gif) :
:![[thin space (1/6-em)]](https://www.rsc.org/images/entities/char_2009.gif) 3 volume ratio. Every 0.5 μL PI solution and 1.5 μL AM solution were added to 1 mL amicrobic PBS buffer to prepare the working solution. The complete medium in the well of the sample was sucked out and the well was washed with amicrobic PBS buffer twice. Then a certain volume of dye solution was added into the well and 48-well plate was covered with silver paper to avoid light under room temperature for 30–45 min. The inverted fluorescence microscope (T1-SM, Nikon, Japan) was used to observe the results.
3 volume ratio. Every 0.5 μL PI solution and 1.5 μL AM solution were added to 1 mL amicrobic PBS buffer to prepare the working solution. The complete medium in the well of the sample was sucked out and the well was washed with amicrobic PBS buffer twice. Then a certain volume of dye solution was added into the well and 48-well plate was covered with silver paper to avoid light under room temperature for 30–45 min. The inverted fluorescence microscope (T1-SM, Nikon, Japan) was used to observe the results.
2.12 Total protein content
The proliferation of hFOB cells cultured on the hydrogels were determined by total protein content. After1, 4 and 7 d of culture, the total proteins were extracted from the cells by lysing in RIPA buffer with a protease inhibitor cocktail (Beyotime Company, China). The protein concentration was determined by a bicinchoninic acid (BCA) protein assay kit (Beyotime).2.13 ALP activity
Alkaline phosphatase (ALP) activity was assayed with Alkaline Phosphatase Assay Kit (P0012S, Beyotime Company, China) according to the manufacturer's instructions. Briefly, cells were washed thrice with PBS and incubated with RIPA Lysis Buffer (P0013K, Beyotime Company, China) for 2 h in 4 °C after cultured for 1, 4 and 7 d. 50 μL lysate of each sample was incubated for 30 min at 37 °C in alkaline phosphatase buffer. The reaction was stopped by adding 100 μL reaction stop solution and absorbance was measured at 405 nm on multifunctional microplate reader. A calibration curve with different concentrations of p-nitrophenyl was prepared and ALP activity was normalized to the total protein content of each scaffold.2.14 Alizarin red S staining
Mineralization deposition of hFOB cells cultured on scaffolds was determined by alizarin red S Staining. After incubated for 3 and 7 days, cells with adherent mineralized nodules were removed from the scaffolds with trypsin–EDTA and washed with isotonic NaCl. Cells with mineralized nodules were then stained with alizarin red S for 2 min. After rinsed with ultrapure water to remove the nonspecific stain, the stained nodules were placed in a 96-well plate and observed using a microscopy. Subsequently, alizarin red S staining was extracted by sonicating for 10 min with 10 mM HCl in 70% ethanol. The extracts were then diluted with 5 volumes of PBS and measured at 550 nm in a multifunctional microplate reader.2.15 Statistical analysis
Values were shown as the means ± standard error of the mean. All statistical analyses were assessed by one-way or two-way variance (ANOVA). Differences were considered significant when p < 0.05.0.01 < *p < 0.05, 0.001 < **p < 0.01 and ***p < 0.001.3 Results and discussion
Chitosan is an excellent substrate material in bone tissue engineering, but the modification needs to be done because of the limitation of its physical and chemical properties. In this study, we prepared phosphorylated hydrogel materials by modifying chitosan. The reaction of chitosan with methacrylic anhydride was carried out to prepare methacrylamide chitosan (MAC). Methylallylic anhydride reacted with amino group of side chain of chitosan. Carbon and carbon double bond, which provided the reaction point for subsequent crosslinking reaction, was introduced into chitosan. The photocrosslinking of MAC with different mass fraction of MPC was carried out under the action of photoinitiator. The photoinitiator produced free radicals after irradiation and further initiated the polymerization to prepare PMAC hydrogel.3.1 Characterization of MAC
The synthesis process of MAC is shown in Fig. 1(a). FTIR and 1H NMR was used to compare the structure differences among CS and MAC. As shown in Fig. 1(b), 1613 cm−1 is the characteristic absorption peak of –NH2. Compared to CS, there is an obvious characteristic absorption peak of –NHCO– in 1560 cm−1 which mean the chitosan has been methacryloylated. As shown in Fig. 1(c), olefin double peak shows at 5.3 and 5.6 ppm. This means carbon–carbon double bonds of methacrylic anhydride has been successfully grafted on CS. The methacrylation degree of MAC was calculated by comparing the integrated area of H2–H6 peaks at 2.8 to 3.9 ppm to that of olefin double peak at 5.3 and 5.6 ppm.30 The methacrylation degree of MAC was 17% using this method.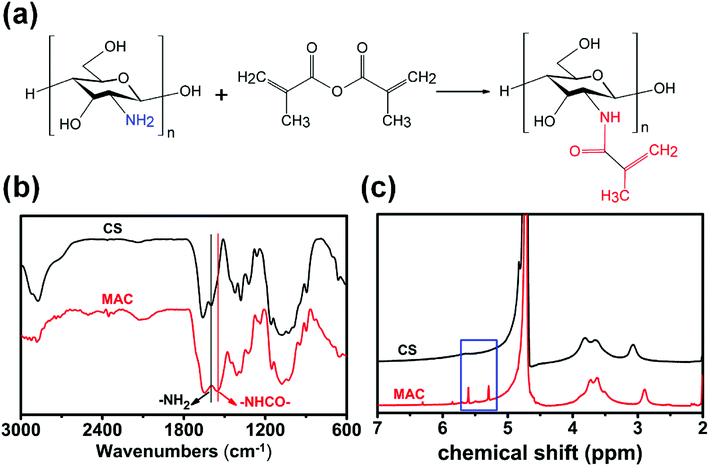 | ||
| Fig. 1 Synthetic schematic diagram and characterization of MAC. (a) The reaction route of MAC; (b) FTIR results of CS and MAC; (c) 1H NMR result of CS and MAC. | ||
3.2 Characterization of PMAC hydrogels
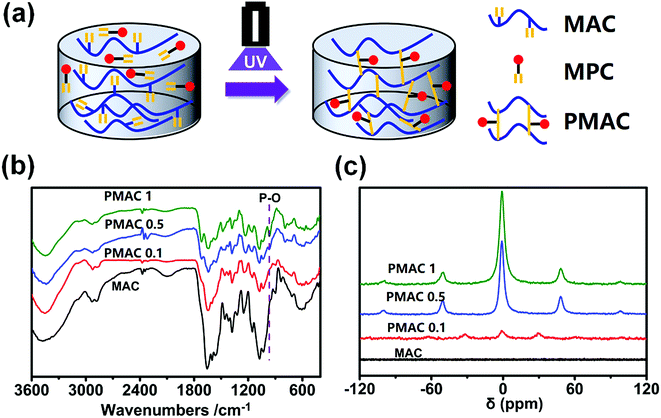
PMAC hydrogel was prepared as shown in Fig. 2(a). FTIR and 31P NMR was used to compare the structure of MAC and PMAC. In Fig. 2(b), there is an absorption peak of P–O in 1000 cm−1. In Fig. 3(c), 0 ppm means primary standard substance of 85% phosphoric acid. ±50 ppm and ±100 ppm show signal peaks of PMAC 1 and PMAC 0.5, ±30 ppm shows signal peaks of PMAC 0.1 and no signal peak of MAC. The signal peaks are sharper, wider and smoother as the higher mass fraction of MPC in samples. The above signal peaks prove that the PMAC has been successfully bonded with MAC.3.3 Properties of PMAC hydrogels
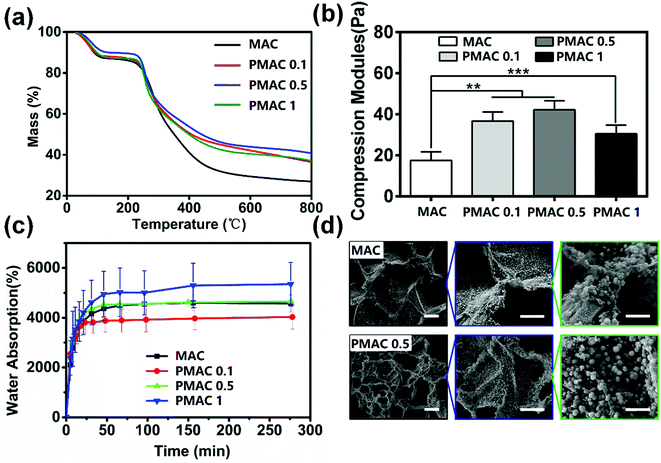
The TG curve of materials is divided into two parts as shown in Fig. 3(a). The first part is about 30–80 °C and four groups of materials lost weight due to the loss of absorbed water. In this part, weight loss of MAC, PMAC 1 and PMAC 0.1 are approximately 14%, weight loss of PMAC 0.5 is about 11%. The first stage of TG is material water loss, which contains absorbing water and bind water. PMAC 0.5 has lower weight loss, this may be due to its less absorbing water when it was tested in a drier environment while other three were tested in a rainy day. The second part is about 250–800 °C and materials lost weight due to the fracture and decomposition of the polymer chains. In this part, the weight loss is approximately 67% of MAC, approximately 51% of PMAC 1 and PMAC 0.1, and approximately 47% of PMAC 0.5. PMAC materials show a better thermal stability than MAC, yet PMAC 0.5 shows a less weight loss than the other two PMAC materials which could be due to the slightly stronger network structure formed by PMAC 0.5. In the second part of TG, PMAC groups decomposed more slowly than MAC and had more solid content in the end. These results indicated that grafting MPC could increase the hydrophilicity and the solubility of MAC, which could facilitate the processability of the material.To make the scaffold bear the mechanical properties of the originally damaged parts in human body, we increased the cross-linking density of the hydrogels with PMAC. The compression modulus of PMAC groups is significantly higher than that of MAC group as shown in Fig. 3(b). There are significant differences among MAC and PMAC groups. Compared with MAC group, the side chain structure of PMAC groups is more complex and the intermolecular connection is closer. Therefore, PMAC groups have better mechanical properties and stronger resistance to deformation.
The swelling ratio of four groups rose rapidly in initial stage and remained stable after about 65 min as shown in Fig. 3(c). Meanwhile, PMAC hydrogels showed a faster rate than MAC hydrogels in initial stage. The water absorption of MAC, PMAC 1, PMAC 0.5 and PMAC 0.1 is 4677%, 4089%, 4653% and 5610%, respectively. The MAC and PMAC hydrogels destroyed the intramolecular and intermolecular hydrogen bonds of CS, thus the hydrophilic property of the material was significantly improved. Compared to MAC, PMAC 0.1 contains phosphate groups which could form hydrogen bond with water, thus PMAC 0.1 group show higher water absorption than MAC. However, among three kinds of PMAC hydrogels, high concentration of MPC had a lower water absorption, this may be due to higher MPC dose had a more compact structure that reduced the water absorption of the material. The water absorption test indicated that MAC and PMAC groups had porous structures, which could also be determined in Fig. 3(d). Water absorption ability of our materials and porous structures created a proper environment for cell proliferation, which could be proved in Section 3.4.
Fig. 3(d) shows SEM images of MAC and PMAC 0.5 after incubation in 2 × SBF for 7 days. The calcium phosphate particles of MAC had irregular shapes with a diameter of about 1.7 μm. While calcium phosphate particles of PMAC 0.5 grew as microspheres with a diameter of about 2.5 μm. Meanwhile, the amount of calcium phosphate particle of PMAC 0.5 hydrogel was obviously more than that of MAC hydrogel. These results show that PMAC hydrogel could accelerate calcium phosphate formation.
3.4 Cell proliferation
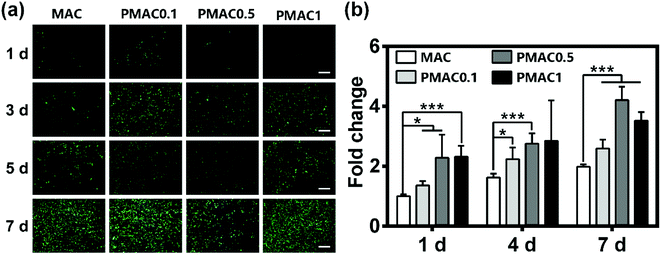
To evaluate the cytocompatibility of the hydrogels, live/dead staining and total protein content were performed. The phosphorous reagents and photoinitiators used in the preparation of MAC and PMAC hydrogels are low cytotoxic reagents. In Fig. 4(a), staining results of 1 d have few cells mainly because the cells are not enough when seeded. Nevertheless, the results of 3, 5 and 7 d show good biocompatibility of MAC and PMAC groups. BCA protein assay was used to determine the proliferation of hFOB cells cultured on the hydrogels. In Fig. 4(b), PMAC groups showed higher protein levels than MAC group. BCA of PMAC 0.5 and PMAC 1 were expressed at higher protein levels than PMAC 0.1, however PMAC 1 showed lower protein level at day 7 than PMAC 0.5. Fig. 4(b) indicated that PMAC groups have no negative effects on cell activity and proliferation and PMAC hydrogels had a better biocompatibility than that of MAC.3.5 Osteogenesis
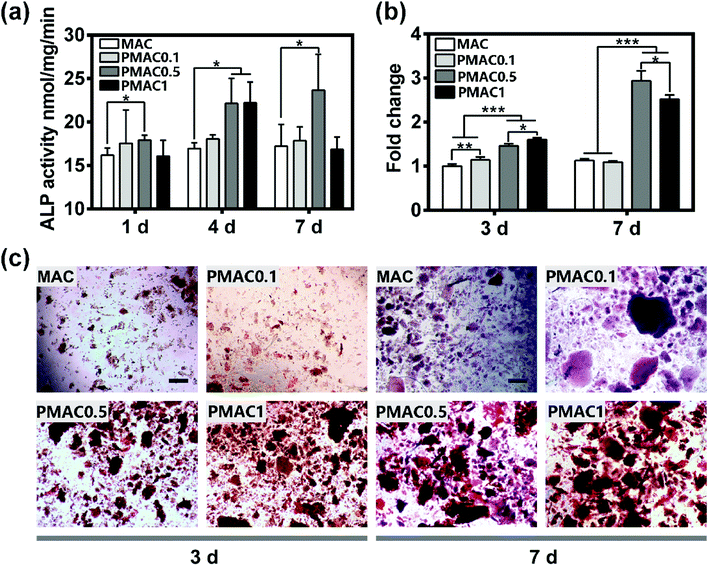
To investigate the effect of MAC and PMAC hydrogels on osteogenesis, the hFOB cells were cultured on the four groups, ALP was assessed at 1, 4, 7 days and alizarin red S staining were assessed at 3 and 7 days. The calcified areas stained with alizarin red S staining were quantified. As shown in Fig. 5(a), the ALP activity of PMAC 0.1 and PMAC 0.5 was expressed at higher levels than MAC at three time points, and PMAC 0.5 was the highest among three groups. The ALP activity of PMAC 1 was expressed at a higher level at day 4, however with incubation period prolong, the level of ALP activity decreased substantially at day 7. ALP activity showed that PMAC groups could enhance osteogenesis. As shown in Fig. 5(b) and (c), PMAC 0.5 and PMAC 1 groups showed significantly increased formation of calcium deposition and quantified alizarin red S staining of PMAC 1 was expressed at a higher level at day 3 while PMAC 0.5 showed a higher level at day 7. Moreover, MAC and PMAC 0.1 were approximately similar low at both day 3 and 7. PMAC groups showed a better capacity on osteogenesis and PMAC 0.5 group showed the most increased calcium deposition. Bone formation is the result of biomineralization in vivo. ALP production is the marker of osteogenic differentiation. PMAC hydrogels had functional PO4 groups, which could increase the nucleation sites thus supporting mineralization compared to the MAC group. The ALP activity of PMAC hydrogels didn't show an increasing trend with the increasing of MPC. This result indicated that PMAC 0.5 might be the most proper dose for osteogenesis compared to the other two PMAC groups.4 Conclusion
In this study, a phosphorylated methacrylamide chitosan (PMAC) hydrogel was successfully prepared by modifying methacrylamide chitosan (AMC) with a low cytotoxicity phosphorus source-2-methacryloyloxyethyl phosphorylcholine (MPC). By characterizing the MAC and PMAC hydrogels, the structure, biocompatibility and osteogenesis ability were confirmed. The PMAC hydrogels had no negative effects on the proliferation of hFOB cells, meanwhile PMAC hydrogels showed better osteogenesis than MAC hydrogels. The PMAC hydrogels have great potential in bone tissue engineering.Conflicts of interest
There are no conflicts to declare.Acknowledgements
We gratefully acknowledge funding from Shenzhen Science and Technology Program (JCYJ20170306141716014, JCYJ20170815153105076), the National Nature Science Foundation of China (51502095) and Guangdong Natural Science Funds for Distinguished Young Scholars (2016A030306018).References
- M. M. Stevens and J. H. George, Science, 2005, 310, 1135–1138 CrossRef CAS PubMed.
- Y. C. Chai, A. Carlier, J. Bolander, S. J. Roberts, L. Geris, J. Schrooten, H. Van Oosterwyck and F. P. Luyten, Acta Biomater., 2012, 8, 3876–3887 CrossRef CAS PubMed.
- K. A. Conrads, M. Yi, K. A. Simpson, D. A. Lucas, C. E. Camalier, L. R. Yu, T. D. Veenstra, R. M. Stephens, T. P. Conrads and G. R. Beck Jr, Mol. Cell. Proteomics, 2005, 4, 1284–1296 CrossRef CAS PubMed.
- G. R. Beck Jr, J. Cell. Biochem., 2003, 90, 234–243 CrossRef PubMed.
- G. R. Beck Jr and N. Knecht, J. Biol. Chem., 2003, 278, 41921–41929 CrossRef PubMed.
- M. Julien, S. Khoshniat, A. Lacreusette, M. Gatius, A. Bozec, E. F. Wagner, Y. Wittrant, M. Masson, P. Weiss, L. Beck, D. Magne and J. Guicheux, J. Bone Miner. Res., 2009, 24, 1856–1868 CrossRef CAS PubMed.
- A. Jain, A. Karadag, B. Fohr, L. W. Fisher and N. S. Fedarko, J. Biol. Chem., 2002, 277, 13700–13708 CrossRef CAS PubMed.
- R. F. Loese, Exp. Cell Res., 1994, 211, 17–23 CrossRef PubMed.
- A. Veis, C. Sfeir and C. B. Wu, Crit. Rev. Oral Biol. Med., 1997, 8, 360–379 CrossRef CAS.
- G. He, A. Ramachandran, T. Dahl, S. George, D. Schultz, D. Cookson, A. Veis and A. George, J. Biol. Chem., 2005, 280, 33109–33114 CrossRef CAS PubMed.
- W. J. Landis, K. J. Hodgens, M. J. Song, J. Aren, S. Kiyonag, M. Marko, C. Owen and B. F. McEwen, J. Struct. Biol., 1996, 117, 24–35 CrossRef CAS PubMed.
- K. Li, J. Wang, X. Liu, X. Xiong and H. Liu, Carbohydr. Polym., 2012, 90, 1573–1581 CrossRef CAS PubMed.
- M. Dadsetan, M. Giuliani, F. Wanivenhaus, M. Brett Runge, J. E. Charlesworth and M. J. Yaszemski, Acta Biomater., 2012, 8, 1430–1439 CrossRef CAS PubMed.
- Y. K. Kim, L. S. Gu, T. E. Bryan, J. R. Kim, L. Chen, Y. Liu, J. C. Yoon, L. Breschi, D. H. Pashley and F. R. Tay, Biomaterials, 2010, 31, 6618–6627 CrossRef CAS PubMed.
- P. Huang, X. Bi, J. Gao, L. Sun, S. Wang, S. Chen, X. Fan, Z. You and Y. Wang, J. Mater. Chem. B, 2016, 4, 2090–2101 RSC.
- D. Wang, Biomaterials, 2003, 24, 3969–3980 CrossRef CAS PubMed.
- B. M. Watson, F. K. Kasper, P. S. Engel and A. G. Mikos, Biomacromolecules, 2014, 15, 1788–1796 CrossRef CAS PubMed.
- I. C. Stancu, R. Filmon, C. Cincu, B. Marculescu, C. Zaharia, Y. Tourmen, M. F. Baslé and D. Chappard, Biomaterials, 2004, 25, 205–213 CrossRef CAS PubMed.
- C. R. Nuttelman, D. S. Benoit, M. C. Tripodi and K. S. Anseth, Biomaterials, 2006, 27, 1377–1386 CrossRef CAS PubMed.
- D. S. Benoit, M. P. Schwartz, A. R. Durney and K. S. Anseth, Nat. Mater., 2008, 7, 816–823 CrossRef CAS PubMed.
- P. Huang, X. P. Bi, J. Gao, L. J. Sun, S. F. Wang, S. Chen, X. Q. Fan, Z. W. You and Y. D. Wang, J. Mater. Chem. B, 2016, 4, 2090–2101 RSC.
- C. Xu, P. Su, X. Chen, Y. Meng, W. Yu, A. P. Xiang and Y. Wang, Biomaterials, 2011, 32, 1051–1058 CrossRef CAS PubMed.
- X. Wang, J. Ma, Q. Feng and F. Cui, Biomaterials, 2002, 23, 4591–4600 CrossRef CAS PubMed.
- P. Datta, S. Dhara and J. Chatterjee, Carbohydr. Polym., 2012, 87, 1354–1362 CrossRef CAS.
- L. S. Gu, Y. K. Kim, Y. Liu, K. Takahashi, S. Arun, C. E. Wimmer, R. Osorio, J. Q. Ling, S. W. Looney, D. H. Pashley and F. R. Tay, Acta Biomater., 2011, 7, 268–277 CrossRef CAS PubMed.
- J. Tan, R. A. Gemeinhart, M. Ma and W. M. Saltzman, Biomaterials, 2005, 26, 3663–3671 CrossRef CAS PubMed.
- P. M. Lopez-Perez, R. M. da Silva, R. A. Sousa, I. Pashkuleva and R. L. Reis, Acta Biomater., 2010, 6, 3704–3712 CrossRef CAS PubMed.
- Y. Iwasaki and K. Ishihara, Sci. Technol. Adv. Mater., 2012, 13, 064101 CrossRef PubMed.
- K. Ishihara, Colloids Surf., B, 2000, 18, 325–335 CrossRef CAS PubMed.
- L. M. Yu, K. Kazazian and M. S. Shoichet, J. Biomed. Mater. Res., Part A, 2007, 82, 243–255 CrossRef PubMed.
- M. Lavertu, Z. Xia, A. N. Serreqi, M. Berrada, A. Rodrigues, D. Wang, M. D. Buschmann and A. Gupta, J. Pharm. Biomed. Anal., 2003, 32, 1149–1158 CrossRef CAS PubMed.
Footnote |
| † These authors contributed equally to this work. |
| This journal is © The Royal Society of Chemistry 2018 |

