 Open Access Article
Anisotropic growth of gas–liquid precipitated ceria mesocrystals to wires several micrometers in length
Yuta Kubota ,
Tetsuo Kishi,
Tetsuji Yano and
Nobuhiro Matsushita*
Department of Materials Science and Engineering, Tokyo Institute of Technology, 2-12-1 Ookayama, Meguro, Tokyo 152-8550, Japan. E-mail: matsushita.n.ab@m.titech.ac.jp
First published on 6th July 2018
Abstract
Ceria (CeO2) wires with lengths of 6 μm and diameters of tens of nanometers are fabricated through the anisotropic growth of mesocrystals. In the gas–liquid precipitation process, an aqueous Ce(NO3)3 solution is used as a starting material and NH3 gas is used to induce CeO2 precipitation at the gas–liquid interface. CeO2 mesocrystals, formed by this process at 60 °C, grow in the direction of 〈011〉 into micrometer length wires exposing {001} and {011} on their side walls. It is shown that the initial pH of the starting material solution is a key parameter to attain anisotropic growth of the CeO2 mesocrystals. We thus propose the formation mechanism of micrometer length-CeO2 wires from mesocrystals.
1. Introduction
Ceria (CeO2) is used widely as an oxygen gas sensor,1–3 oxidation catalyst,4–6 co-catalyst for automotive exhaust-gas conversion,7–9 and a polishing agent for glasses,10–12 owing to its outstanding oxygen storage-release capacity (OSC), inherent Ce3+/Ce4+ reduction–oxidation cycle, and chemical reaction with SiO2. In addition, there has been growing interest in trivalent metal ion doped CeO2, such as Sm-doped CeO2 (SDC), Gd-doped CeO2 (GDC), and Y-doped CeO2 (YDC), as electrolytes in solid oxide fuel cells,13–15 since they exhibit oxygen ion conductivity owing to the oxygen vacancy in their crystals. The properties of CeO2 depend on its shapes, and controlling the shape is important to attain the practical performances. CeO2 nanoparticles,16,17 nanocubes,18–21 nanotubes/nanorods/nanowires,22–27 and nanosheets28,29 have been prepared by solution processes using certain additives, such as oleic acid, cetyltrimethylammonium bromide (CTAB), NH4HCO3, and Na3PO4, to control their sizes and shapes.Some organic compounds often remain inside and on the surface of the products. CePO3 is sometimes included in the products as impurities in the case of a hydrothermal synthesis using Na3PO4. Cerium carbonates compounds are also included in the products prepared using NH4HCO3. However, the heating process required for the removal of organic compounds from the products is likely to cause unfavourable aggregation and excessive grain growth of CeO2 nanomaterials. In the case of CeO2 1D nanostructures, such as nanotubes/nanorods/nanowires, there have been some preparation reports that have not used surfactants. Zhou et al. reported that Ce(OH)3 nanorods/nanotubes were formed by a hydrothermal process using NaOH at 130 °C, and then CeO2 nanotubes were prepared by ultrasonic synthesis using H2O2 at room temperature.30 Although this synthesis could prepare CeO2 without impurities, a hydroxide was initially formed before obtaining the oxide. Alternatively, Gu and Meng reported that SDC nanowires and nanotubes could be prepared directly from aqueous Ce and Sm salts without impurities by a gas–liquid precipitation process.31 In this process, gas phase alkaline agents were added into a metal ions solution for the precipitation reaction. This process, which uses gaseous ammonia, is different from a general precipitation. A direct preparation without incorporating impurities is advantageous for preparing oxides, but the mechanism for the 1D shape formation remains unknown.
In this study, 1D structured CeO2 several micrometers in length was prepared by a gas–liquid precipitation process under various conditions, that is, synthesis temperature, the kind of Ce salt, and initial pH of the aqueous Ce salt. The study revealed that the formation of CeO2 “mesocrystals” is essential for anisotropic growth of 1D shaped CeO2 wire. The mesocrystals mean mesoscale self-assembled structure and transformation of nanostructures or superstructures of nanocrystals with a specific crystallographic orientation.32,33 The study will open up a way for the anisotropic growth of mesostructured functional materials.
2. Experimental method
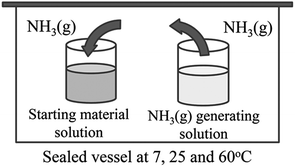
CeO2 wires were prepared by the gas–liquid precipitation process shown in Fig. 1. This process was carried out by vaporizing NH3 from an NH3 gas generating solution, and the generated gas reached the surface of the starting material solution, which induced precipitation at the gas–liquid interface. The starting material solution was prepared by dissolving 2 mmol of Ce(NO3)3·6H2O (Wako Pure Chemical Industries, Ltd., Japan, 99.5%) and CeCl3·7H2O (Wako Pure Chemical Industries, Ltd., Japan, 97.0%) into deionized water (40 mL) at 25 °C. Aqueous NH3 (Wako Pure Chemical Industries, Ltd., Japan, 40 mL, 28 wt%) was used as the NH3 gas generating solution. The pH values of aqueous solutions of 0.05 M Ce(NO3)3 and 0.05 M CeCl3 were 4.6 and 5.7, respectively. The difference in pH of the nitrate and chloride solutions directly affected the wire CeO2 formation. Therefore, the experiment using CeCl3 was conducted after adjusting the pH to 4.6 using HCl. Containers of the starting material solution and the NH3 gas generating solution were placed into a sealed vessel, and were maintained at temperatures of 7, 25, and 60 °C for 3 and 10 days. The obtained precipitates were then purified 3 times using deionized water, and were dried at 60 °C for 1 day. All synthesis conditions are listed in Table 1.| Sample | Starting material | Initial pH | Synthesis temp. [°C] | Synthesis time [day] |
|---|---|---|---|---|
| (a) | Ce(NO3)3·6H2O | 4.6 | 25 | 3 |
| (b) | Ce(NO3)3·6H2O | 4.6 | 25 | 10 |
| (c) | Ce(NO3)3·6H2O | 4.6 | 7 | 3 |
| (d) | Ce(NO3)3·6H2O | 4.6 | 60 | 3 |
| (e) | CeCl3·7H2O | 5.7 | 60 | 3 |
| (f) | CeCl3·7H2O | 4.6 (adjusted by HCl) | 60 | 3 |
The purified samples were characterized by powder X-ray diffraction (XRD) analyses, field emission-scanning electron microscopy (FE-SEM), and transmission electron microscopy (TEM). Powder XRD analyses were performed by a RINT 2100 diffractometer (Rigaku Co., Japan) with a CuKα radiation source (λ = 1.54056 Å). The operating current and voltage for the analyses were 40 mA and 40 kV, respectively, and the scanning rate was set as 2 deg min−1. A non-reflecting plate made of single crystal silicon was used as a sample holder. FE-SEM observations were performed by a S-4500 scanning electron microscope (Hitachi Ltd., Japan) at an accelerating voltage of 15 kV. The samples were coated with a Pt–Pd layer by sputtering before the observations. TEM observations were performed by a H-8100 transmission electron microscope (Hitachi Ltd., Japan) at an accelerating voltage of 200 kV and current of 8 μA. The TEM grid samples to be observed were prepared by dropping sample dispersions in H2O on an elastic carbon support film (ELS-C10, Okenshoji Co., Ltd., Japan). Here, these dispersions were produced by ultrasonication for several seconds. Three software programs were used to investigate the formation mechanism of the CeO2 wires. These were “ImageJ” (Rasband, National Institutes of Health, USA),34 “ReciPro” (Seto, Kobe University, Japan), and “VESTA” (Momma and Izumi).35 ImageJ was used to obtain the fast Fourier transform (FFT) diffraction patterns of the prepared CeO2 nanoparticles from their TEM images. The obtained FFT diffraction patterns were matched with those of the CeO2 single crystal. VESTA was used to draft the crystal morphologies of the CeO2 nanoparticles from the data obtained by ReciPro.
3. Results and discussion
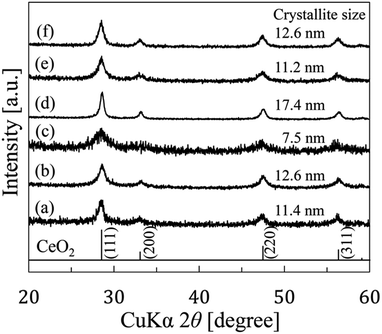
This paper revealed two unique points. (1) Mesocrystals were formed before CeO2 wires formation and (2) initial pH is one of the intrinsic conditions to obtain CeO2 wires by gas–liquid precipitation process.Fig. 2 shows the XRD patterns of the samples prepared by the gas–liquid precipitation process on the different conditions listed in Table 1. The patterns corresponded to those of reference CeO2 (JCPDS card no. 43-1002). The average crystallite sizes of the precipitates were calculated at the strongest peaks (111) using the Scherrer equation described below:
D = 0.9λ/β![[thin space (1/6-em)]](https://www.rsc.org/images/entities/char_2009.gif) cos cos![[thin space (1/6-em)]](https://www.rsc.org/images/entities/char_2009.gif) θ θ |
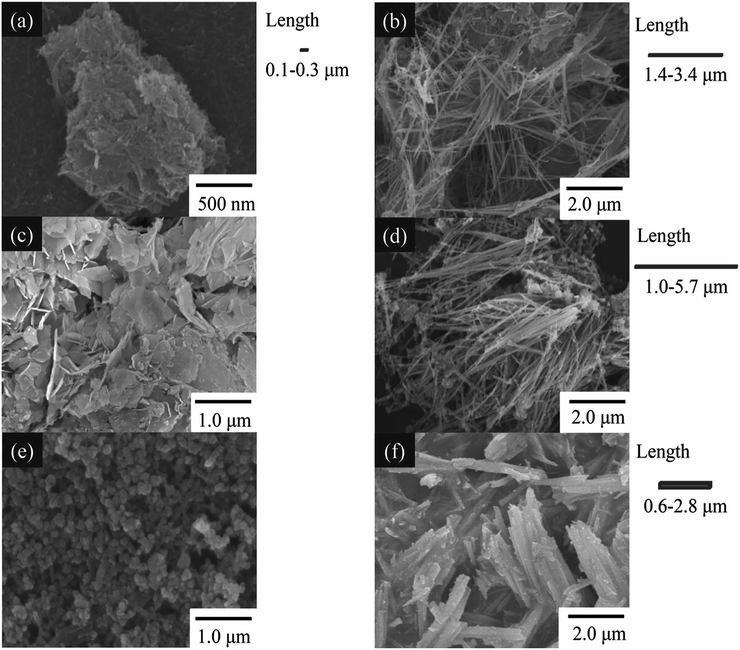
In addition to the estimation of the crystallite size, we observed the shapes of the prepared samples by FE-SEM, as shown in Fig. 3. The shapes of the precipitates were different for the various synthesis conditions. CeO2 precipitates accumulated as rods for the conditions (a) and (f), and wires with lengths of several micrometers for the conditions (b) and (d). However, the CeO2 precipitates had a plate-like structure and an unremarkable particle structure for the conditions (c) and (e). The lengths and diameters were (a) 0.1–0.3 μm and 5–10 nm, (b) 1.4–3.4 μm and 5–40 nm, (d) 1.0–5.7 μm and 5–50 nm, and (f) 0.6–2.8 μm and 100–200 nm, respectively. Comparing (a) and (b), the synthesis time had an influence on the length of samples. In the case of (a) and (d), the synthesis temperature also had an influence on the length of the samples. There was a difference between (e) and (f) in the initial pH of the staring material solution. From this difference, it was evident that the initial pH of the starting material solution has an effect on the anisotropic growth of precipitates. The pH value of 4.6 was effective for obtaining 1D growth compared with a value of 5.7. In addition, a wire shape with a high aspect ratio was prepared more easily using Ce(NO3)3 rather than CeCl3.
Fig. 4 shows the change in pH of the starting material (Ce(NO3)3) solution at 60 °C at various times. Each pH was measured at 25 °C after cooling. The pH values were almost constant from 1/6 to 5 min at 6.2, and then the pH value increased from 5 to 30 min. The pH value of 9.5 gradually increased to pH 11.3 after 3 days.
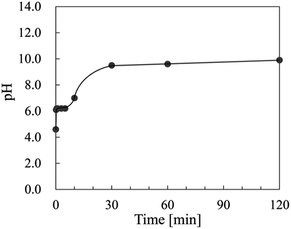 | ||
| Fig. 4 Change in pH of the starting material (Ce(NO3)3) solution at 60 °C for various times. Each pH was measured at 25 °C after cooling. | ||
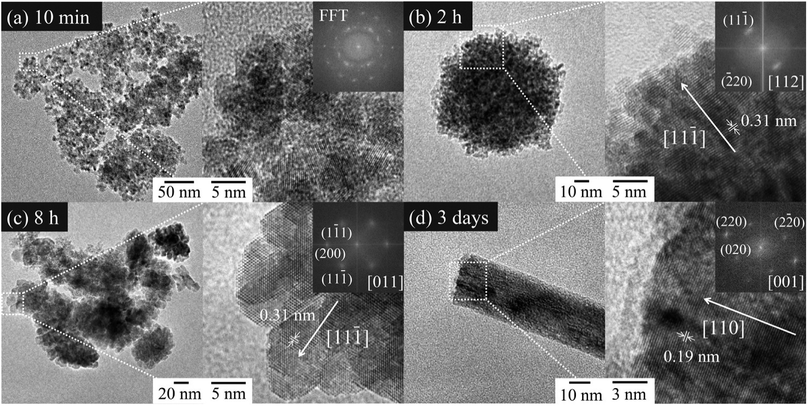
Fig. 5(a)–(d) shows TEM images and the FFT patterns of the CeO2 nanoparticles prepared at 60 °C for (a) 10 min, (b) 2 h, (c) 8 h, and (d) 3 days by gas–liquid precipitation using Ce(NO3)3 as the starting material. Since the precipitates in the sample prepared for 5 min was dissolved during centrifugation and could not be observed by TEM, the sample prepared for 10 min was observed instead. In Fig. 5(a), the aggregated nanoparticles of 2–5 nm in diameter were observed without having an oriented attachment. However, the sample prepared for 2 h was a mesocrystal, in which nanoparticles had an oriented attachment at {111} as seen in the FFT patterns. The sample prepared for 8 h was also a mesocrystal composed of nanoparticles that looked like hexagonal plates. The sample prepared for 3 days had a wire shape that showed anisotropic growth in the 〈011〉 direction. The FFT image revealed that {001} and {011} were exposed on the wire surfaces.
In this research, the mesocrystal was not formed for 10 min after the commencement of the reaction. The products started to crystallize at the gas–liquid interface in this process. As was previously described, the samples prepared for 5 min at the gas–liquid interface were dissolved during centrifugation. From these facts, resolution of the particles prepared at the gas–liquid interface was achieved because of pH gradation from the gas–liquid interface to the bottom of the container. According to the literature,36 the surface energies of CeO2 surfaces are in the order of {001} > {011} > {111}. Therefore, {001} and {011} are dissolved more easily than {111}. This indicated that resolution of the precipitates prepared for 10 min after commencement of the reaction, which had {001} and {011} surfaces, was achieved with going down to the bottom of the container. In other words, the pH at the bottom of the container was sufficiently low for resolution of the precipitates with the {001} and {011} surfaces 10 min after commencement of the reaction. The dissolved Ce4+ was adsorbed on the remaining CeO2 {111} surface, and the {111} exposed nanocrystals were formed as a result. The pH of the container almost became saturated and became basic after a reaction time of 30 min, as shown in Fig. 4. The increase in the concentration of OH− prevented the resolution of {001} and {011}. Therefore, it was assumed that {001} and {011} were formed on the {111}-oriented CeO2 nanocrystals after a reaction time of 30 min. However, CeO2 {001} was first evident in the TEM observation of the sample prepared for 8 h. We assumed the change in the morphology of the nanocrystals was delayed from the change in the pH, since the nanocrystals grew very slowly by Ostwald ripening. As was mentioned previously, {001} is more unstable than {111}, so the grown nanocrystals exposed {001} surface in the mesocrystal reassembled to be attached to each other on {001}, and then mesocrystals composed of hexagonal plate-like nanocrystals were formed. Since the {001} surface has a strong polarity,20,37 NO3− ions are attracted to the {001} surface, and they work as capping agents.38 Therefore, the oriented attachment on {001} was stopped owing to the reassembly because of an increase in the ratio of the concentration of NO3− ions to the surface area of the {001} surface. From the above, the oriented attachment on {111} proceeded, and CeO2 wires, which grew in the 〈011〉 direction, were formed as a result. We assumed the concentration of NO3− had an influence on the growth direction of the wire, whether 〈011〉 or 〈001〉, and on the thickness along 〈001〉 of the 〈011〉 grown wire.
The CeO2 nanoparticles formed from 10 min to 3 days are illustrated in Fig. 6 using VESTA considering the TEM observations shown in Fig. 5. Mesocrystals composed of {111} preferentially exposed nanocrystals were formed after 10 min, when the pH was sufficiently low for the Ce4+ on {011} and {001} facets to be adsorbed on {111} preferentially (STAGE 0 → 1). Once the pH was sufficiently increased for growth of {001} and {011}, nanocrystals in the mesocrystals changed their growth direction from 〈001〉 to both of 〈001〉 and 〈111〉. After formation of {001}, the nanocrystals in the mesocrystal reassembled to be attached to each other on {001} owing to its high surface energy, and mesocrystals composed of hexagonal plate-like nanocrystals were formed (STAGE 1 → 2). Since the {001} surface was stabilized by NO3− ions, the oriented attachment on {111} proceeded (STAGE 2 → 3). The grown mesocrystals were continuously attached to each other on {111} to have anisotropic growth in 〈011〉, and CeO2 wires were formed (STAGE 3 → 4).
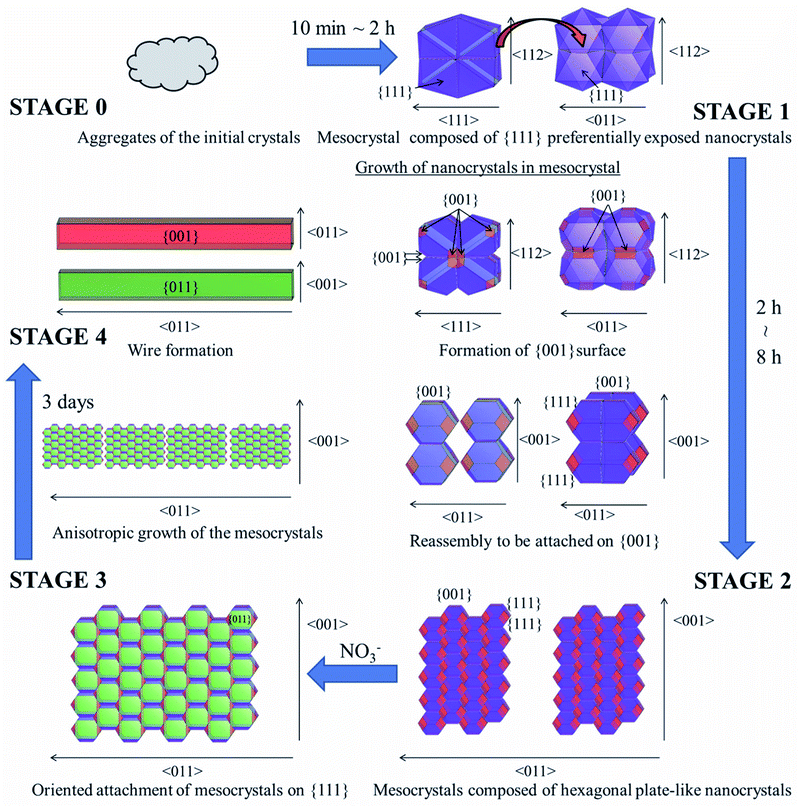 | ||
| Fig. 6 Formation mechanism of several micron length CeO2 wire by the gas–liquid precipitation process (from STAGE 0 to 4). | ||
We propose that the resolution of the first nanocrystals in aggregates at low pH is an essential reaction for the formation of mesocrystals, which is required for 1D shaped CeO2 wires/rods formation. CeO2 rods were obtained from CeCl3 when the initial pH was sufficiently low at 4.6, as shown in Fig. 3(e) and (f). In addition, dissolution–recrystallization process is enhanced by the presence of NO3−.38 Therefore, it was considered that mesocrystals were formed more easily using Ce(NO3)3 rather than CeCl3. CeO2 wires with a higher aspect ratio were formed from Ce(NO3)3, as shown in Fig. 3(d) and (f), even though the initial pH of the CeCl3 solution was adjusted to the same value to that of the Ce(NO3)3 solution. These experimental results were consistent with our formation mechanism proposed in this study.
4. Conclusions
Prepared CeO2 wires were formed from mesocrystals by {111}-oriented attachments. Hence, the formation of mesocrystals in the initial step of the reaction was a key point for the formation of CeO2 wires. Although it remains a challenge for future research to reveal the relationship between the morphologies of the prepared CeO2 and the change in the pH of the starting material solution, we found the initial pH of the starting material solution had an influence on the mesocrystals formation. The gas–liquid precipitation process developed in this study enabled the formation of micrometer length CeO2 wires using only ambient conditions. This green process opens a way for functional oxides to form their oriented mesocrystals depending on their surface energies and to transform into the designated shapes like wires and sheets.Conflicts of interest
There are no conflicts to declare.Acknowledgements
The authors are grateful to Professor Y. Seto (Kobe University, Japan) for his contribution in the “ReciPro” software used for matching the FFT diffraction patterns of the prepared CeO2 nanoparticles with those of the theoretical crystal CeO2. The authors also thank Professor Y. Kitamoto (Tokyo Institute of Technology, Japan) for assistance with the TEM analyses. This work was supported by MEXT Nanotechnology platform 12025014(F-17-IT-0017).References
- J. W. Dawicke and R. N. Blumenthal, J. Electrochem. Soc., 1986, 133, 904–909 CrossRef.
- N. Izu, W. Shin, I. Matsubara and N. Murayama, Sens. Actuators, B, 2004, 100, 411–416 CrossRef.
- C.-Y. Chen, K.-H. Chang, H.-Y. Chiang and S.-J. Shih, Sens. Actuators, B, 2014, 204, 31–41 CrossRef.
- P. Pal, S. K. Pahari, A. Sinhamahapatra, M. Jayachandran, G. V. M. Kiruthika, H. C. Bajaja and A. B. Panda, RSC Adv., 2013, 3, 10837–10847 RSC.
- C. L. Menéndez, Y. Zhou, C. M. Marin, N. J. Lawrence, E. B. Coughlin, C. L. Cheung and C. R. Cabrera, RSC Adv., 2014, 4, 33489–33496 RSC.
- W. Zou, C. Ge, M. Lu, S. Wu, Y. Wang, J. Sun, Y. Pu, C. Tang, F. Gao and L. Dong, RSC Adv., 2015, 5, 98335–98343 RSC.
- M. Ozawa, M. Kimura and A. Isogai, J. Alloys Compd., 1993, 193, 73–75 CrossRef.
- J. Kašpar, P. Fornasiero and M. Graziani, Catal. Today, 1999, 50, 285–298 CrossRef.
- S. Matsumoto, Catal. Today, 2004, 90, 183–190 CrossRef.
- L. M. Cook, J. Non-Cryst. Solids, 1990, 120, 152–171 CrossRef.
- T. Hoshino, Y. Kurata, Y. Terasaki and K. Susa, J. Non-Cryst. Solids, 2001, 283, 129–136 CrossRef.
- P. Janoš, J. Ederer, V. Pilařová, J. Henych, J. Tolasz, D. Milde and T. Opletal, Wear, 2016, 362–363, 114–120 CrossRef.
- Z. Fu, Q. Sun, D. Ma, N. Zhang, Y. An and Z. Yang, Appl. Phys. Lett., 2017, 111, 023903 CrossRef.
- S. Zha, A. Moore, H. Abernathy and M. Liu, J. Electrochem. Soc., 2004, 151, A1128–A1133 CrossRef.
- Y. Zheng, L. Wu, H. Gu, L. Gao, H. Chen and L. Guo, J. Alloys Compd., 2009, 486, 586–589 CrossRef.
- H.-I. Chen and H.-Y. Chang, Colloids Surf., A, 2004, 242, 61–69 CrossRef.
- G. Wang, Q. Mu, T. Chen and Y. Wang, J. Alloys Compd., 2010, 493, 202–207 CrossRef.
- F. Dang, K. Kato, H. Imai, S. Wada, H. Haneda and M. Kuwabara, Cryst. Growth Des., 2010, 10, 4537–4541 CrossRef.
- T. Taniguchi, K. Katsumata, S. Omata, K. Okada and N. Matsushita, Cryst. Growth Des., 2011, 11, 3754–3760 CrossRef.
- Y. Makinose, T. Taniguchi, K. Katsumata, K. Okada and N. Matsushita, Adv. Powder Technol., 2016, 27, 64–71 CrossRef.
- Y. Liu, Z. Li, H. Xu and Y. Han, Catal. Commun., 2016, 76, 1–6 CrossRef.
- L. Yan, R. Yu, J. Chen and X. Xing, Cryst. Growth Des., 2008, 8, 1474–1477 CrossRef.
- Z. Ji, X. Wang, H. Zhang, S. Lin, H. Meng, B. Sun, S. George, T. Xia, A. E. Nel and J. I. Zink, ACS Nano, 2012, 6, 5366–5380 CrossRef PubMed.
- A. Vantomme, Z.-Y. Yuan, G. Du and B.-L. Su, Langmuir, 2005, 21, 1132–1135 CrossRef PubMed.
- Z.-Y. Yuan, V. Idakiev, A. Vantomme, T. Tabakova, T.-Z. Ren and B.-L. Su, Catal. Today, 2008, 131, 203–210 CrossRef.
- R.-J. Qi, Y.-J. Zhu, G.-F. Cheng and Y.-H. Huang, Nanotechnology, 2005, 16, 2502–2506 CrossRef.
- K. Nakagawa, Y. Tezuka, T. Ohshima, M. Katayama, T. Ogata, K. Sotowa, M. Katoh and S. Sugiyama, Adv. Powder Technol., 2016, 27, 2128–2135 CrossRef.
- C. R. Li, Q. T. Sun, N. P. Lu, B. Y. Chen and W. J. Dong, J. Cryst. Growth, 2012, 343, 95–100 CrossRef.
- Q. Dai, S. Bai, H. Li, W. Liu, X. Wang and G. Lu, CrystEngComm, 2014, 16, 9817–9827 RSC.
- K. Zhou, Z. Yang and S. Yang, Chem. Mater., 2007, 19, 1215–1217 CrossRef.
- L. N. Gu and G. Y. Meng, Mater. Res. Bull., 2008, 43, 1555–1561 CrossRef.
- H. Cölfen and S. Mann, Angew. Chem., Int. Ed., 2003, 42, 2350–2365 CrossRef PubMed.
- E. V. Sturm and H. Cölfen, Crystals, 2017, 7, 207 CrossRef.
- C. A. Schneider, W. S. Rasband and K. W. Eliceiri, Nat. Methods, 2012, 9, 671–675 CrossRef PubMed.
- K. Momma and F. Izumi, J. Appl. Crystallogr., 2008, 41, 653–658 CrossRef.
- M. Baudin, M. Wójcik and K. Hermansson, Surf. Sci., 2000, 468, 51–61 CrossRef.
- H. F. Wardenga and A. Klein, Appl. Surf. Sci., 2016, 377, 1–8 CrossRef.
- Q. Wu, F. Zhang, P. Xiao, H. Tao, X. Wang, Z. Hu and Y. Lü, J. Phys. Chem. C, 2008, 112, 17076–17080 CrossRef.
| This journal is © The Royal Society of Chemistry 2018 |

