
 Open Access Article
 This Open Access Article is licensed under a Creative Commons Attribution-Non Commercial 3.0 Unported Licence
Correlation of crystal structure and optical properties of Ba0.97Nd0.0267Ti(1-x)WxO3 perovskite
Z. Raddaouia,
B. Smirib,
A. Maaouic,
J. Dhahri *a,
R. M'ghaiethb,
N. Abdelmoulad and
K. Khirounie
*a,
R. M'ghaiethb,
N. Abdelmoulad and
K. Khirounie
aLaboratoire de la Matière Condensée et des Nanosciences, Université de Monastir, Faculté des Sciences de Monastir, Avenue de l'environnement, 5019 Monastir, Tunisia. E-mail: j.dhahri3000@gmail.com
bLaboratoire de Micro-optoélectroniques et Nanostructures, Université de Monastir, Faculté des Sciences Monastir, Avenue de l'environnement, 5019 Monastir, Tunisia
cLaboratoire des Interfaces et des Matériaux Avancés, Université de Monastir, Faculté des Sciences de Monastir, Avenue de l'environnement, 5019 Monastir, Tunisia
dLaboratoire des Matériaux Ferroélectriques, LR-Physique-Mathématiques et Applications, Université de Sfax, Faculté des Sciences, Route de Soukra km 3.5 B.P 1171, 3000 Sfax, Tunisia
eLaboratoire de Physique des Matériaux et des Nanomatériaux Appliquée à L'environnement, Université de Gabes, Faculté des Sciences de Gabes Cité Erriadh, 6079 Gabes, Tunisia
First published on 3rd August 2018
Abstract
The Ba0.97Nd0.0267Ti(1−x)WxO3 (BNTx) pervoskite with a single phase tetragonal structure was prepared at 900 °C using the Molten salt method. Raman spectra, Fourier transform infrared spectra (FT-IR), absorption spectra (Vis-NIR) and photoluminescence spectra (PL) in the temperature range from 10–300 K were used to investigate the correlations between the crystal structure and the optical properties of BNTx ceramics. Raman analyses and FT-IR indicated that the W6+ ions are incorporated sufficiently into into the BNTx lattice. The optical absorption spectra were recorded in the wavelength range of 400–1000 nm. The optical band gap (Eg) and Urbach energy (Eu) values were calculated from the absorption spectra. The emission spectra exhibited three prominent peaks located at 880, 1058 and 1340 nm corresponding to the 4F3/2 → 4I9/2,11/2,13/2 transition levels, respectively. They also showed a decrease in the intensity of emission spectra following the addition of W6+ ions. This decrease is due to the slight changes in the crystal environment around Nd3+ and the non-radiative energy transfer. According to the PL measurements, the study of power-excitation density confirmed that two photons at low energy are required to create the down-conversion (DC) emissions, implying that they may also have important applications as DC materials.
1. Introduction
Due to their potential applications in novel multifunctional devices, luminescent materials based on rare earth doped ferro/piezoelectric ceramics have received considerable interest to replace the traditional phosphors in many industrial and commercial technologies, such as solid state lasers, white light-emitting diodes (WLEDs), biomedical imaging, DNA detection, and photodynamic therapy.1However, trivalent neodymium (Nd3+) has emerged as an important RE ion of functional materials in the field of luminescence.2 The suitability of the Nd3+ ion in emitting strong near infrared (NIR) fluorescence makes it a potential candidate for high-power laser applications.3 Furthermore, most research studies have concentrated on the Nd3+ ions due to their efficient infrared emissions by the three transitions 4F3/2 → 4I9/2, 4F3/2 → 4I11/2 and 4F3/2 → 4I13/2 with emissions at wavelengths around 946, 1064 and 1350 nm which finds potential applications in the fields of laser and infrared optical communications.4
Indeed, many studies have demonstrated an appreciable enhancement of the spectral analysis of Nd3+ ions. G. Singh et al.5 reports that the emissions of neodymium in lead lanthanum zirconate titanate (Pb0.91La0.08(Zr0.65Ti0.35)0.98O3) have been extensively studied owing to their excellent luminescence properties and proper energy separation towards a potential application in the fields of laser and infrared optical communications.6 Also, K. Lemanski et al.7 discussed the optical properties of CaTiO3 doped by Nd3+ ions and studied the influence of luminescent properties as a function of the annealing temperature and the concentration of neodymium ions. It was also demonstrated that the PL intensity of RE ions doped ferroelectric ceramics (Nd3+ doped sodium bismuth titanate (Na0.5Bi0.5TiO3)) can be enhanced the polarization as reported that C. He et al.8 Nevertheless, most of the RE ions doped ferroelectric ceramics exhibit only weak luminescence intensity due to the high phonon energy which could increase the possibility of nonradiative transition. To avoid these problems, the development of new materials with low phonon energy ferroelectrics has attracted considerable attention in the last decade.
Currently, Barium Titanate (BT) is one of the most widely used materials, since a significant breakthrough made by its excellent piezoelectric coefficient and a complex photo-luminescent spectrum as reported by Shihua et al.9 This material has a perovskite structure with a direct bandgap (2.8–3.2 eV). It presents many radiative transitions and a visible emission band is found to be sensitive to the particle size whose surface states and crystal lattice defects act as optical absorption centers. Most importantly, BT ceramics have excellent properties including low phonon energy (about 700 cm−1), good insulating property and chemical/physical stability. Therefore, high-efficiency luminescence properties are expected in RE ions doped BT ceramics.
In addition, it had been revealed that the emission intensity of RE ions-doped fluorides and oxides can be modified with the addition of transition metals such as molybdenum (Mo) and tungsten (W).10,11
Bokolia et al.12 pointed out that the UC emission intensity of Bi4Ti3O12: Er/Yb/W single crystal was significantly enhanced with W doping by a distortion in the crystallographic symmetry. However, few reports on the effects of transition metals on the luminescence properties of RE ions -doped ferroelectric ceramics are found in the literature. Thus, it would be very interesting to investigate the effect of transition metal on the PL emission of RE-ions doped ferroelectric ceramics and their temperature sensing application.
A detailed literature survey shows that not much work has been done on the optical properties and thermo-optical properties in the simultaneous substitution of rare earth Nd3+ ion and transition metal W6+ in lead-free perovskite. For this reason, we reports on the effect of WO3 on the structural and optical properties of Ba0.97Nd0.0267TiO3 ceramics.
2. Experimental procedure
2.1. Preparation of Ba0.97Nd0.0267Ti(1−x)WxO3 perovskite samples
The BNTx (x = 0.00 and x = 0.05) samples were synthesized via a molten salt method using BaCO3, TiO2, WO3 and C6H9NdO6 as precursors, all with a purity better than 99.9%. The precursors were weighed, then, thoroughly mixed in an agate mortar for 2 h. The salt-precursor mixture was placed in an alumina crucible and heated at 800 °C for 24 h. After cooling to room temperature, the mixture was washed with distilled water and filtered to remove the salts. After being dried at 100 °C in air and ground thoroughly, the compounds were pressed into disks (of 8 mm diameter and about 2 mm thickness) and sintered in air at 900 °C for 24 h.2.2. Characterization of the samples
The Raman spectroscopy was recorded in the frequency range 50–1000 cm−1 in a micro-Raman Spectrometer LABRAM HR800. The excitation source was the 633 nm lines of He+ ion laser, working in a back scattering. The spectral resolution of the system was 3 cm−1. The deconvoluted Raman active modes for BaTiO3 and Ba0.97Nd0.0267Ti(1−x)WxO3 (x = 0.00 and x = 0.05) are determined by fitting using the LabSpec5 software with a combined Lorentzian–Gaussian band shape. Fourier transform infrared spectra (FT-IR) were recorded in transmittance mode at room temperature in the frequency range 450 to 4000 cm−1 on PerkinElmer spectrum 100 spectrophotometer using KBr pellet technique. Absorption spectra were recorded via a Shimadzu UV-3101PC scanning spectrophotometer. The photoluminescence (PL) measurements were performed in a closed cycle helium cryostat between 10 and 300 K. The 514 nm line of the continuous-wave (cw) Ar+ laser was used as an excitation source. Spectral analysis of the luminescence measurements was carried out using iHR320 monochromator and detected by a Germanium photodetector.3. Results and discussion
The main panel of Fig. 1 shows the powder X-ray diffraction patterns of Ba0.97Nd0.0267Ti(1−x)WxO3 samples at room temperature. The observed peaks were sharp and with a high intensity, indicating a high crystalline nature. Using Rietveld refinement of the XRD data, we indexed all peaks on the basis of a major tetragonal structure with P4mm space group, as well as a BaWO4 secondary phase for x = 0.05 sample. Detailed results of the structural parameters deduced from the refinement are summarized in Table 1. As can be seen, a steady variation of the lattice parameters and the volume confirmed the insertion of the doping element (W6+ ions) in the titanium site and is explained by the difference of their ionic radius according to Shannon's table.13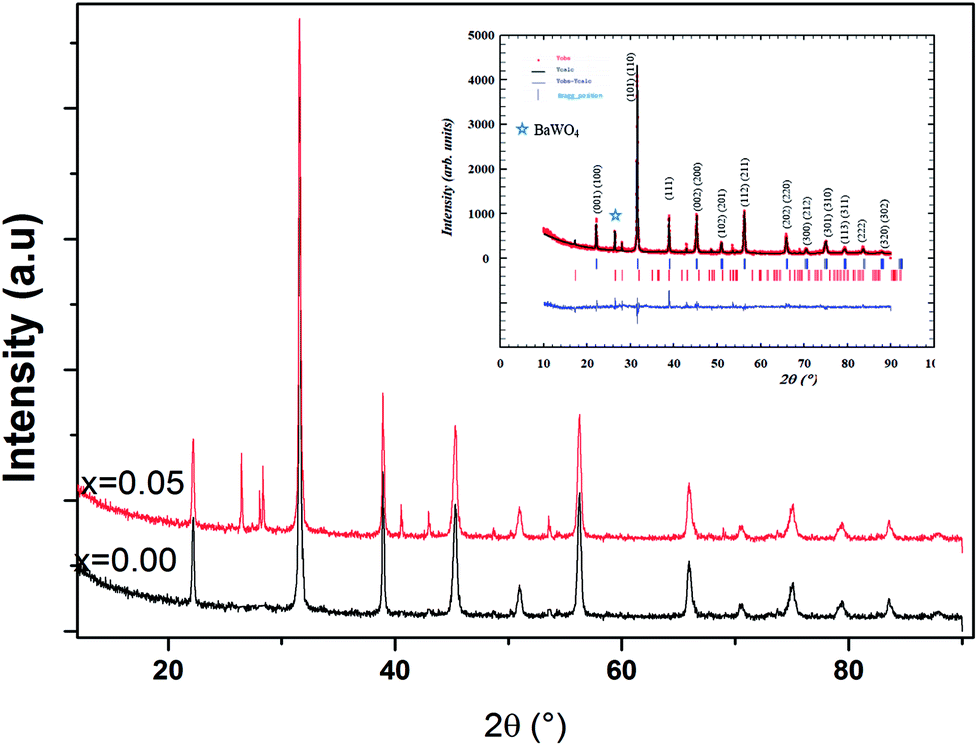 | ||
| Fig. 1 XRD pattern of Ba0.97Nd0.0267Ti(1−x)WxO3 ceramics with x = 0.00 and 0.05. Open circles correspond to the X-ray diffraction data and the lines are theoretical fits to the observed X-ray data. Rietveld analysis results for x = 0.05 sample. Vertical bars are the Bragg reflections for the P4mm space group. The pattern difference between the observed data and the theoretical fit is shown at the bottom. | ||
| Ba0.97Nd0.0267Ti(1−x)WxO3 | x = 0.00 | x = 0.05 |
|---|---|---|
| Cell parameters | ||
| a = b (Å) | 3.9973(6) | 3.997(1) |
| c (Å) | 4.0117(0) | 4.014(0) |
| V (Å3) | 64.14(2) | 64.136 |
| c/a | 1.0036 | 1.0042 |
![[thin space (1/6-em)]](https://www.rsc.org/images/entities/char_2009.gif) |
||
| Discrepancy factors | ||
| Rp (%) | 7.5 | 8.34 |
| Rwp (%) | 9.46 | 10.7 |
| χ2 | 1.79 | 2.454 |
To get a deep insight into the effect of substitution, Raman spectroscopy is a useful spectroscopic tool for exploring the structure and the presence of functional groups in the host sample. The room temperature depolarized Raman spectra of all Ba0.97Nd0.0267Ti(1−x)WxO3 compositions, are shown in Fig. 2. One can state that Raman spectra of W6+-doped Ba0.97Nd0.0267TiO3 are not significantly different from that of the undoped compound meanwhile an interesting modification of local vibrational dynamics introduced by the structural distortion and slight change in local symmetry of the pure sample can be observed. However, the spectra are similar to that of Raman active modes of BaTiO3 in tetragonal phase,14 which is consistent with our XRD result. In order to determine the exact peak frequencies of the different Raman active modes, we fitted the Raman data of the BaTiO3 and Ba0.97Nd0.0267Ti(1−x)WxO3 ceramics, which is shown in Fig. 3. The proposed assignments and other observed mode wave numbers are summarized in Table 2, which compare the patterns observed in this study with those prelifted according to the literature.15–18
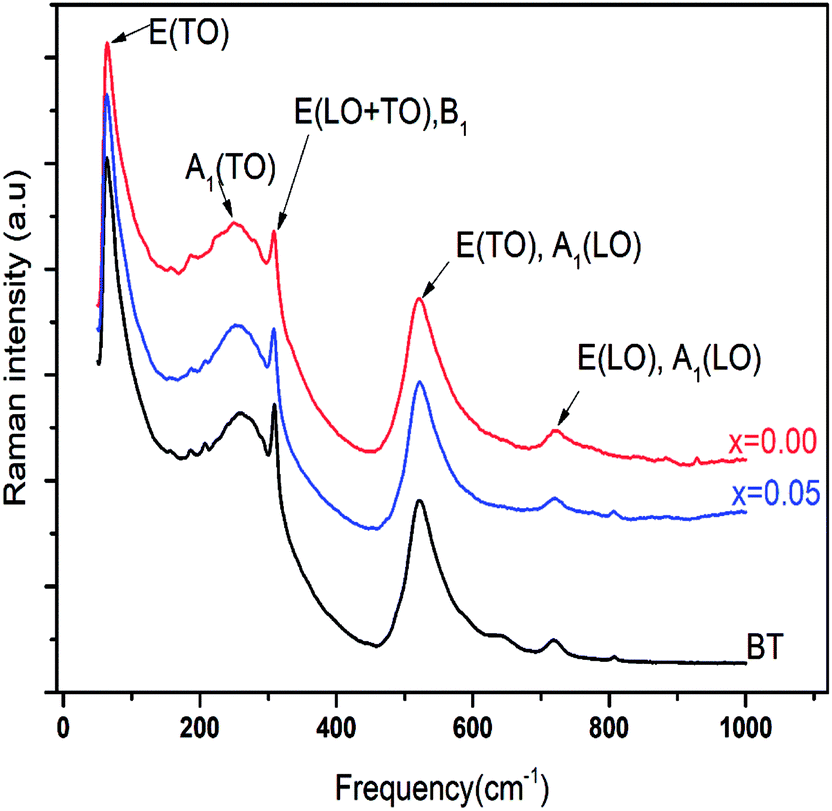 | ||
| Fig. 2 Raman spectra of BT and Ba0.97Nd0.0267Ti(1−x)WxO3 ceramics with x = 0.00 and 0.05 at room temperature. | ||
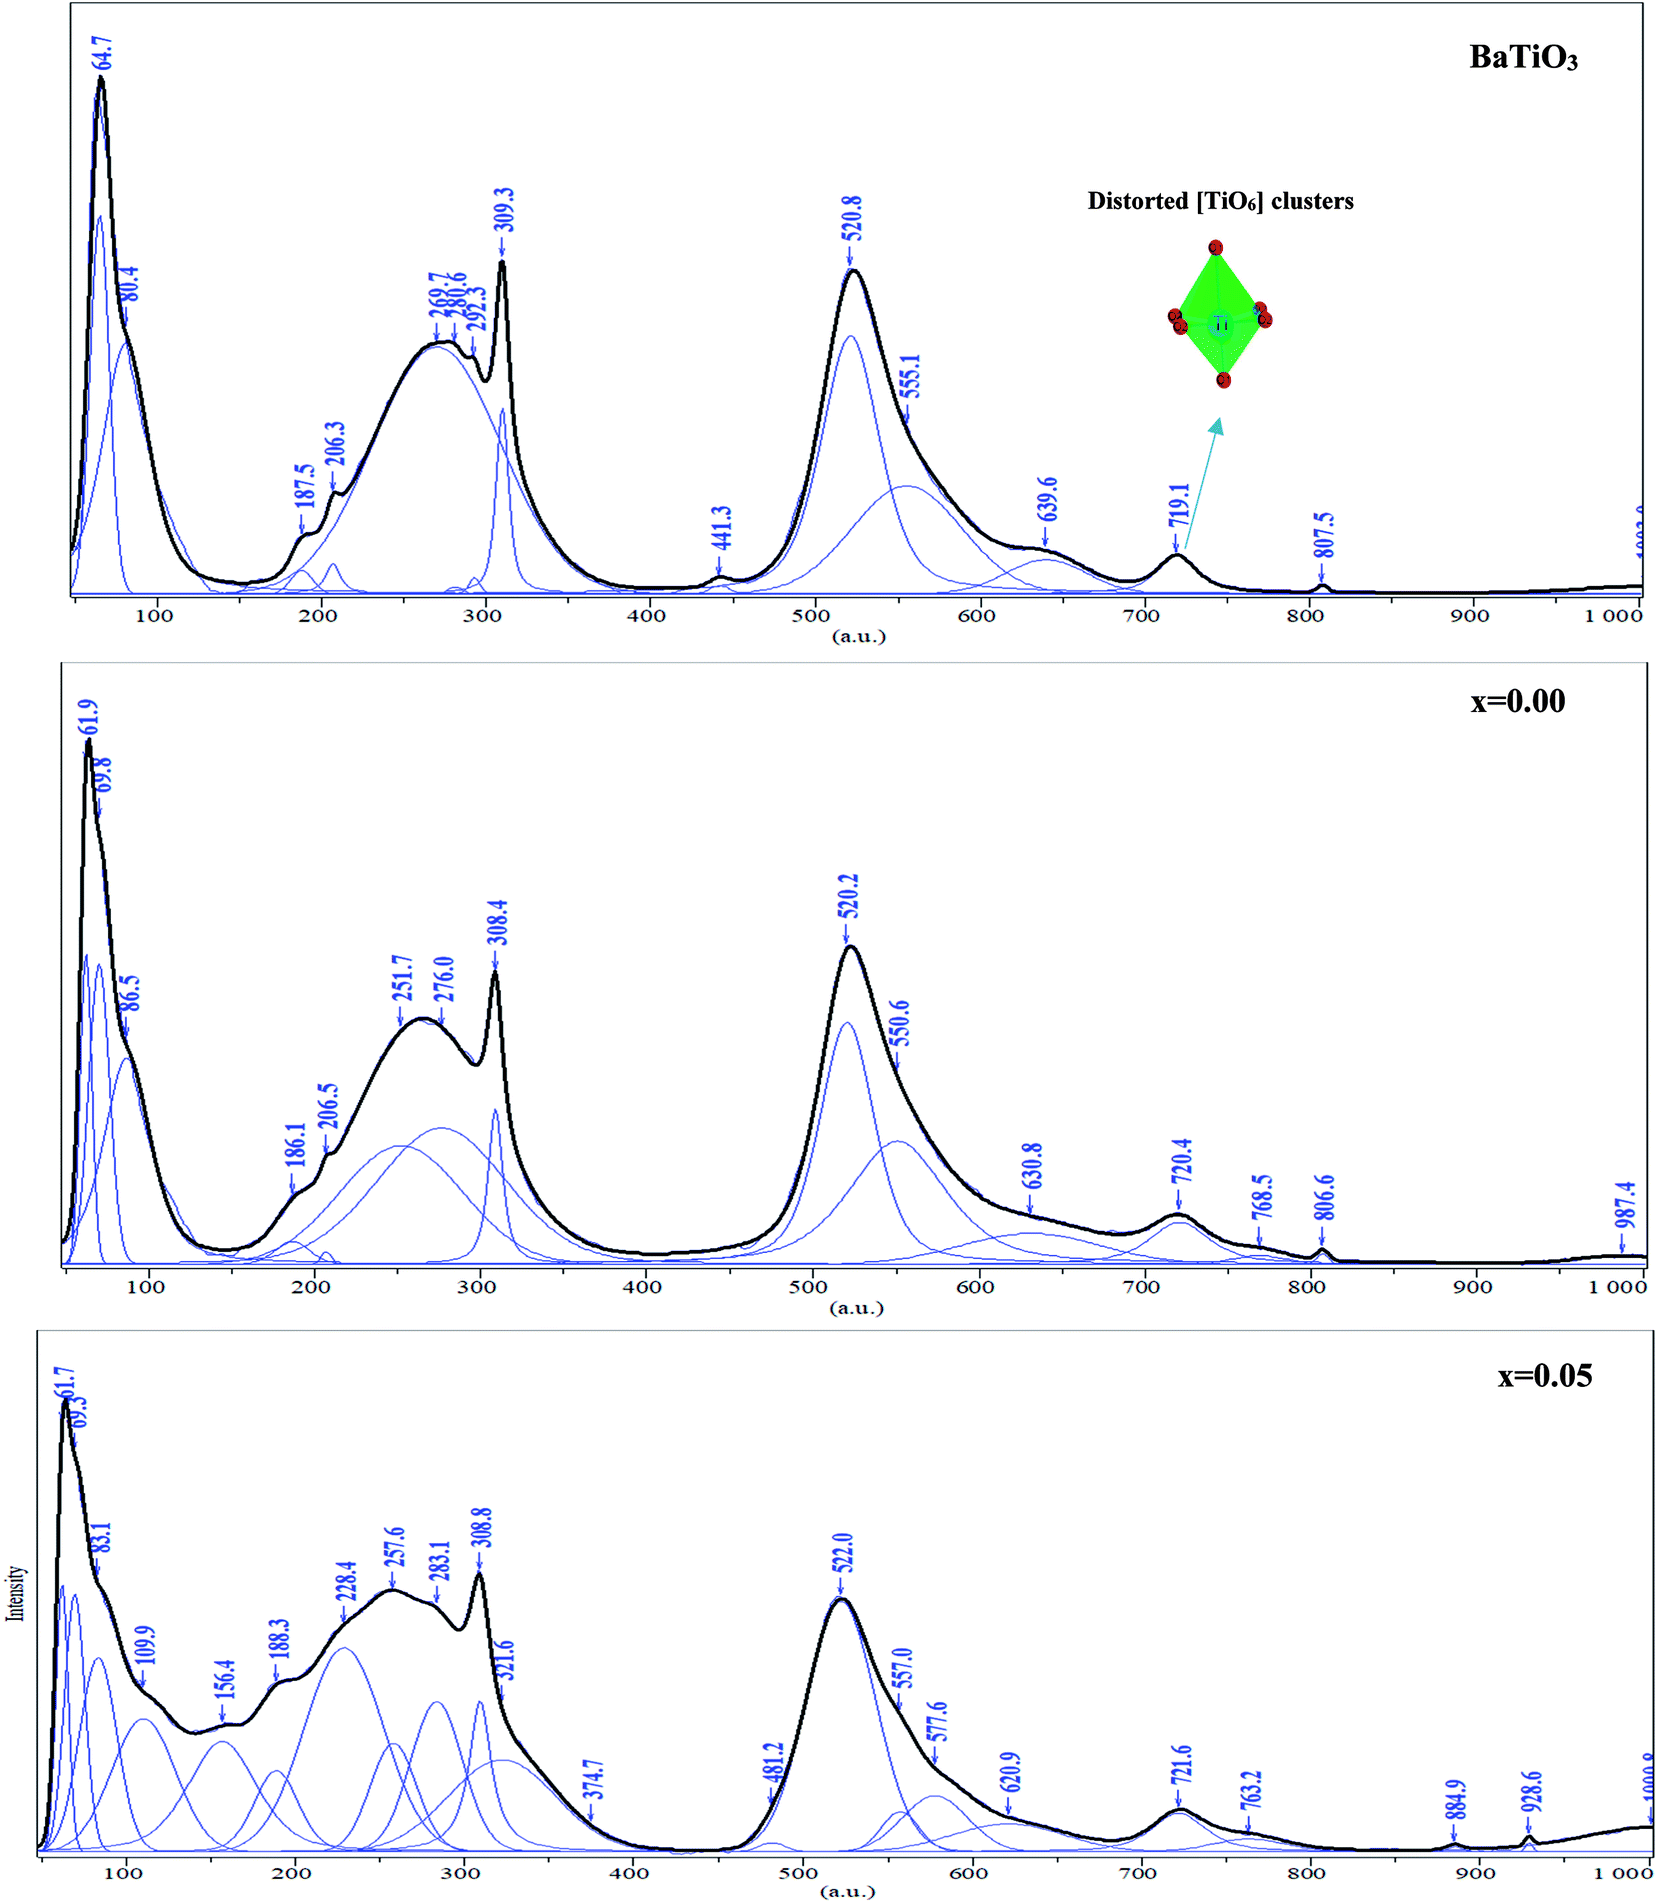 | ||
| Fig. 3 Raman spectra deconvolution of the region between 50 and 1000 cm−1 at room temperature for BaTiO3, Ba0.97Nd0.0267Ti(1−x)WxO3 (x = 0.00 and x = 0.05). | ||
| Raman modes (cm−1) | BT | Ba0.97Nd0.0267Ti(1−x)WxO3 | BT single crystal Freire et al.18 | Pure BT Shiratori et al.19 | |
|---|---|---|---|---|---|
| x = 0.00 | x = 0.05 | ||||
| A site vibration (Ba–O/Nd–O) | — | 61.7 | 61.9 | — | 59 |
| 64.7 | 69.3 | 69.8 | — | 66 | |
| E(TO1) | 80.4 | 83.1 | 86.5 | 38 | 38 |
| A1(LO1) | 187.5 | 186.1 | 188.3 | 180 | 180 |
| E(TO2) | 206.3 | 206.5 | 228.4 | 189 | — |
| A1(TO2) | 269.7 | 251.7 | 257.6 | 276 | 250 |
| 280.6 | 276.0 | 283.1 | — | 270 | |
| E(TO2 + LO2) | 309.3 | 308.4 | 308.8 | 308 | 306 |
| B1 | — | — | 321.6 | 308 | — |
| A1(LO2) + E(LO3) | 441.3 | — | 481.2 | 466 | 470 |
| A1(TO3) | 520.8 | 520.2 | 522.0 | 512 | 520 |
| 555.1 | 550.6 | 557.0 | — | — | |
| 639.6 | 630.8 | 620.9 | — | — | |
| E(LO4) | 719.1 | 720.4 | 721.6 | 722 | 720 |
| A1(LO3) | — | 768.5 | 763.2 | 740 | 838 |
| A1(LO) + E(LO3) | 807.5 | 806.6 | — | — | 800 |
| νBaWO4 | — | — | 884.9 | — | — |
| νBaWO4 | — | — | 928.6 | — | — |
| Second order | — | 987.4 | — | — | — |
As shown in Fig. 3a, the sample BT is characterized, in the low- to mid wavenumber region, by peaks at 64.7 and 80.4 cm−1 attributed to the A-site vibration in the pervoskite,17 a broad A1(TO2) mode at 269.7 cm−1 assigned to TiO6 bending vibrations, an interference dip A1(TO1) anti-symmetric mode at 187.5 cm−1 and a mode at 309.3 cm−1, which appears only in the presence of a long-range ferroelectric phase.19 Modes A1(TO1) and A1(TO2) suggesting the existence of single-domain single-crystals of tetragonal BT.20
In the high-wavenumber region (>500 cm−1), vibrations associated with the oxygen octahedra are present. The A1(TO3) mode at 520.8 cm−1 corresponds to the O–Ti–O symmetric stretching vibration of the octahedral [TiO6] cluster (inset Fig. 3a).
Modes observed at 555.1 and 639.6 cm−1 are dominated by vibrations involving mainly oxygen displacements21 and the last peak occurs only in small particle size samples.22 The peak at 719.1 cm−1 can be labeled as A1(LO3) + E(LO4) mode associated with distortion of BO6 octahedra in ferroelectric phase. Both bands observed at 309.3 cm−1 and 719.1 cm−1 clearly confirm the presence of the tetragonal phase of ferroelectric BT.23 Whereas the peak at 807.5 cm−1 corresponds to the A1(LO) + E(LO3) mode.24
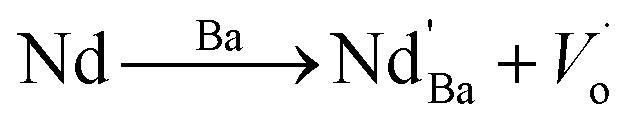
Additionally, as shown in Fig. 3b, a band of 768.5 cm−1 [A1g] appeared at x = 0.00. Since the A1g octahedral breathing mode (related to oxygen octahedral vibration) is Raman inactive in pure BT (Fig. 3a),25 the 768.9 cm−1 band in this research indicates that Ti–O structure must be modified and the oxygen octahedron became asymmetric, which was consistent with the research of Pokorny et al.26 In this research, the 768.9 cm−1 band is responsible for the substitution of Nd3+ at Ba site and accompanied the formation of oxygen vacancies,27 which can be described as:
A very weak band at 987 cm−1 is characteristic of the second-order Raman Spectra for BT.28
In the x = 0.05 sample, Fig. 3c, the incorporation of W6+ ions into the B-site induced clear changes in by the experimental Raman spectrum explained by the existence of the impurity in our compound (BaWO4) confirmed the two peaks observed at 884.9 and 928.6 cm−1 in the high wavelengths. In addition in the low wavelengths, the impurity existence a peaks at 109.9, 156.4, 321.6 and 374.7 cm−1 was confirmed also by the observation of Jayaraman et al.,29
Moreover, as shown in Fig. 3b and c, the position of Ag mode dramatically moved from 768.5 cm−1 for x = 0.00 to 763.2 cm−1 for x = 0.05, which is connected to the cation disorder/order usually observed in AB'1/3B′′2/3O3 complex perovskites such as Ba(Mg1/3Nb2/3)O3 ceramic.30 The substitution of W6+ on the B-site may enhance the driving force for the short range order (SRO). These results agree well with the results in the XRD (Fig. 1) patterns from the variation of c/a ratio and the volumes of cell parameter of x = 0.00 and x = 0.05 (Table 1).
In order to better understand the optical properties, we studies the FTIR spectra in the range 450–4000 cm−1 of the Ba0.97Nd0.0267Ti(1−x)WxO3 (x = 0.00 and x = 0.05) ceramics. These spectra are presented in Fig. 4. All samples exhibit a main transmission band around 515 cm−1 attributed to stretching vibrations of Ti–O octahedra. According to the literature, this prominent absorption band corresponds to the bending and stretching vibrations of the TiO6 octahedron at site B of the ABO3 perovskite.31 The appearance of the band at 809 cm−1 for the x = 0.05 sample is associated with the stretching vibrations of W–O of impurity BaWO4.32 These results confound the results found in the Raman spectrum (Fig. 3).
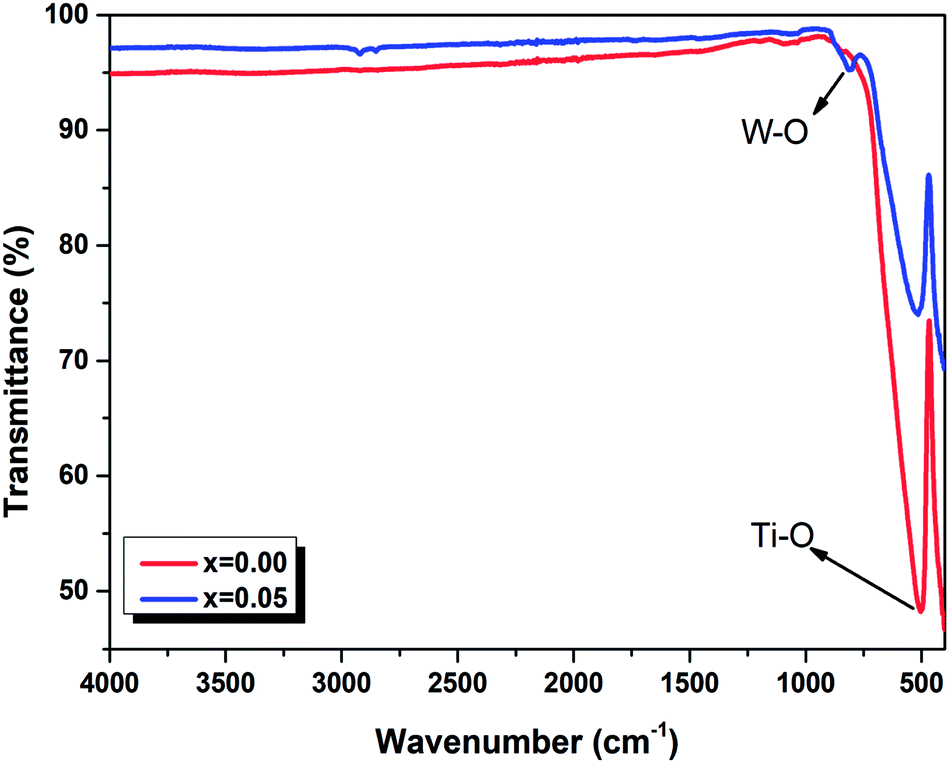 | ||
| Fig. 4 FTIR spectra of Ba0.97Nd0.0267Ti(1−x)WxO3 (x = 0.00 and x = 0.05) ceramics at room temperature. | ||
The only difference between the two compounds is summarized by the shift of the respective modes to the low frequencies with the incorporation of tungsten at B site, which can be explained by taking into consideration the random grain orientations in the ceramics and the grain size of the powder,33 as given in an earlier publication34 (such as the grain size DSEM = 175.35 nm for x = 0.00 and DSEM = 152.12 nm for x = 0.05). This interpretation has been included in many cases of perovskite systems as reported by Suchanicz et al.35 that the Raman and also FTIR lines in ceramics, resulting from mode mixing and long range electrostatic force effects, shift remarkably to higher/lower values depending upon the size of the grains and depolarization fields. These observations report the correlation behavior between the structural and optical properties of the compounds which can be admitted to explain our results and their causes. In fact, additional insertion of tungsten cation in the compounds induced a modification in grain size, and a shift of the Raman and FTIR measurements.
The absorption spectra of Ba0.97Nd0.0267Ti(1−x)WxO3 (x = 0.00 and x = 0.05) ceramics in the visible and near infrared region at room temperature are shown in Fig. 5. The assignment of the observed absorption bands has been made according to the earlier studies on Nd3+ ions doped pervoskite ceramics.36 Both spectra consist of seven absorption bands located at 885, 804, 745, 681, 586, 522 and 474 nm, which correspond to the 4f–4f transition of Nd3+ ions from the ground state 4I9/2 to the excited states 4F3/2, (4F5/2 + 2H9/2), (4F7/2 + 4S3/2),4F9/2, (4G5/2 + 2G7/2), (4G9/2 + 2K13/2 + 4G7/2) and (2D3/2 + 2G11/2 + 2G9/2 + 2K15/2) respectively.37 The position and intensity (4G5/2 + 2G7/2) of rare earth ions is higher for than other transitions which are found to be very sensitive to the environment of the rare earth ion. This transition is known as hypersensitive transition (at 580 nm) because of its strong dependency on the environment of the neodymium ions.38
 | ||
| Fig. 5 Absorption spectrum of Ba0.97Nd0.0267Ti(1−x)WxO3 (x = 0.00 and x = 0.05) ceramics in the visible-NIR region at room temperature. All transitions start from the 4I9/2 ground state to the indicated levels. | ||
The absorption spectra were found similar for the different concentrations of WO3 with a change in the intensities of the absorption bands. However, a small shift towards longer wavelengths of the position of absorption bands was observed. This shift is related to the variation of the mean radius of the 4f layer of the rare earth ion.39
To determine the optical band gap energies of the samples, we made use of the following relation, proposed by Tauc,40 Davis and Mott:41
 | (1) |
| (αhν)2 = B(hν − Eg) | (2) |
We have plotted the variation of (αhν)2 against (hν) for all the samples. The values of direct optical band gap (Eg) for Ba0.97Nd0.0267Ti(1−x)WxO3 (x = 0.00 and x = 0.05) samples were obtained, as shown in Fig. 6, by extrapolating the straight line on the curves to hν axis at (αhν)2 = 0. The Eg values are presented in Table 3. These results are close to those reported by Jiang et al.44 for the sample BaTiO3:2% Nd3+ films (3.49 eV), M. Dhanalakshmi et al.45 for BaTiO3:1%Nd3+ nanophosphors (3.29 eV), Kappadan et al.46 BaTiO3 (3.12 eV) prepared by polymeric complex method.47
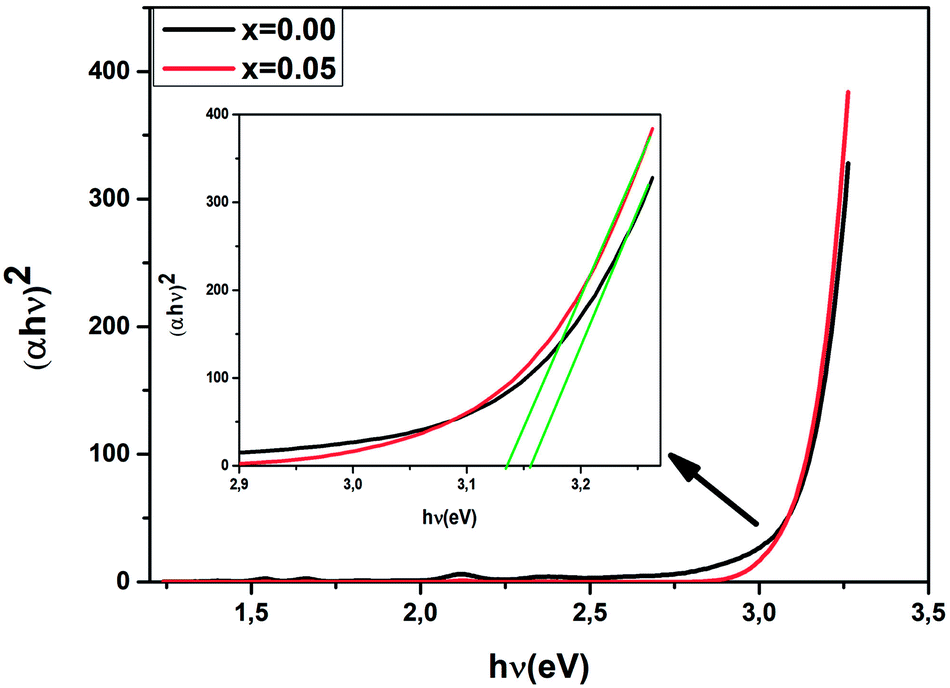 | ||
| Fig. 6 Energy band gap as a function of Ba0.97Nd0.0267Ti(1−x)WxO3 (x = 0.00 and 0.05) ceramics. | ||
| x = 0.00 | x = 0.05 | |
|---|---|---|
| Eg(eV) | 3.15 | 3.13 |
| Eu(eV) | 0.16 | 0.19 |
| Transitions Nd3+ in BNTx | Number of photons | |
|---|---|---|
| 4F3/2 → 4I9/2 | 1.53 | 1.5 |
| 4F3/2 → 4I11/2 | 1.47 | 1.4 |
| 4F3/2 → 4I13/2 | 1.49 | 1.7 |
The width of defect bands formed in the band gap is associated with Urbach energy Eu.48 It could be determined from the following eqn:
 | (3) |
The Urbach energy Eu was calculated by plotting ln(α) versus photon energy (hv) (Fig. 7).
 | ||
| Fig. 7 Plot ln(α) versus photon energy (hv) for Ba0.97Nd0.0267Ti(1−x)WxO3 (x = 0.00 and 0.05). | ||
The Eu values are also summarized in Table 3. A slight increase in the Urbach energy values is noticed with the addition of W6+ ions.
Finally, when W6+ is incorporated in Ba0.97Nd0.0267Ti(1−x)WxO3 ceramic, the band gap decreases and the Urbach energy increases. This result clearly demonstrates the formation of intermediate states in the band gap and a reduction in the gap values.
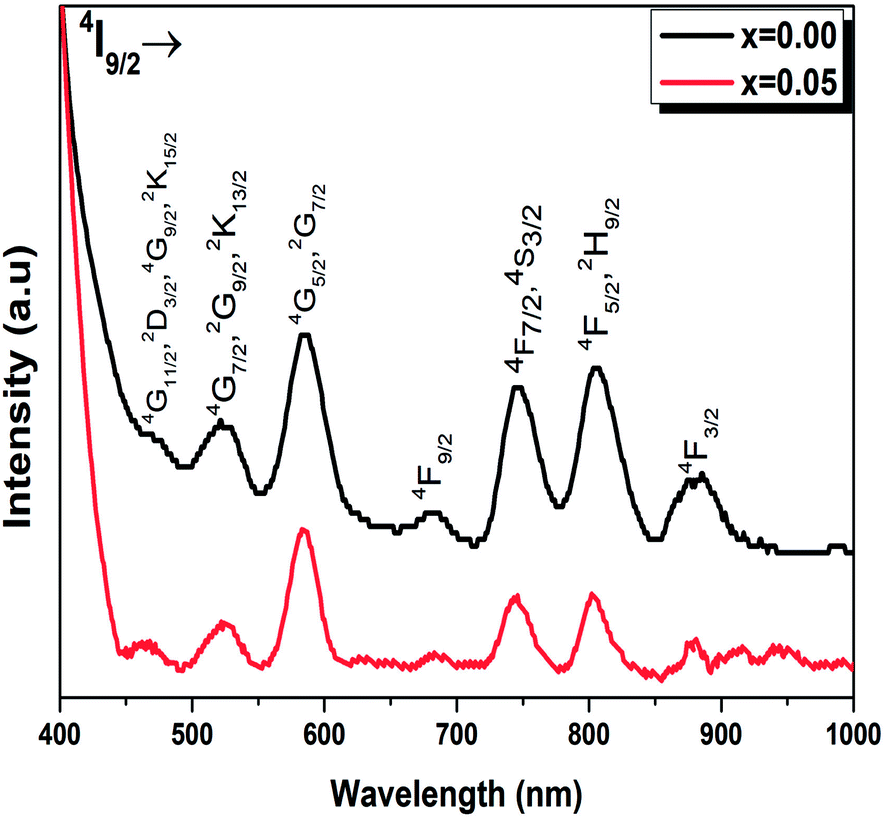
The room temperature emission spectra of the Ba0.97Nd0.0267Ti(1−x)WxO3 (x = 0.00 and x = 0.05) ceramics, are shown in Fig. 8. The emission spectra consists of three centered large and non-symmetric bands, which mainly originates from the radiative transition due to the electrical dipole transitions among 4f–4f of Nd3+ ions, near 880, 1058 and 1340 nm. These emission bands correspond to 4F3/2 → 4I9/2, 4F3/2 → 4I11/2 and 4F3/2 → 4I13/2, respectively.
 | ||
| Fig. 8 Down-conversion emission spectra of the Ba0.97Nd0.0267Ti(1−x)WxO3 ceramics excited at 514 nm at room temperature. Inset schematic energy level scheme of Nd3+ ions in Ba0.97Nd0.0267Ti(1−x)WxO3 (x = 0.00 and x = 0.05). | ||
As seen from Fig. 8, the PL intensities of Ba0.97Nd0.0267Ti(1−x)WxO3 decreased with the addition of W6+ ions. The existence of W6+ makes it possible to find impurity BaWO4, which results in a contraction of the lattice. In this condition, the Nd3+ ions will get much closer to each other, which enhance their interaction and results in the exhaustion of their emission by non-radiative energy transfer. The experimental results strongly showed that photoluminescence is directly related to the structural disorder. Similar results were reported by Q. Zhang et al., in (K0.5Na0.5)NbO3:Sm3+/Zr4+ materials.49 For the present sample, W6+ ion-doped Ba0.97Nd0.0267TiO3 at B sites induce the local lattice distortion, confirmed by the results obtained in Raman Fig. 3. Nevertheless, the experimental data (the decrease PL intensities and no shift of emission peaks) show that W6+ substitution does give rise to distinct influence on the emission intensity and crystal structure.
The energy level diagram of Nd3+ ions is given in the inset of Fig. 8. Under the excitation of 514 nm, the Nd3+ ions are excited from ground state 4I9/2 to 4G9/2–2K15/2 levels. The population in the 4G9/2, 2K15/2 levels decays non-radiatively by fast and successive multiphonon relaxation processes to the 4F3/2 state, from which infrared emission arises at 880, 1058 and 1340 nm corresponding to 4F3/2 → 4I9/2, 4F3/2 → 4I11/2 and 4F3/2 → 4I13/2 transitions, as shown in Fig. 8.
To produce the DC in the BNTx ceramics it is important to understand the DC emissions during the excitation power.
The DC PL spectra of the BNTx ceramics under the excitation of 514 nm laser for the different excitation power, are presented in Fig. 9. It is noteworthy that the PL intensity increases with the increment of excitation power.
 | ||
| Fig. 9 (a) and (b) PL intensity of Ba0.97Nd0.0267Ti(1−x)WxO3 (x = 0.00 and x = 0.05) at 10 K at different excitation power densities, respectively. | ||
In order to identify the process behind the observed emissions, we have measured the emissions intensities as a function of excitation power at 10 K. The relationship between DC emission intensity (IDC) and the excitation power (Pexc) can be represented by the following formula:50
| IDC ∝ (Pexc)n | (4) |
Fig. 10 shows the logarithm variation of the integrated emissions intensities of the down-conversed fluorescence versus the excitation power at 10 K for BNTx ceramics. A linear fitting of the experimental data gave slopes representing the number of excitation photons required for the corresponding down-conversed emissions. The fitting n values are listed in Table 3. This results indicate that two photons are required to create these mechanisms.
 | ||
| Fig. 10 (a) and (b) log–log plot of PL intensity versus excitation power density for x = 0.00 and x = 0.05 at 10 K. | ||
Generally, the emission intensity decreases gradually with increasing temperature, due to the enhancement of the nonradiative transition probability while the phosphor is heated.51
The temperature-dependent PL emission spectra of the BNTx (x = 0.00 and x = 0.05) under 514 nm of excitation wavelength is depicted in Fig. 11.
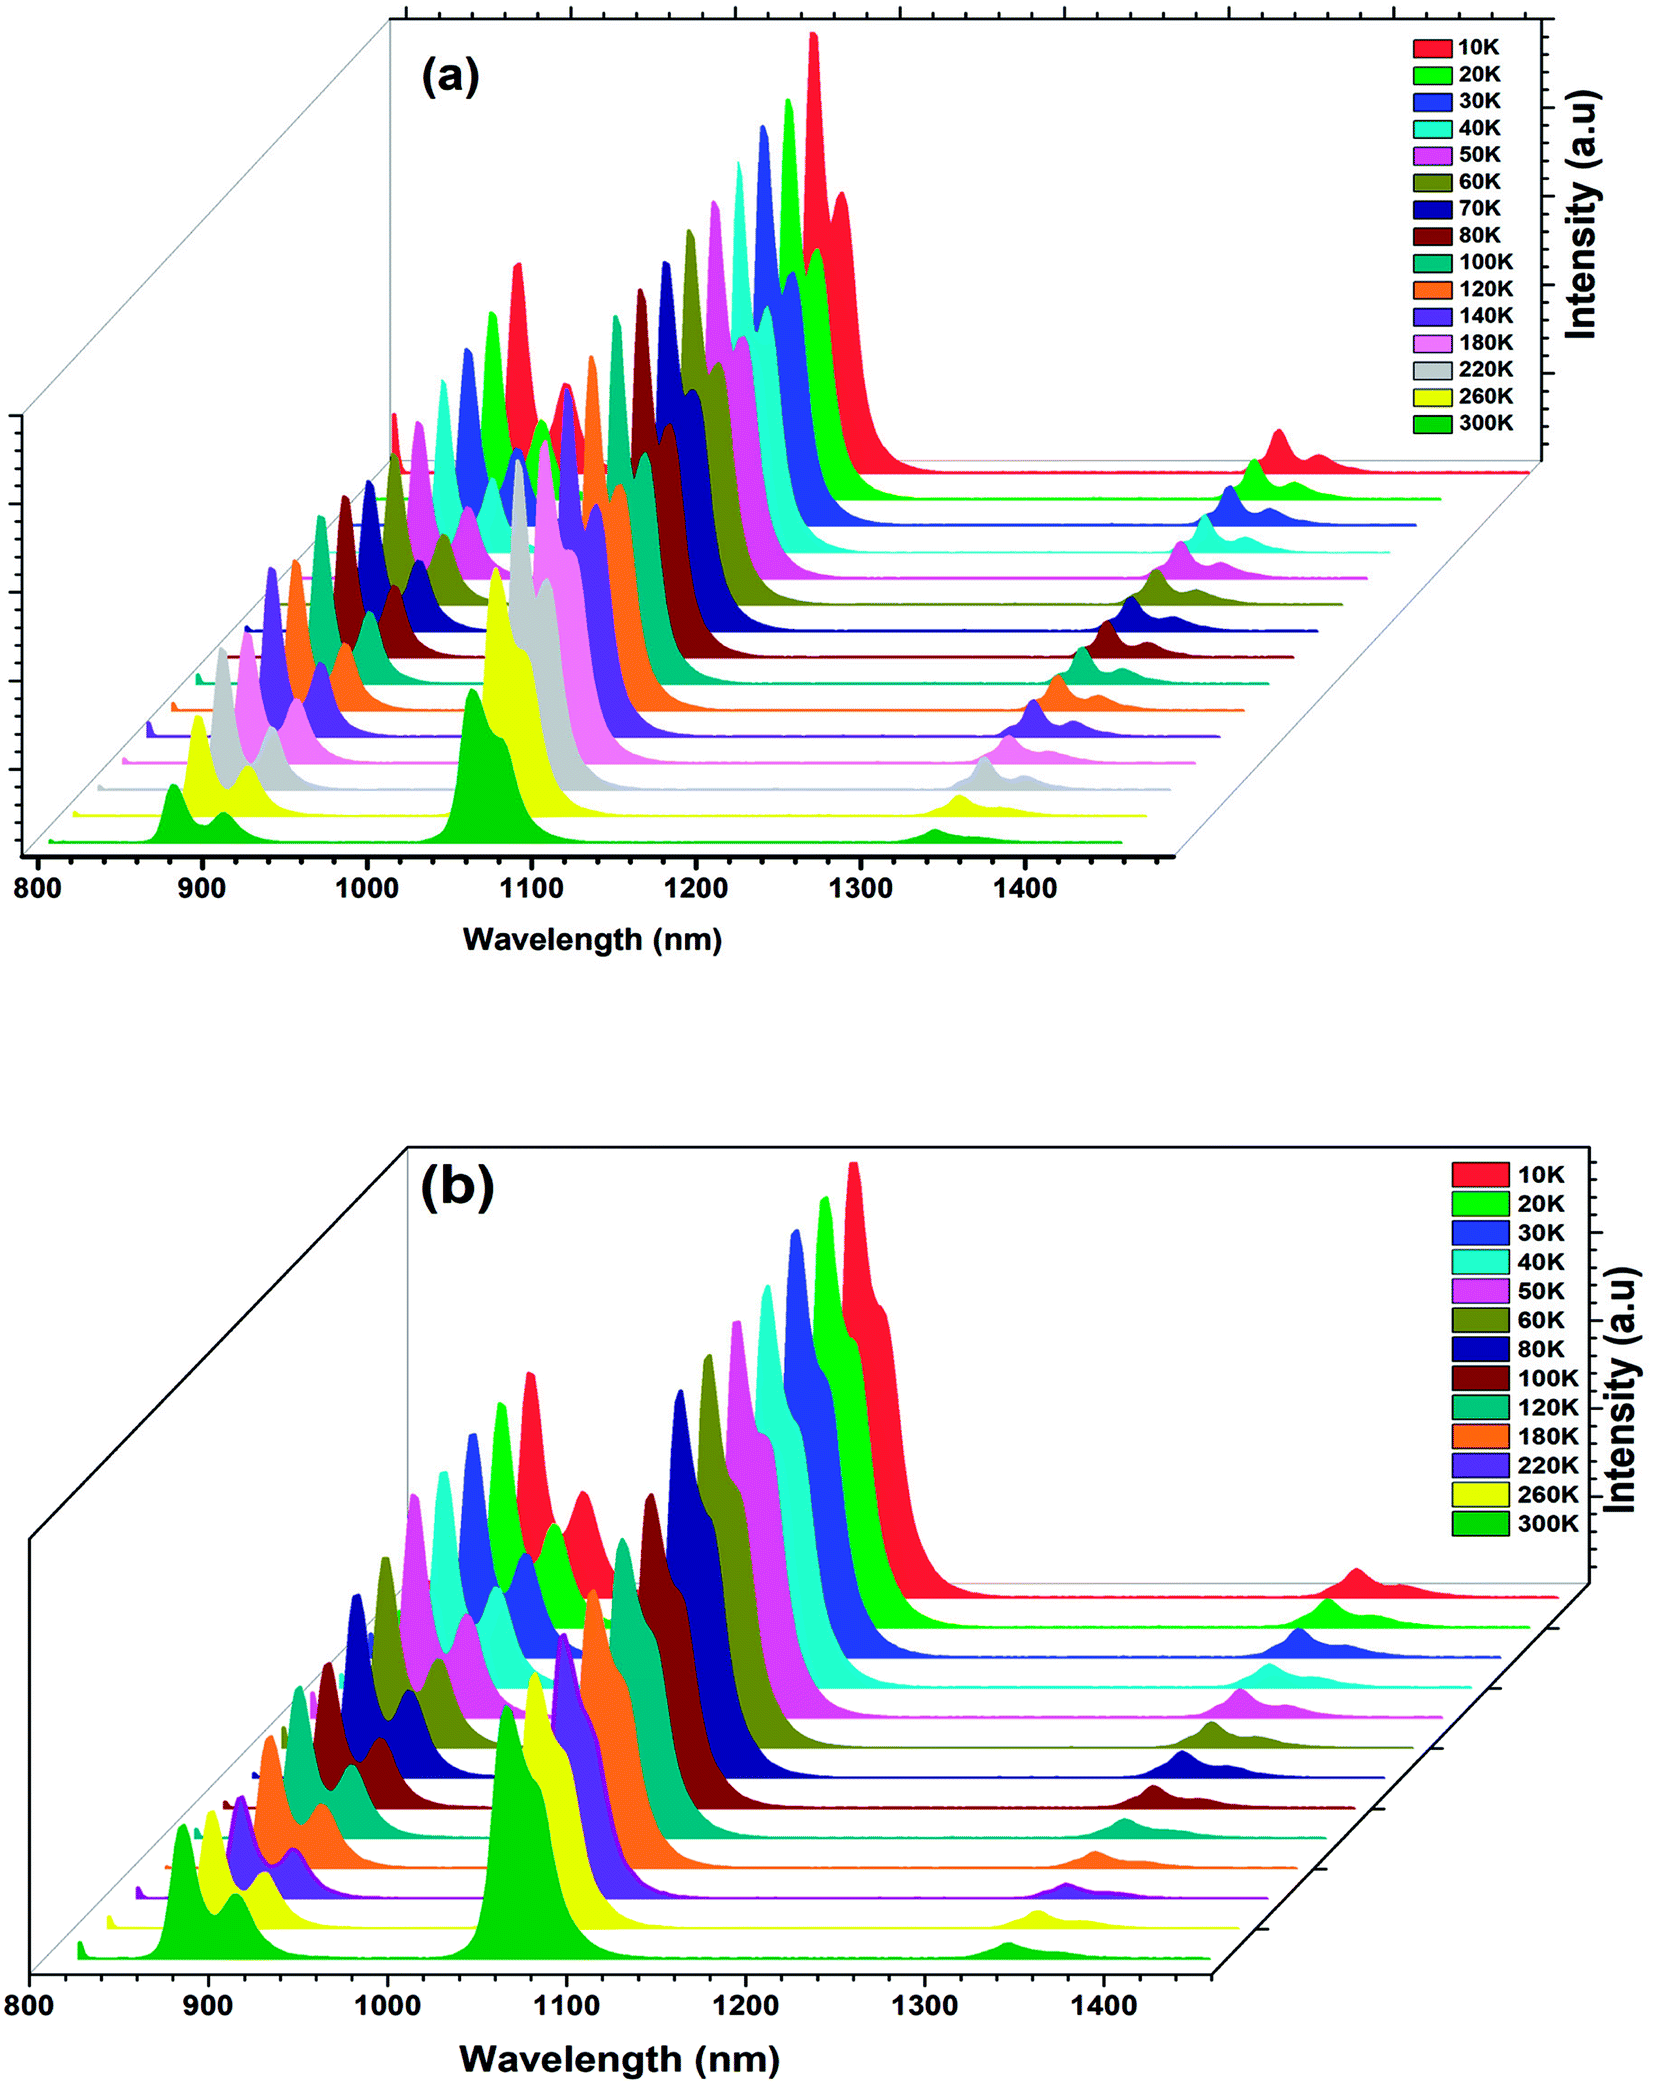 | ||
| Fig. 11 (a) and (b) Temperature-dependent PL emission spectra of the Ba0.97Nd0.0267Ti(1−x)WxO3 (x = 0.00 and x = 0.05) ceramics. | ||
From the emission spectra, we notice that the PL intensity gradually decreased with increasing the temperature from 10 to 300 K and the overall shape and position of the emission spectra remained unchanged as the temperature is increased.
This decrease is due to the temperature-dependence of the electron–phonon interaction. Mot is to say part the phonon vibrations increase with the increase of temperature.
To further understand the thermal activation energy can be determined from an Arrhenius plot of the integrated intensity of the emission against reciprocal temperature as given by:52
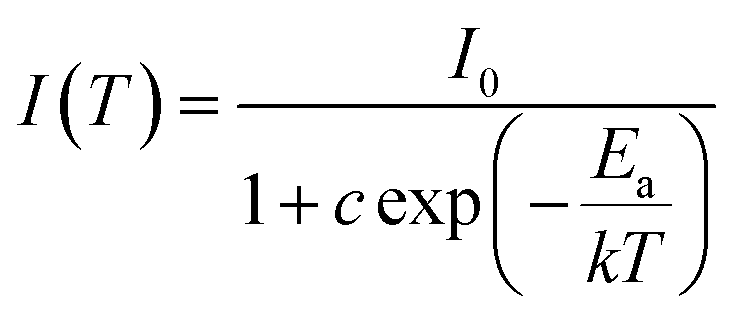 | (5) |
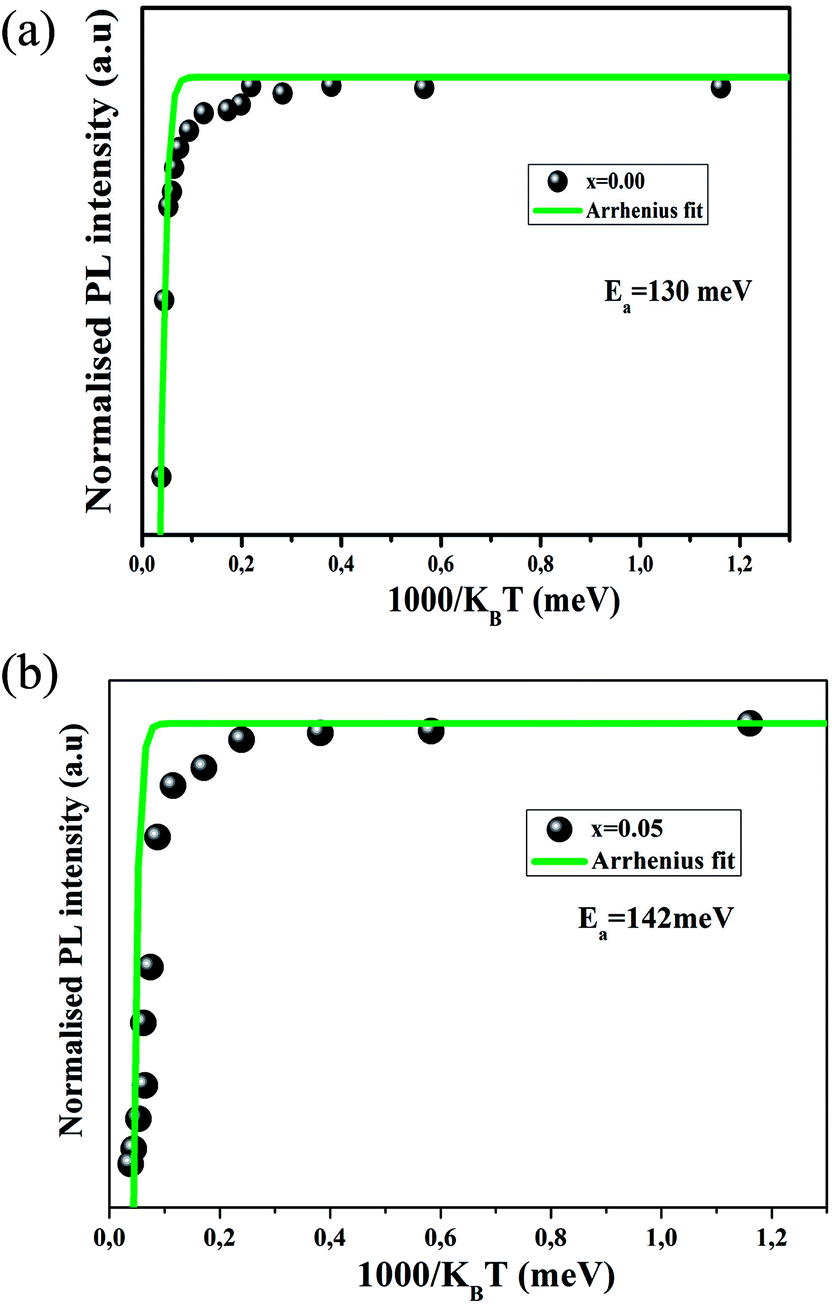 | ||
| Fig. 12 (a) and (b) Evolution of the integrated intensity versus the inverse of the temperature (black scatters) and the corresponding best fit (continuous green line), for x = 0.00 and x = 0.05 samples, respectively. | ||
The value of Ea obtained here using the fitting for the experimental data are found to be Ea = 130 meV for the x = 0.00 sample, and Ea = 142 meV for the x = 0.05 sample. Based on literature, the phonon energy of PLZT is about 100 meV.53
The Ea values are lower, which can be explained by the non-radiative transition and the good thermal stability of both samples.54 It is worth pointing out that the thermal activation energies for both samples are close to the phonon energy.
Increasing the W6+ concentration in the host lattice led to a significant change of the optical properties and is explained by structural distortion and other parameters such as grain size. However, our investigation of this correlation between structural and optical proprieties proves that thanks to their optical sensitivity, and good thermal stability, our compounds could be good candidates for many practical applications in luminescent devices.
4. Conclusion
In this work, we have studied the structural and optical properties of Ba0.97Nd0.0267Ti(1−x)WxO3(x = 0.00 and x = 0.05) ceramic prepared by molten salt method. Raman spectroscopy revealed that all the prepared samples have perovskite phase and crystallize in the P4mm-tetragonal symmetry. Temperature-dependent photoluminescent spectra showed that the BNTx ceramics exhibit good thermal stability of photoluminescence in the temperature range from 10 K to 300 K, suggesting good thermal stability of the pervoskite.Conflicts of interest
There are no conflicts to declare.References
- J. H. Li, X. Z. Fu, J. L. Luo, K. T. Chuang and A. R. Sanger, Application of BaTiO3 as anode materials for H2S-containing CH4 fueled solid oxide fuel cells, J. Power Sources, 2012, 213, 69–77 CrossRef.
- H. M. Huang, H. Y. Li, X. X. Wang and X. Guo, Detecting low concentration of H2S gas by BaTiO3nanoparticle-based sensors, Sens. Actuators, B, 2017, 238, 16–23 CrossRef.
- Y. Okamoto and Y. Suzuki, Mesoporous BaTiO3/TiO2 Double Layer for Electron Transport in Perovskite Solar Cells, J. Phys. Chem. C, 2016, 120, 13995–14000 CrossRef.
- J. P. B. Silva, F. L. Faita, K. Kamakshi, K. C. Sekhar, J. A. Moreira, A. Almeida, M. Pereira, A. A. Pasa and M. J. M. Gomes, Enhanced resistive switching characteristics in Pt/BaTiO3/ITO structures through insertion of HfO2:Al2O3 (HAO) dielectric thin layer, Sci. Rep., 2017, 7, 46350 CrossRef PubMed.
- G. Singh, V. S. Tiwari, T. K. Sharma and P. K. Gupta, Temperature dependence photo-luminescence of Nd3+doped PLZT ceramic, J. Electroceram., 2010, 25, 89–92 CrossRef.
- C. R. Kesavulu, H. J. Kim, S. W. Lee, J. Kaewkhao, N. Wantana, E. Kaewnuam, S. Kothan and S. Kaewjaeng, Spectroscopic investigations of Nd3+ doped gadolinium calcium silica borate glasses for the NIR emission at 1059 nm, J. Alloys Compd., 2017, 695, 590–598 CrossRef.
- K. Lemanski, A. Gagor, M. Kurnatowska, R. Pazik and P. J. Deren, Spectroscopic properties of Nd3+ ions in nano-perovskite CaTiO3, J. Solid State Chem., 2011, 184, 2713–2718 CrossRef.
- C. He, Y. Zhang, L. Sun, J. Wang, T. Wu, F. Xu, C. Du, K. Zhu and Y. Liu, Electrical and optical properties of Nd3+-doped Na0.5Bi0.5TiO3 ferroelectric single crystal, J. Phys. D: Appl. Phys., 2013, 46, 245104 CrossRef.
- D. Shihua, S. Tianxiu, Y. Xiaojing and L. Guanghua, Effect of Grain Size of BaTiO3 Ceramics on Dielectric Properties, Ferroelectrics, 2010, 402, 55–59 CrossRef.
- M. Venkateswarlu, S. k. Mahamuda, K. Swapna, M. V. V. K. S. Prasad, A. S. Rao, A. Mohan Babu, S. Shakya and G. V. Prakash, Spectroscopic studies of Nd3+ doped lead tungsten tellurite glasses for the NIR emission at 1062 nm, Opt. Mater., 2015, 39, 8–15 CrossRef.
- M. Guzik, M. Bieza, E. Tomaszewicz, Y. Guyot, E. Zych and G. Boulon, Nd3+ dopant influence on the structural and spectroscopic properties of microcrystalline La2Mo2O9 molybdate, Opt. Mater., 2015, 41, 21–31 CrossRef.
- R. Bokolia, M. Mondal, V. K. Rai and K. Sreenivas, Enhanced infrared-to-visible up-conversion emission and temperature sensitivity in (Er3+, Yb3+, and W6+) tri-doped Bi4Ti3O12 ferroelectric oxide, J. Appl. Phys, 2017, 121, 084101 CrossRef.
- Y. R. D. Shannon, Acta Crystallogr., 1976, A32, 751 CrossRef.
- P. Xue, Y. Hu, W. Xia, H. Wu and X. Zhu, Molten-salt synthesis of BaTiO3 powders and their atomic-scale structural characterization, J. Alloys Compd., 2017, 695, 2870–2877 CrossRef.
- C. Chalfouh, A. Lahmar, S. Zghal, R. Hannachi, N. Abdelmoula and H. Khemakhem, Effects of lanthanide amphoteric incorporation on structural, electrical and photoluminescence properties of BaTi0.925(Yb0.5Nb0.5)0.075O3 ceramic, J. Alloys Compd., 2017, 711(15), 205–214 CrossRef.
- H. Kaddoussi, N. Abdelmoula, Y. Gagou, D. Mezzane, H. Khemakhem and M. Elmarssi, X-ray diffraction, dielectric and Raman spectroscopy studies of Ba1xNd2x/3(Ti0.9Zr0.1)O3 ceramics, Ceram. Int., 2014, 40, 10255–10261 CrossRef.
- M. Zannen, A. Lahmar, M. Dietze, H. Khemakhem, A. Kabadou and M. Es-Souni, Structural, optical and electrical properties of Nd-doped Na0.5Bi0.5TiO3, Mater. Chem. Phys., 2012, 134, 829–833 CrossRef.
- J. D. Freire and R. S. Katiyar, Lattice dynamics of crystals with tetragonal BaTi03 structure, Phys. Rev. B: Condens. Matter Mater. Phys., 1988, 37, 2074 CrossRef.
- Y. Shiratori, C. Pithan, J. Dornseiffer and R. Waser, Raman scattering studies on nanocrystalline BaTiO3 Part I – isolated particles and aggregates, J. Raman Spectrosc., 2007, 38, 1288–1299 CrossRef.
- Da-Y. Lu, X.-Y. Sun and M. Toda, A novel high-k ‘Y5V’ barium titanate ceramics co-doped with lanthanum and cerium, J. Phys. Chem. Solids, 2007, 68, 650–664 CrossRef.
- T. Mondal, S. Das, T. Badapanda, T. P. Sinha and P. M. Sarun, Effect of Ca2+ substitution on impedance and electrical conduction mechanism of Ba1−xCaxZr0.1Ti0.9O3 (0.00 ≤ x ≤ 0.20) ceramics, Phys. B, 2017, 508, 124–135 CrossRef.
- L. Ben Abdessalem, S. Aydi, A. Aydi, Z. Sassi, A. Maalej and H. Khemakhem, X-ray diffraction, dielectric, and Raman spectroscopy studies of BaSrTiO3–NaNbO3 ceramic, Appl. Phys. A, 2017, 123, 305 CrossRef.
- Z. Abdelkafi, G. Khasskhoussi, N. Abdelmoula and H. Khemakhem, Ferroelectric piezoelectric and Raman spectroscopy studies of BaTi0.925(Nb0.5Yb0.5)0.075O3 ceramic, Ceram. Int., 2015, 14839–14844 CrossRef.
- T. Mondal, S. Das, T. Badapanda, T. P. Sinha and P. M. Sarun, Effect of Ca2+ substitution on impedance and electrical conduction mechanism of Ba1−xCaxZr0.1Ti0.9O3 (0.00 ≤ x ≤ 0.20) ceramics, Phys. B, 2017, 508, 124–135 CrossRef.
- L. Ben Abdessalem, M. Ben Abdessalem, A. Aydi and Z. Sassi, Structural and dielectric properties of (Ba1−xSrx)0.93Na0.07Ti0.93Nb0.07O3 ceramics, J. Mater. Sci.: Mater. Electron., 2017, 28, 14264–14270 CrossRef.
- J. Pokorny, U. M. Pasha and L. Ben, Use of Raman spectroscopy to determine the siteoccupancy of dopants in BaTiO3, J. Appl. Phys., 2011, 109, 6–7 CrossRef.
- S. Hongbing, T. M. Semkow and A. S. Bhalla, Raman spectroscopy of Mg–Ta order–disorder inBaMg1/3Ta2/3O3, J. Phys. Chem. Solids, 1998, 59, 181–195 CrossRef.
- D. F. K. Hennings and H. Schreinemacher, Ca-acceptors in dielectric ceramics sintered inreductive atmospheres, J. Eur. Ceram. Soc., 1995, 15, 795–800 CrossRef.
- A. Jayaraman, B. Batlogg and L. G. VanUitert, Phys. Rev. B: Condens. Matter Mater. Phys., 1983, 28, 4774 CrossRef.
- Y. J. Jiang, L. Z. Zeng, R. P. Wang, Y. Zhu and Y. L. Liu, Fundamental and second-order Raman spectra of BaTiO3, J. Raman Spectrosc., 1996, 27, 31–34 CrossRef.
- D. Wang, R. Yu, S. Feng, W. Zheng, T. Takei, N. Kumada and N. Kinomura, Hydrothermal synthesis of perovskite-type solid solution of (1−x)BaTiO3·xLa2/3TiO3, Solid State Ionics, 2002, 151, 329–333 CrossRef.
- T. Thongtem, A. Phuruangrat and S. Thongtem, Characterization of MeWO4 (Me = Ba, Sr and Ca) nanocrystallines prepared by sonochemicalmethod, Appl. Surf. Sci., 2008, 254, 7581–7585 CrossRef.
- J. Pal Singh, S. Gautam, P. Kumar, A. Tripathi, J.-M. Chen, K. H. Chae and K. Asokan, Correlation between the dielectric properties and local electronic structure of copper doped calcium titanate, J. Alloys Compd., 2013, 572, 84–89 CrossRef.
- Z. Raddaoui, R. Lahouli, S. E. L. Kossi, J. Dhahri, K. Khirouni and K. Taibi, Structural and thermoelectric properties of Ba0.97Nd0.0267Ti0.95W0.05O3 ceramic, J. Alloys Compd., 2018, 765, 428–436 CrossRef.
- J. Suchanicz, I. J. Sumara and T. V. Kruzina, Raman and infrared spectroscopy of Na0.5Bi0.5TiO3 – BaTiO3 ceramics, J. Electroceram., 2011, 27, 45–50 CrossRef.
- G. Singh, R. Selvamani, V. S. Tiwari and A. K. Karnal, Spectroscopic investigations of Nd3+ doped PLZT ceramics on the basis of Judd–Ofelt theory, J. Lumin., 2017, 192, 1084–1088 CrossRef.
- M. Zannen, A. Lahmar, M. Dietze, H. Khemakhem, A. Kabadou and M. Es-Souni, Mater. Chem. Phys., 2012, 134, 829–833 CrossRef.
- T. Wei, Y. Tian, C. Tian, X. Jing, M. Cai, J. Zhang, L. Zhang and S. Xu, J. Alloys Compd., 2015, 618, 95–101 CrossRef.
- G. H. Beall and D. A. Duke, in Glass Sci. Technol, ed. D. R. Uhlmann and N. J. Kreidl, New York, Academic Press, 1983, vol. 1, p. 403 Search PubMed.
- J. Tauc, J Optical Properties of Solids, ed. F. Abeles, NorthHolland, Amsterdam, 1970, vol. 22, p. 903 Search PubMed.
- E. A. Davis and N. F. Mott, Philos. Mag., 1970, 22, 903 CrossRef.
- D. K. Singh, K. Mondal and J. Manam, Ceram. Int., 2017, 43, 13602–13611 CrossRef.
- F. Belkhiria, F. I. H. Rhouma, S. Hcini, M. Daoudi, H. Gammoudi, M. Amlouk and R. Chtourou, Polycrystalline La0.8Sr0.2GaO3 perovskite synthesized by sol-gel process along with temperature dependent photoluminescence, J. Lumin., 2017, 181, 1–7 CrossRef.
- W. Jiang, W. Cai, Z. Lin and C. Fu, Effects of Nd-doping on optical and photovoltaic properties of barium titanate thin films prepared by sol–gel method, Mater. Res. Bull., 2013, 48, 3092–3097 CrossRef.
- M. Dhanalakshmi, H. Nagabhushana, S. C. Sharma, R. B. Basavaraj, G. P. Darshan and D. Kavyashree, Mater. Res. Bull., 2018, 102, 235–247 CrossRef.
- S. Kappadan, T. W. Gebreab, S. Thomas and N. Kalarikkal, Mater. Sci. Semicond. Process., 2016, 51, 42–47 CrossRef.
- Z. Li, H. Xue, X. Wang and X. Fu, Characterizations and photocatalytic activity of nanocrystalline La1.5Ln0.5Ti2O7 (Ln = Pr, Gd, Er) solid solutions prepared via a polymeric complex method, J. Mol. Catal., 2006, 260, 56–61 CrossRef.
- F. Urbach, The Long-Wavelength Edge of Photographic Sensitivity and of the Electronic Absorption of Solids, Phys. Rev., 1953, 92, 1324 CrossRef.
- Q. Zhang, K. Chen, L. Wang, H. Sun, X. Wangc and X. Hao, A highly efficient, orange light-emitting (K0.5Na0.5)NbO3:Sm3+/Zr4+ lead-free piezoelectric material with superior water resistance behavior, J. Mater. Chem. C, 2015, 3, 5275 RSC.
- L. Luo, P. Du, W. Li, W.Tao and H. Chen, Effects of Er doping site and concentration on piezoelectric, ferroelectric,and optical properties of ferroelectric Na0.5Bi0.5TiO3, J. Appl. Phys., 2013, 114, 124104 CrossRef.
- S. Murakami, M. Morita, M. Herren, T. Sakurai and D. Rau, Near-infrared luminescence and spectral anomalyin PLZT ceramics doped with Nd3+, Er3+, Yb3+and Cr5+ ions at low temperatures, J. Lumin., 2000, 87–89, 694–696 CrossRef.
- B. Smiri, I. Fraj, F. Saidi, R. Mghaieth and H. Maaref, Effect of piezoelectric field on type II transition in InAlAs/InP (311) alloys with different substrate polarity, J. Alloys Compd., 2018, 736, 29–34 CrossRef.
- G. Singh, V. S. Tiwari, T. K. Sharma and P. K. Gupta, Temperature dependence photo-luminescence of Nd3+doped PLZT ceramic, J. Electroceram., 2010, 25, 89–92 CrossRef.
- J. Rihani, V. Sallet, N. Yahyaoui, J. C. Harmand, M. Oueslati and R. Chtourou, Interdot carrier's transfer via tunneling pathway studied from Photoluminescence spectroscopy, J. Lumin., 2009, 129, 251–255 CrossRef.
| This journal is © The Royal Society of Chemistry 2018 |