 Open Access Article
Preparation and application synthesis of magnetic nanocomposite using waste toner for the removal of Cr(VI)†
Hong Zhua,
Yucheng Zhoua,
Shengsen Wangab,
Xiaoge Wua,
Jianhua Houab,
Weiqin Yina,
Ke Fengab,
Xiaozhi Wang *abc and
Jie Yangd
aCollege of Environmental Science and Engineering, Yangzhou University, Jiangsu 225127, China. E-mail: xzwang@yzu.edu.cn
bJiangsu Collaborative Innovation Center for Solid Organic Waste Resource Utilization, Nanjing 210095, China
cInstitutes of Agricultural Science and Technology Development, Yangzhou University, Yangzhou 225127, Jiangsu, China
dKey Laboratory of Crop and Livestock Integration, Ministry of Agriculture, Nanjing 210095, China
First published on 2nd August 2018
Abstract
In this study, a novel magnetic nanocomposite was prepared using waste toner (WT) through high temperature decomposition, and calcination was conducted in different atmospheres (air, ammonia, and vacuum). WT calcined in ammonia (WT(NH3)), and it was then utilized as an efficient absorbent for the reduction of Cr(VI) in aqueous solutions; a batch experiment with different conditions was performed to investigate its Cr(VI) removal ability. The effects of two pH-regulating acid (HCl and H2SO4) treatments were also studied. It was found that WT(NH3) could remove about 99% Cr(VI) at pH 2 under H2SO4 treatment. The XRD and TEM results coupled with VSM results confirmed that WT(NH3) is an Fe3O4/Fe2N nanohybrid, which possesses excellent water-dispersibility and remarkable magnetic properties. XPS analysis showed the presence of Cr(VI) and Cr(III) on the surface of WT(NH3), which indicated that Cr(VI) was reduced to Cr(III). Furthermore, H2SO4 regulation also promoted the reduction of Cr(VI) by WT(NH3), and this reduction was higher than that obtained by HCl regulation.
1. Introduction
Chromium (Cr) is a very common and toxic heavy metal, and it is usually present in water and soil. Most Cr in the environment is released from industrial activities including tanning, textile preservation, electroplating, and sewage sludge.1,2 The hazards of chromium to the human body mainly include skin and respiratory ulcers, meningitis, and lung cancer.3 Thus, the US Environmental Protection Agency has recommended that the Cr concentration should be below 50 μg L−1 (ref. 4) in most natural waters. Cr is most frequently present in the hexavalent (Cr(VI)) or trivalent (Cr(III)) forms in aqueous solutions.5 These two common oxidation states of Cr are extremely different in charge, physicochemical properties and chemical and biochemical reactivities.6 In fact, the toxicity of Cr(VI) is five hundred times greater than that of Cr(III).7 Cr(VI) ions exist as chromate ions (CrO42−) and dichromate ions (Cr2O72−) in solution, and these ions are more soluble and mobile than Cr(VI) in ground water; they are also more capable of oxidizing other species.8 Therefore, several treatment methods have been applied such as ion exchange, electrolytic removal, chemical precipitation,9 adsorption,10 and reduction.11 Recently, reduction–sorption has been considered as an efficient and economically viable method for Cr(VI) removal. Moreover, Cr(VI) can be reduced to its less toxic form.12 However, this method requires absorbents that contain abundant active sites or functional groups.With the increasing demand for electronic and electrical equipment (EEE) in modern society, a significant amount of EEE waste (WEEE) is produced, and the major constituents of WEEE plastics include polypropylene (PP) and high-impact polystyrene (HIPS).13 To recycle WEEE, some researchers have prepared R-PP/R-HIPS blends by adding polystyrene–poly(ethylene/propylene) (SEP) or glycidyl methacrylate (GMA) to obtain functional polymer nanocomposites.14 Also, it has been reported that near-critical water can be used to recycle printed circuit boards for the collection of copper foils and fabrics.15 The overuse of printing equipment has led to a significant increase in the number of waste toner cartridges.16 Powdery waste toner (WT) accounts for 8.0 wt% of a toner cartridge. Also, the weight of WT has reached about 36 t per year in China. Furthermore, if WT is disposed without reasonable management, its toxic components, including hazardous organic components, will be released into the environment, which can pollute the soil, underground water and air; this will be a tremendous threat to the human health.17 In fact, WT is a mixture that includes about 7.0 wt% polyacrylate, 55.0 wt% polystyrene, 3.0 wt% SiO2, and 35.0 wt% Fe3O4.18–20 In recent years, very few researchers have studied the recycling and transformation of WT. The method of vacuum-gasification-condensation was used to treat WT since the organic matter in WT can be decomposed and gasified at high temperature. Meanwhile, SiO2 and Fe3O4 in WT were transformed into nanosized Fe3O4 and nano-SiO2.19 A thermal transformation process was investigated to convert WT into 98% pure iron by using the gases collected during the thermal transformation as an in situ source of carbon.21
Recently, iron-bearing materials have been applied to various fields such as drug delivery, sensors, electromagnetic interference shielding, and adsorbents for environmental remediation.22–24 In the environmental field, iron-bearing materials such as magnetite,25,26 iron sulfides,27,28 goethite,29 and zerovalent iron30 can remediate Cr(VI). It has also been reported that fabric- and cellulose-derived magnetic carbon–iron nanomaterials possess high efficiency for Cr(VI) removal,31,32 where Cr(VI) is reduced to Cr(III) by the reductive intermediates generated from ZVI such as Fe(II). Moreover, the nanocarbon structure and different carbonization temperatures affect the Cr(VI) removal capacity.33,34 Also, Fe3O4 is a type of iron oxide, and it exhibits remarkable performance owing to its high efficiency of adsorbing Cr(VI) and reducing Cr(VI) to less toxic Cr(III).35 Furthermore, compared to traditional absorbents, this compound can be separated and recovered rapidly using an external magnetic field. It is known that Fe3O4 nanoparticles can be obtained by calcining WT. Although the calcination of WT has been previously studied, its calcination under different atmospheres and Cr(VI) uptake using the resultant nanoparticles have not been well investigated.
In this study, we attempted to develop a novel low-cost magnetic nanocomposite by recycling waste toner through high-temperature decomposition. Calcination was conducted in air, ammonia and vacuum to explore the influence of atmosphere on WT modification. Due to the unique properties of the materials, we used different acids to adjust the pH value during the experiments, and the results showed significant difference. The aim of this study is to characterize the as-prepared WTs, evaluate their applicability for Cr(VI) adsorption and reduction, and explore the mechanisms of Cr(VI) removal.
2. Materials and methods
2.1 Reagents
Cr(VI) aqueous solution was prepared by dissolving potassium dichromate (K2Cr2O7). pH adjustment was carried out using 0.1 M HCl, 1.1 M H2SO4 and 0.1 M NaOH. All the reagents were of analytical grade and purchased from the Sinopharm Chemical Reagent Co., Ltd. (Shanghai China). Deionized (DI) water was used to prepare the chemicals. WT was collected from HP toner cartridges in printing shops from Yangzhou University.2.2 Preparation
To prepare the magnetic nanomaterials in this study, WT was calcined in a tube furnace at 600 °C at a heating rate of 5 °C min−1 for two hours in an atmosphere of air, vacuum, and ammonia. The material was then cooled to ambient temperature, and the finally prepared WTs denoted as WT(Air), WT(Vac), and WT(NH3) were obtained by ball milling. Among them, the ammonia gas flow rate was 300–400 mL min−1. For comparison, the original WT without any treatment was also used in the experiments.2.3 Characterization
The surface morphology of WTs was examined via scanning electron microscopy (SEM, S-4800II) and transmission electron microscopy (TEM, TF-20) coupled with energy dispersive X-ray spectroscopy (EDS, Vario EL cube). Brunauer–Emmett–Teller (BET) specific surface areas were measured using Micromeritics ASAP 2460. Elemental oxidation states and functional groups were determined via X-ray electron spectroscopy (XPS, ESCALAB 250Xi). The structure and phase of the as-prepared WTs were analyzed with an X-ray diffractometer (XRD, D8-ADVANCE).2.4 Cr(VI) removal experiments
Batch experiments were performed to study the removal of Cr(VI) from aqueous solution using different WTs in 100 mL conical flasks containing 25 mL of solutions at the desired initial Cr(VI) concentrations and pH values. The most optimum dosage of WTs was determined by adding gradient concentrations ranging from 1 to 8 g L−1 during the experiment. The absorption and reduction of Cr(VI) (50 mg L−1) by WTs were performed using 0.1 M NaOH and two different pH-regulating acids (0.1 M HCl and 1.1 M H2SO4) to adjust the pH value.The mixture was placed on an Orbit shaker with continual mixing at 300 rpm. All experiments were carried out at the room temperature of 25 °C and were performed in duplicate. After reacting for a certain time, WTs were filtered through a 0.45 μm membrane, and the residual Cr(VI) concentration was determined using an ultraviolet visible (UV) spectrophotometer at λ = 540 nm, according to the 1,5-diphenylcarbazide colorimetric method.36 To measure total Cr concentration, the 1,5-diphenylcarbazide colorimetric method (with KMnO4) was used.37 Also, the leached iron in the solution was determined using the 1,10-phenanthroline spectrophotometry method.38
3. Results and discussion
3.1 Characteristics of as-prepared WTs
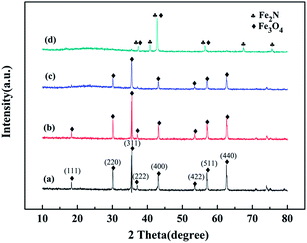
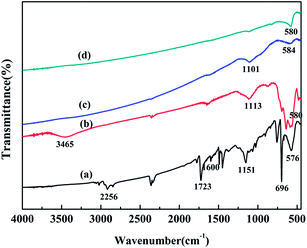
Fig. 1 shows the XRD patterns of the original WT, WT(Air), WT(Vac) and WT(NH3). The diffraction peaks of the original WT at the 2θ values of 30.1°, 35.58°, 43.11°, 53.45°, 57.13°, and 62.59° could be ascribed to the reflections of the (220), (311), (400), (422), (511), and (440) planes, respectively, which matched well with the standard pattern of JCPDS 019-0629 of the cubic lattice of Fe3O4. The characteristic peaks of Fe3O4 of WT(Air) and WT(Vac) were still observed. Based on the Debye–Scherrer equation, the average crystallite size of Fe3O4 nanoparticles was calculated from the (311) plane, and it was found that the crystals were about 43.5 nm in diameter.39 Fig. 1(d) shows clear Fe2N peaks, which are in accordance with PDF#50-0958,40 confirming that WT(NH3) is an Fe3O4/Fe2N nanohybrid. Furthermore, our results suggested that the chemical composition of the material can be changed by annealing at 600 °C in an ammonia atmosphere.As shown in Fig. 2, compared with the result for the spectrum of original WT, the organic groups disappeared in the spectra of WT(Air), WT(Vac) and WT(NH3). The band at 578 cm−1 was related to the vibration of the Fe–O functional group, which matched well with the characteristic peak of Fe3O4.41 This finding was in accordance with the XRD patterns. The weak peaks between 1101 and 1151 cm−1 were assigned to the Si–O–Si group antisymmetric stretching vibration modes, indicating the existence of SiO2 in the material.
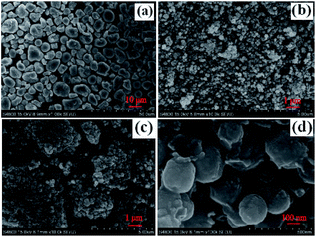
It can be seen from the SEM image (Fig. 3(a)) that original WT is a granular mixture with a diameter of about 5 μm. After calcination, Fe3O4 and SiO2 were retained in the residue. As shown in Fig. 3(b) and (c), WT(Vac) is found to be more aggregated than WT(NH3), which was in accordance with the TEM results (Fig. 4(b)). The Fe3O4/Fe2N nanoparticles displayed a spherical morphology with a mean diameter of 200 nm (Fig. 4(a)).
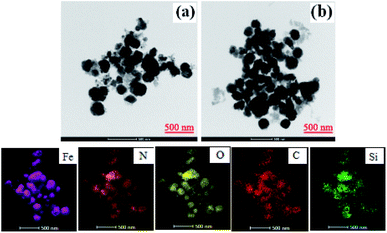 | ||
| Fig. 4 TEM images of (a) WT(NH3) and (b) WT(Vac) and the corresponding EDX elemental mappings of iron, nitrogen, oxygen, carbon, and silicon. | ||
To further verify the distribution and structure of the material, TEM images of WT(NH3) and WT(Vac) were obtained (Fig. 4). Both samples showed few tetragonal or spherical Fe2N species, and spherical Fe3O4 species were also observed. Furthermore, WT(NH3) had more phase interfaces of Fe3O4 and Fe2N than WT(Vac). The EDS and TEM mapping analysis revealed the presence of Fe, Si, C and O in WTs and Fe, Si, C, N and O in WT(NH3). Higher amount of N (8.6 wt%) was believed to be due to N-doping from annealing in ammonia (Table 1).
| Sample | N | C | H | Fe |
|---|---|---|---|---|
| WT | 0.049 | 52.66 | 5.232 | 32.07 |
| WT(Air) | 0.012 | 0.11 | 0.420 | 56.54 |
| WT(Vac) | 0.068 | 9.66 | 0.322 | 66.41 |
| WT(NH3) | 8.641 | 7.50 | 0.357 | 69.56 |
The Brunauer–Emmett–Teller (BET) surface areas of WT(Air), WT(Vac) and WT(NH3) are shown in Table S1.† WT(NH3) has a larger surface area (42.53 m2 g−1) than WT(Vac) (11.93 m2 g−1) and WT(Air) (11.75 m2 g−1), which can improve mass transfer and increase the number of active sites.42 The pore volume is in good agreement with the surface area.
The XPS spectra of WT(NH3) depicted in Fig. 5 exhibit the presence of C, O, N, and Fe before the reaction. The C 1s spectra exhibit four peaks; the peaks at binding energies of 284.7 eV and 285.9 eV corresponded to C–H, C–C, and hydroxyl (C–OH) bonds, and the peaks at 287.5 eV (C![[double bond, length as m-dash]](https://www.rsc.org/images/entities/char_e001.gif) O, O–C–O) and 288.9 eV corresponded to the carbonyl (O–C
O, O–C–O) and 288.9 eV corresponded to the carbonyl (O–C![[double bond, length as m-dash]](https://www.rsc.org/images/entities/char_e001.gif) O) bond (Fig. 5(b)).43 Fig. 5(c) shows the high-resolution XPS spectra of the N peaks: pyrrolic-N at 400.5 eV, Fe–N at 399.3 eV, and pyridinic-N at 398.6 eV.44 Nitrogen was successfully doped into Fe3O4 and reacted with iron, which was consistent with Fe2N from XRD characterization. The XPS Fe 2p spectra of WT(NH3) showed two peaks centered at 710.9 eV and 724.1 eV, which were assigned to Fe 2p3/2 and Fe 2p1/2, respectively. For Fe 2p3/2, the peak at BE of 710.6 eV was assigned to ferrous iron in Fe3O4 (FeO·Fe2O3) and Fe2N, whereas that at 711.8 eV corresponded to Fe(III) in Fe3O4.45 Metallic iron was also observed at the binding energy of 707.5 eV based on the Fe 2p3/2 spectra. The satellite peak at 719.9 eV was much weaker, which further proved the absence of Fe3O4 rather than γ-Fe2O3.46 These results were consistent with the TEM and XRD results.
O) bond (Fig. 5(b)).43 Fig. 5(c) shows the high-resolution XPS spectra of the N peaks: pyrrolic-N at 400.5 eV, Fe–N at 399.3 eV, and pyridinic-N at 398.6 eV.44 Nitrogen was successfully doped into Fe3O4 and reacted with iron, which was consistent with Fe2N from XRD characterization. The XPS Fe 2p spectra of WT(NH3) showed two peaks centered at 710.9 eV and 724.1 eV, which were assigned to Fe 2p3/2 and Fe 2p1/2, respectively. For Fe 2p3/2, the peak at BE of 710.6 eV was assigned to ferrous iron in Fe3O4 (FeO·Fe2O3) and Fe2N, whereas that at 711.8 eV corresponded to Fe(III) in Fe3O4.45 Metallic iron was also observed at the binding energy of 707.5 eV based on the Fe 2p3/2 spectra. The satellite peak at 719.9 eV was much weaker, which further proved the absence of Fe3O4 rather than γ-Fe2O3.46 These results were consistent with the TEM and XRD results.
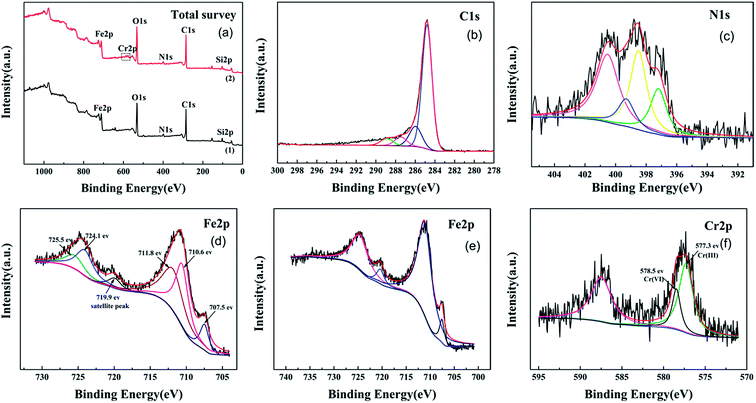 | ||
| Fig. 5 XPS total survey (a), C 1s (b), N 1s (c), Cr-unloaded Fe 2p (d), Cr-loaded Fe 2p (e), and Cr 2p's (f) spectra. | ||
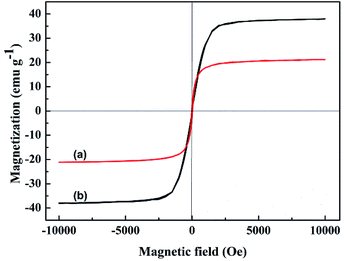
The magnetization curves of original WT and WT(NH3) were studied using a vibrating sample magnetometer (VSM) at an ambient temperature. The corresponding hysteresis loops are shown in Fig. 6, and the saturation magnetization of original WT was determined to be about 37.9 emu g−1, which decreased to 21.1 emu g−1 (WT(NH3)) after calcination in an ammonia atmosphere. This can guarantee its convenient separation from pollutants when used as an adsorbent.
3.2 Effect of sorbent on Cr(VI) removal
To compare the Cr(VI) removal efficiencies of WT(NH3), WT(Vac), WT(Air) and original WT, the best reaction conditions were obtained: an initial Cr(VI) concentration of 50 mg L−1 and sorbent dosage of 4 g L−1 at pH = 2.0.As shown in Fig. 7, Cr(VI) removal efficiencies decreased in the following order: WT(NH3) > WT(Vac) > WT(Air) > original WT. The effects of two pH-regulating acid (HCl and H2SO4) treatments were investigated. Under HCl treatment, WT(NH3) removed 78.2% of Cr(VI) compared to WT(Vac) and WT(Air), which removed 29.9% and 5.3% of Cr(VI), respectively. Also, there was only a slight difference between WT(Vac) and WT(Air) under the two acid treatments. However, for WT(NH3), its Cr(VI) removal efficiency was greatly affected. Within the first 1.5 h, its Cr(VI) removal efficiencies under HCl and H2SO4 treatments were almost identical. For HCl treatment, its efficiency showed only a gradually increasing trend after 2 h; on the contrary, its efficiency increased sharply with H2SO4 treatment, which resulted in 99.9% Cr(VI) removal after 7 h.
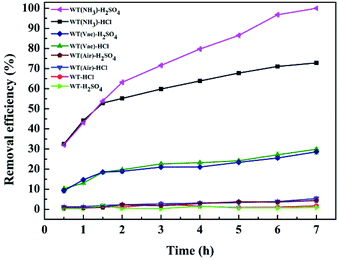 | ||
| Fig. 7 Removal efficiency of Cr(VI) using different systems with reaction time. Reaction conditions: 4 g L−1 as-prepared sorbents, 49.68 mg L−1 Cr(VI) concentration, and pH = 2.0. | ||
3.3 Cr(VI) removal kinetics and isotherms
The pseudo-second-order kinetic model was used to determine the potential rate-limiting step involved in the Cr(VI) removal process by WT(NH3) and WT(Vac) (Fig. S1†). The kinetic parameters and R2 were determined by linear regression (Table S2†). The calculated qe values of the pseudo-second-order kinetic model were close to the experimental data, indicating that the adsorption of Cr(VI) is mainly controlled by chemical adsorption. The k value of WT(Vac) was higher than that of WT(NH3), which revealed that WT(Vac) exhibited faster adsorption of Cr(VI) and lower adsorption capacity than WT(NH3).The linearized modeled isotherms are plotted in Fig. S2.† As shown, high correlation coefficients and good R2 values were obtained from the isotherm models described for the removal of Cr(VI) by WT(NH3) in both HCl and H2SO4 systems (Table S3†). The adsorption of Cr(VI) was well fitted by the Langmuir model than the Freundlich model, indicating that Cr(VI) removal by WT(NH3) is a monolayer adsorption process.
3.4 Effect of initial pH on Cr(VI) removal
The effect of initial pH on Cr(VI) removal by WT(NH3) was investigated, and it was shown that the Cr(VI) adsorption is strongly dependent on the values of solution pH (Fig. 8). It can be clearly observed that the removal efficiency of Cr(VI) decreased with an increase in the solution pH value. Specifically, the Cr(VI) removal efficiencies were 78.2% and 99.9% in the HCl and H2SO4 systems, respectively, at pH 2, and these values dropped sharply with an increase in pH to 3. Also, the pH increased after the reaction, which was possibly due to the consumption of H+ during the reduction of HCrO4− and Cr2O72− to Cr(III).47,48 At neutral pH, only 0.4–0.8% Cr(VI) was removed in the HCl and H2SO4 systems. With an increase in pH, the formation of Cr(VI) or Cr(III) precipitates was enhanced, which blocked the reactive sites.49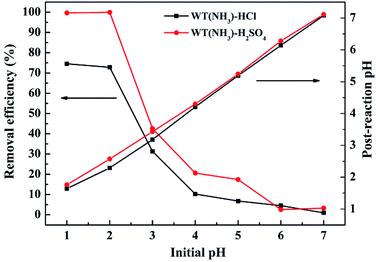 | ||
| Fig. 8 Effect of initial pH on Cr(VI) removal efficiency by WT(NH3). Reaction conditions: 4 g L−1 WT(NH3), 49.68 mg L−1 Cr(VI) concentration, and 7 h reaction time. | ||
To investigate the surface charge of WT(NH3), we measured its zeta potential (Fig. S3†). The isoelectric point of WT(NH3) was found to be about pH 2. Below this value, the surface of WT(NH3) was positively charged, which was beneficial to bind with chromium anions through electrostatic attraction and ion exchange. At high pH values, the surface of WT(NH3) became less positively charged, which might be unfavourable for Cr(VI) adsorption.50
3.5 Cr(VI) removal mechanisms
To investigate the Cr(VI) removal mechanism of WTs, both the XPS and EDS techniques were used to characterize the surface chemical composition of WT(NH3) before and after the reaction. After the reaction, some new peaks appeared, which coincided with those in the photoelectron spectra of Cr 2p. High resolution XPS spectra were used to clarify the state of Cr absorbed on the surface of WT(NH3), and the results are shown in Fig. 5(f). The Cr 2p spectra exhibited two peaks, namely, Cr 2p3/2 (577.6 eV) and Cr 2p1/2 (587.5 eV). Using XPS-peak-differentiating analysis, the Cr 2p3/2 spectra were deconvoluted into two major components at binding energies of 578.5 eV and 577.3 eV, which were due to Cr(VI) and Cr(III), respectively.51 This demonstrated the coexistence of both Cr(VI) and Cr(III) on the surface of WT(NH3) after reacting with Cr(VI), indicating that the Fe3O4/Fe2N nanocomposite in WT(NH3) is beneficial for the reduction of Cr(VI) to Cr(III). Moreover, the splitting of Cr 2p3/2 line peak into two peaks indicated the precipitation of Cr2O3 or Cr(OH)3 during the adsorption process.52 Based on the analysis, the ratio of Cr(III)/Cr(VI) was found to be 2.8![[thin space (1/6-em)]](https://www.rsc.org/images/entities/char_2009.gif) :
:![[thin space (1/6-em)]](https://www.rsc.org/images/entities/char_2009.gif) 1, implying that the reaction mechanisms might be sorption together with reduction processes. In addition, the concentrations of total Cr decreased by 14% and 46% in the H2SO4 and HCl systems, respectively. All the Cr(VI) ions were almost reduced to Cr(III) in the solution; thus, the H2SO4 system can promote the reduction of Cr(VI) by WT(NH3) (Fig. S4(b)†).
1, implying that the reaction mechanisms might be sorption together with reduction processes. In addition, the concentrations of total Cr decreased by 14% and 46% in the H2SO4 and HCl systems, respectively. All the Cr(VI) ions were almost reduced to Cr(III) in the solution; thus, the H2SO4 system can promote the reduction of Cr(VI) by WT(NH3) (Fig. S4(b)†).
As shown in Fig. 5(e), the binding energies of Fe 2p after Cr adsorption at 724.6 eV, 720.4 eV, and 711.1 eV may be assigned to Fe(III), suggesting that Fe(II) on the surface of the material was oxidized to Fe(III) during the redox process. Hence, lower pH facilitated the transformation of Fe(III) to Fe(II) during the adsorption process. The measurements of the concentration of Fe(II) were performed in acidic solution (pH = 2) during the reaction (Fig. S4(a)†). Under H2SO4 treatment, the content of Fe(II) was considerably higher than that under HCl treatment with and without Cr(VI), and the results showed that the content of Fe(II) ions reached about 108.3 mg L−1 with no Cr(VI) in the H2SO4 system. When Cr(VI) was added, the concentration of Fe(II) ions decreased to about 9.24 mg L−1 in 7 h.
These interesting findings indicate that Fe3O4/Fe2N may have high reduction activity and can release a large amount of Fe(II) under H2SO4 treatment. As shown in Fig. 7, Fe3O4 alone has no effect on activation in the H2SO4 system. Also, both Fe3O4 and Fe2N are inefficient in reducing Cr(VI) in the HCl system. Therefore, this suggests that the high efficiency of WT(NH3) is due to the active sites at the interface of the two phases of Fe2N and Fe3O4 or Fe2N itself;53 this is consistent with the TEM results, showing that WT(NH3) has much more Fe3O4 and Fe2N interfaces.
According to the above-mentioned analysis and discussion, a possible mechanism for Cr(VI) removal by WT(NH3) is proposed (Fig. 9). First, Cr(VI) was partly absorbed by WT(NH3) in both the HCl and H2SO4 systems. Second, WT(NH3) released both Fe(III) and Fe(II). Meanwhile, some Fe(III) ions were converted to Fe(II) at a very low pH value. Third, the Cr(VI) ions were reduced to Cr(III) by Fe(II) (eqn (1)),31 which explained the presence of Cr(III) species in both the aqueous solution and on the surface of WT(NH3). This was also supported by the decrease in the concentration of Fe(II) in the solution with Cr(VI). In addition, SO42− could activate Fe2N or the interface of Fe2N and Fe3O4 and thus, it could accelerate the release of ferrous ions.
| 3Fe2+ + CrO42− + 4H2O → 3Fe3+ + Cr3+ + 8OH− | (1) |
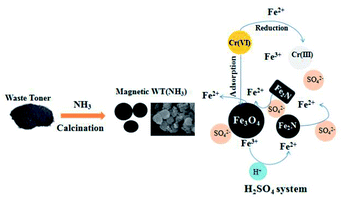 | ||
| Fig. 9 Preparation route for magnetic WT(NH3) and its mechanism for Cr(VI) removal in the H2SO4 system. | ||
From the above-mentioned results, waste toner can be utilized to prepare functional nanomaterials under different conditions. As indicated in this study, the good sorptive and reductive capacities for CrO42− are ascribed to the active sites and Fe3O4 and Fe2N in the nanocomposites. Since functional magnetic Fe3O4 shows good affinity for many heavy metals such as lead,54 arsenic55 and copper,56 the as-prepared toner-based sorbents can be used to remove a wide spectrum of heavy metals. Besides, the sorbents can be used to remediate wastewater contaminated by pharmaceuticals and other organic pollutants because Fe2N may promote catalytic degradation of organic compounds.53,57 Thus, waste toner can be potentially used for the removal of heavy metals and organic contaminants.
4. Conclusions
In this study, we prepared a novel magnetic nanocomposite using waste toner through high-temperature decomposition. The XRD analysis confirmed the existence of Fe3O4 and Fe2N nanoparticles in WT(NH3). Cr(VI) adsorption properties and magnetism characteristics of WT(NH3) were investigated. WT(NH3) exhibited high magnetization and good dispersibility. The enhanced efficiency for the removal of Cr(VI) can be related to its higher surface area and existence of Fe2N. In fact, TEM results revealed that WT(NH3) has more Fe2N and Fe3O4 interfaces. The XPS analysis indicated that Cr(VI) was partly reduced to Cr(III) by Fe(II) during the process. Batch sorption experiments indicated that using H2SO4 to adjust pH could effectively help release a large amount of Fe(II) to reduce toxic Cr(VI) by WT(NH3). Our study suggests that the facilely synthesized sorbent is efficient for the removal of Cr(VI) for environmental applications.Conflicts of interest
There are no conflicts to declare.Acknowledgements
This work was financially supported by the Qing Lan Project, the National Science Foundation of China (31772394, 51602281), Social development project of Jiangsu Province (BE2015661), Six-talent peaks project in Jiangsu Province (2013-NY-017). We thank the Testing Center of Yangzhou University for Sample Characterization.References
- J. O. Nriagu and E. Nieboer, J. Ecol., 1988, 71, 1 Search PubMed.
- A. Broadway, M. R. Cave, J. Wragg, F. M. Fordyce, R. J. F. Bewley, M. C. Graham, B. T. Ngwenya and J. G. Farmer, Sci. Total Environ., 2010, 409, 267–277 CrossRef PubMed.
- Y. T. Wang, E. M. Chirwa and H. Shen, J. Environ. Eng., 2000, 126, 300–306 CrossRef.
- Agency, E. P. U. S, Drinking Water Regulations and Health Advisories, May 1995 Search PubMed.
- M. Dakiky, M. Khamis, A. Manassra and M. Mer'Eb, Adv. Environ. Res., 2002, 6, 533–540 CrossRef.
- J. Kotaś and Z. Stasicka, Environ. Pollut., 2000, 107, 263–283 CrossRef.
- M. K. Dinker and P. S. Kulkarni, ChemInform, 2015, 60, 2521–2540 Search PubMed.
- E. A. Schmieman, J. N. Petersen, D. R. Yonge, D. L. Johnstone, Y. Bereded-Samuel, W. A. Apel and C. E. Turick, Appl. Biochem. Biotechnol., 1997, 63, 855–864 CrossRef PubMed.
- A. E. Pagana and S. D. Sklari, J. Membr. Sci., 2011, 367, 319–324 CrossRef.
- R. L. Goswamee, P. Sengupta, K. G. Bhattacharyya and D. K. Dutta, Appl. Clay Sci., 1998, 13, 21–34 CrossRef.
- T. Ölmez, J. Hazard. Mater., 2009, 162, 1371–1378 CrossRef PubMed.
- K. P. Singh, A. K. Singh, S. Gupta and S. Sinha, Desalination, 2011, 270, 275–284 CrossRef.
- Y. F. Kong, Y. C. Li, G. S. Hu, N. Cao, Y. Q. Ling, D. Pan, Q. Shao and Z. H. Guo, Polym. Adv. Technol., 2018, 1–8 Search PubMed.
- Y. F. Kong, Y. C. Li, G. S. Hu, J. Lin, D. Pan, D. Y. Dong, E. Wujick, Q. Shao, M. J. Wu, J. Z. Zhao and Z. H. Guo, Polymer, 2018, 145, 232–241 CrossRef.
- H. J. Kang, Q. Shao, X. K. Guo, A. Galaska, Y. Y. Liu and Z. H. Guo, Eng. Sci., 2018, 1, 78–85 Search PubMed.
- J. Zheng, J. Ruan, L. Dong, T. Zhang, M. Huang and Z. Xu, ACS Sustainable Chem. Eng., 2016, 5, 161–167 CrossRef.
- J. Ruan, J. Li and Z. Xu, J. Hazard. Mater., 2011, 185, 696–702 CrossRef PubMed.
- J. Ruan, J. Li and Z. Xu, Environ. Sci. Technol., 2013, 47, 6457–6462 CrossRef PubMed.
- J. Ruan, L. Dong, J. Huang, Z. Huang, K. Huang and H. Dong, ACS Sustainable Chem. Eng., 2017, 5, 4923–4929 CrossRef.
- J. Ruan and Z. Xu, Environ. Sci. Technol., 2012, 46, 6214 CrossRef PubMed.
- V. Gaikwad, U. Kumar, F. Pahlevani, A. Piadasa and V. Sahajwalla, ACS Sustainable Chem. Eng., 2017, 5, 11543–11550 CrossRef.
- H. H. Hu, H. P. Liu, D. J. Zhang, J. J. Wang, G. W. Qin and X. F. Zhang, Eng. Sci., 2018, 2, 43–48 Search PubMed.
- H. K. Wu, Y. Zhang, R. Yin, W. Zhao, X. M. Li and L. Qian, Adv. Compos Hybrid. Mater., 2018, 1, 168–176 CrossRef.
- Y. X. He, S. Yang, H. Liu, Q. Shao, Q. Y. Chen, C. Lu, Y. L. Jiang, C. T. Liu and Z. H. Guo, J. Colloid Interface Sci., 2018, 517, 40–51 CrossRef PubMed.
- M. L. Peterson, A. F. White, G. E. Brown and G. A. Parks, Environ. Sci. Technol., 1997, 31, 1573–1576 CrossRef.
- T. Kendelewicz, P. Liu, C. S. Doyle, G. E. Brown Jr, E. J. Nelson and S. A. Chambers, Surf. Sci., 1999, 424, 219–231 CrossRef.
- Y. Gong, L. Gai, J. Tang, J. Fu, Q. Wang and E. Y. Zeng, Sci. Total Environ., 2017, 595, 743–751 CrossRef PubMed.
- J. Pan, J. Jiang and R. K. Xu, Chemosphere, 2014, 101, 71–76 CrossRef PubMed.
- U. Schwertmann, U. Gasser and H. Sticher, Geochim. Cosmochim. Acta, 1989, 53, 1293–1297 CrossRef.
- B. A. Manning, J. R. Kiser, H. Kwon and S. R. Kanel, Environ. Sci. Technol., 2007, 41, 586–592 CrossRef PubMed.
- B. Qiu, H. B. Gu, X. R Yan, J. Guo, Y. R. Wang, D. Z. Sun, Q. Wang, M. Khan, X. Zhang, B. L. Weeks, D. P. Young, Z. H. Guo and S. Y. Wei, J. Mater. Chem. A, 2014, 2, 17454–17462 RSC.
- J. H. Zhu, H. B. Gu, J. Guo, M. J. Chen, H. G. Wei, Z. P. Luo, H. A. Colorado, N. Yerra, D. W. Ding, T. C. Ho, N. Haldolaarachchige, J. Hopper, D. P. Young, Z. H. Guo and S. Y. Wei, J. Mater. Chem. A, 2014, 2, 2256–2265 RSC.
- J. N. Huang, Y. H. Cao, Q. Shao, X. F. Peng and Z. H. Guo, Ind. Eng. Chem. Res., 2017, 56, 10689–10701 CrossRef.
- B. Qiu, Y. R. Wang, D. Z. Sun, Q. Wang, X. Zhang, B. L. Weeks, R. O'Connor, X. H. Huang, S. Y. Wei and Z. H. Guo, J. Mater. Chem. A, 2015, 3, 9817–9825 RSC.
- G. Liu, Q. Deng, H. Wang, S. Kang, Y. Yang and D. H. L. Ng, Chem.–Eur. J., 2012, 18, 13418–13426 CrossRef PubMed.
- S. C. Ponce, C. Prado, E. Pagano, F. E. Prado and M. Rosa, Ecol. Eng., 2015, 74, 33–41 CrossRef.
- Q. Wang, X. Chen, K. Yu, Y. Zhang and Y. Cong, J. Hazard. Mater., 2013, 246–247, 135–144 CrossRef PubMed.
- D. S. Sigman, Acc. Chem. Res., 1989, 19, 13–27 Search PubMed.
- A. Mirmohseni, M. S. S. Dorraji and M. G. Hosseini, Electrochim. Acta, 2012, 70, 182–192 CrossRef.
- X. Huang, Z. Yang, B. Dong, Y. Wang, T. Tang and Y. Hou, Nanoscale, 2017, 9, 8102–8106 RSC.
- L. Guo, P. Ye, J. Wang, F. Fu and Z. Wu, J. Hazard. Mater., 2015, 298, 28–35 CrossRef PubMed.
- H. W. Liang, X. Zhuang, S. Brüller, X. Feng and K. Müllen, Nat. Commun., 2014, 5, 4973 CrossRef PubMed.
- Z. Yue, S. E. Bender, J. Wang and J. Economy, J. Hazard. Mater., 2009, 166, 74–78 CrossRef PubMed.
- L. Lin, Q. Zhu and A. W. Xu, J. Am. Chem. Soc., 2014, 136, 11027–11033 CrossRef PubMed.
- D. Wilson and M. A. Langell, Appl. Surf. Sci., 2014, 303, 6–13 CrossRef.
- Y. Tian, B. B. Yu, X. Li and K. Li, J. Mater. Chem., 2011, 21, 2476–2481 RSC.
- F. Gao, H. Gu, H. Wang, X. Wang, B. Xiang and Z. Guo, RSC Adv., 2015, 5, 60208–60219 RSC.
- S. Shi, J. Yang, S. Liang, M. Li, Q. Gan and K. Xiao, Sci. Total Environ., 2018, 628–629, 499–508 CrossRef PubMed.
- T. Papadam, N. P. Xekoukoulotakis, I. Poulios and D. Mantzavinos, J. Photochem. Photobiol., A, 2007, 186, 308–315 CrossRef.
- J. Jiang, Q. Cai, W. Xu, M. W. Yang, Y. Cai, D. D. Dionysiou and K. E. O'Shea, Environ. Sci. Technol., 2014, 48, 8078–8085 CrossRef PubMed.
- X. Tian, W. Wang, T. Na, C. Zhou, Y. Chao and S. Komarneni, J. Hazard. Mater., 2016, 309, 151–156 CrossRef PubMed.
- Z. Ai, Y. Cheng, L. Zhang and J. Qiu, Environ. Sci. Technol., 2008, 42, 6955–6960 CrossRef PubMed.
- J. Wang, C. Wang, S. Tong, J. Wang, C. Wang and S. Tong, Catal. Commun., 2017, 103, 105–109 CrossRef.
- L. Tan, J. Xu, X. Xue, Z. Lou, J. Zhu and S. A. Baig, RSC Adv., 2014, 4, 45920–45929 RSC.
- L. Y. Feng, M. H. Cao, X. Y. Ma, Y. S. Zhu and C. W. Hu, J. Hazard. Mater., 2012, 217, 439–446 CrossRef PubMed.
- H. B. Hu, Z. H. Wang and L. J. Pan, J. Alloys Compd., 2010, 492, 656–661 CrossRef.
- N. Zhang, H. Zhao, G. M. Zhang, S. Chong, Y. C. Liu, L. Y. Sun, H. Z. Chang and T. Huang, J. Environ. Manage., 2017, 187, 201–211 CrossRef PubMed.
Footnote |
| † Electronic supplementary information (ESI) available. See DOI: 10.1039/c8ra05291c |
| This journal is © The Royal Society of Chemistry 2018 |

