 Open Access Article
Enhanced photocatalytic activity and ultra-sensitive benzaldehyde sensing performance of a SnO2·ZnO·TiO2 nanomaterial†
Md Abdus Subhan *a,
Pallab Chandra Saha
 a,
Shamim Ahmed Sumona,
Jahir Ahmeda,
Abdullah M. Asiri
 b,
Mohammed M. Rahman
 *b and
Mohammad Al-Mamun
 c
c
aDepartment of Chemistry, School of Physical Sciences, Shahjalal University of Science and Technology, Sylhet-3100, Bangladesh. E-mail: subhan-che@sust.edu; Tel: +8801716073270
bCenter of Excellence for Advanced Materials Research (CEAMR), Department of Chemistry, Faculty of Science, King Abdulaziz University, P.O. Box 80203, Jeddah 21589, Saudi Arabia. E-mail: mmrahman@kau.edu.sa; Fax: +966-12-695-2292; Tel: +966-59-642-1830
cCentre for Clean Environment and Energy, Griffith School of Environment, Gold Coast Campus, Griffith University, QLD 4222, Australia
First published on 24th September 2018
Abstract
The synthesis of a ternary SnO2·ZnO·TiO2 nanomaterial (NM) by a simple co-precipitation method and its potential applications as an efficient photocatalyst and chemical sensor have been reported. The synthesized nanomaterial was fully characterized by XRD, SEM, EDS, XPS, FTIR, AFM and photoluminescence studies. This nanomaterial exhibited enhanced efficiency in photo-catalysis of Methyl Violet 6b (MV) dye degradation. The observed photocatalyst efficiency of the SnO2·ZnO·TiO2 nanomaterial was 100% under UV light at pH 9. Moreover, it lost around 12% efficiency over five reuses. The PL properties with changing excitation energy were also reported. Glassy carbon electrode (GCE) was modified with the SnO2·ZnO·TiO2 nanomaterial by an efficient electrochemical technique to develop a chemical sensor for selective benzaldehyde. Hazardous benzaldehyde was carefully chosen as a target analyte by a selectivity study; it displays a rapid response towards the SnO2·ZnO·TiO2/Nafion/GCE sensor probe in electrochemical sensing. It also shows superb sensitivity, an ultra-low detection limit, long-term stability, and very good repeatability and reproducibility. In this study, a linear calibration plot was obtained for 0.1 nM to 1.0 mM aqueous benzaldehyde solutions, with a sensitivity value of 4.35 nA μM−1 cm−2 and an exceptionally low detection limit (LOD) of 3.2 ± 0.1 pM (S/N = 3). Hence, a chemical sensor modified with SnO2·ZnO·TiO2/GCE may be a promising sensor in the determination of toxic chemicals in the environmental and healthcare fields.
Introduction
Oxides of mixed metals are important inorganic materials which can efficiently serve as catalysts. The synthesis and design of versatile mixed metal oxide nanomaterials has gained enormous attention in recent years. Nanotechnologists are exploiting these materials for their excellent physicochemical properties. The interactions between multiple metal oxide structures can produce interesting characteristics in the materials; thus, they are important subjects to study. One of the reasons for the enhanced photocatalysis is the formation of heterojunctions between different materials, as this enables absorption of a wide range of photons and can generate charge separations between the junctions. These mixed metal nanomaterials will find optimum forms in the near future, where their strength and efficiency will satisfy the requirements for suitable use.1Titanium dioxide, particularly in the anatase form, exhibits photocatalytic activity under ultraviolet (UV) irradiation. This photoactivity is reportedly most pronounced at the [001] planes of anatase. The photocatalytic properties of titanium dioxide were discovered by Fujishima.2 The process on the surface of titanium dioxide is called the Honda–Fujishima effect. SnO is used in sensors of combustible gases, including carbon monoxide detectors.3 Doping with various CuO compounds has been investigated.4 Doping with cobalt and manganese affords a material that can be used in high voltage varistors. Tin(IV) oxide can be doped with oxides of iron or manganese for excellent uses.5,6
Zinc oxide nanoparticles have vast applications, such as in the ceramics industry,7 medicine,8 food additives,9 and UV absorbers10 and in nuclear reactors as a corrosion preventer.11 A fascinating property of mixed metal oxides is their versatility; they can be used for many purposes with high efficiency. For example, mixed metal oxide nanomaterials show excellent electro-chemical sensor abilities, photocatalytic dye degradation abilities, antibacterial properties, drug delivery functions, and light emitting phenomena. Due to all these behaviors, the use of mixed metal oxide nanomaterials can be very beneficial.
Phenolic compounds and their functional derivatives are extensively used in the production of pharmaceuticals, synthetic dyes, and pesticides; they are known to be severely environmentally toxic, anthropogenic and biorefractory organic compounds which can cause severe damage to organisms and plants in the environment.12,13 Especially, benzaldehyde, a poisonous chemical, is widely used in industry as a solvent. Benzaldehyde is considered to be one of the most concerning pollutants by the US Environmental Protection Agency.14,15 Therefore, in terms of ecological security and food safety, there is an urgent demand to develop effective methods for the detection of benzaldehyde. In the last several years, some noticeable traditional analytical methods, including high-performance liquid chromatography, capillary zone electrophoresis, spectrophotometry and electrochemical analysis, have been reported for the detection of benzaldehyde.16 Among the available techniques for determination of benzaldehyde, the electrochemical method offers various potential advantages, such as fast response, cost-effectiveness and simple operation steps, along with good sensitivity and selectivity. Traditional electrodes, including gold and glassy carbon electrodes, can show good performance in electrochemical analysis; however, there is still a need for a very sensitive detection method for very low concentrations of benzaldehyde in water, which may be obtained by modification of electrodes with various nanostructured materials.17 Among various nanomaterials, carbon-based nanomaterial electrodes, such as carbon paste, carbon nanotube and graphene electrodes, are used extensively in the electrochemical determination of benzaldehyde because of their wide potential windows, good electron transport properties and high effective surface areas.18 Especially, graphene, a hexagonally arranged single layered two-dimensional structure of sp2 hybridized carbon, may be an excellent electrode material for benzaldehyde determination because of its excellent charge transport properties, large surface to volume ratio, high electrocatalytic activity and thermal conductivity.19 Although a few reports are available in the literature on the detection of benzaldehyde using graphene/graphene oxide-modified electrodes, the detection limits are in the range of a few hundreds of nanomoles.20 However, to achieve lower detection limits, graphene with other nanomaterials as a composite may be a good choice. Codoped nanostructure materials have received a great deal of consideration due to their morphological, structural, physical, and optical properties in terms of large active surface area, high stability, high porosity, high volume-to-surface ratio, and permeability. These are directly dependent on the structural as well as the morphological properties of the reactant precursors (stannic chloride, zinc nitrate, and TiBr4) with titanium dioxide to fabricate SnO2·ZnO·TiO2 nanomaterials at room temperature. SnO2·ZnO·TiO2 nanomaterials are synthesized by a co-precipitation method using Na2CO3 agents under ambient conditions. This technique has several advantages, including facile preparation, accurate control of the reactant temperature, easy handling, and one-step reaction. The optical, morphological, electrical, and chemical properties of SnO2·ZnO·TiO2 nanomaterials are of enormous significance from a scientific aspect compared to other undoped or single metal oxide materials. Non-stoichiometry, mostly oxygen vacancies, endows the nanomaterials with a conducting nature. The formation energies of oxygen vacancies and metal interstitials in titanium semiconductors are very low; thus, these defects form readily, resulting in experimentally elevated conductivities of SnO2·ZnO·TiO2 nanomaterials compared to undoped oxide materials such as SnO2, ZnO, and TiO2. Transition metal oxide-doped semiconductor (SnO2·ZnO·TiO2) nanomaterials have also attracted considerable interest due to their potential photo-catalytic as well as electro-catalytic applications in fabricating opto-electronics, electro-analysis, selective detection of bioassays, biological devices, hybrid composites, electron-field emission sources for emission exhibits, biochemical detections, surface-enhanced Raman properties, etc. Codoped ternary oxides (SnO2·ZnO·TiO2) offer improved performance due to their large active surface areas, which show increased optical activity, electrical conductivity and current responses of SnO2·ZnO·TiO2 nanomaterials/Nafion/GCE assembly during electrochemical investigations.
In the present study, we prepared a SnO2·ZnO·TiO2 nanomaterial by a simple coprecipitation method to test its efficiency in the photo-catalysis of Methyl Violet 6b (MV) dye degradation and the electrochemical detection of benzaldehyde under ambient conditions. The structural and morphological properties of the SnO2·ZnO·TiO2 nanomaterial were observed by various conventional techniques. After successful synthesis of the SnO2·ZnO·TiO2 nanomaterial, we coated SnO2·ZnO·TiO2 on GCE to evaluate its electrochemical performance towards the detection of benzaldehyde using conducting coating binders. In addition, we compared the electrochemical response of the SnO2·ZnO·TiO2 nanomaterial with bare GCE and coated electrodes for the detection of benzaldehyde; the results indicate that the SnO2·ZnO·TiO2 nanomaterial shows better performance.
Experimental section
Materials and methods
TiBr4 (Sigma Aldrich, Germany), SnCl2 (Sigma Aldrich, Germany), Zn(NO3)2·6H2O (MERCK, India), and Na2CO3(AR, BDH) were purchased and used as supplied. Disodium phosphate, monosodium phosphate, benzaldehyde, 2-aminophenol, 4-methoxyphenol, 3-chlorophenol, 2,4-dinitrophenol, bisphenol A, hydrazine, paracetamol, 4-nitrophenyl hydrazine, and 5% ethanolic Nafion solution were purchased from Sigma-Aldrich. All of these analytical grade chemicals were used without any further purification.The bulk crystal phase and other relevant structural information regarding the materials studied in this work were characterized by X-ray diffraction (XRD, Bruker D8 Advance diffractometer, equipped with a graphite monochromator). The diffraction patterns were recorded in the step scan mode at 0.05 steps and at a measurement rate of 10 s per step. The diffraction patterns were registered within the 2θ angle range from 10° to 80°. The surface morphology and nanostructural characterizations were conducted using an atomic force microscope (AFM) (NaioAFM, NanoSurf) and a scanning electron microscope (SEM) equipped with an energy-dispersive X-ray spectrometer (EDS) (JSM-7100F) linked with an EDS (Oxford) mapping device. XPS investigations of the nanomaterials were executed using a K-α1 spectrometer (Thermo Scientific, K-α1 1066) with an excitation radiation source (A1 Kα1, beam spot size = 300.0 μm, pass energy = 200.0 eV, pressure ∼10−8 torr).
The transmission mode Fourier transform infrared spectroscopic (FTIR) analysis of the samples was carried out using a FTIR spectrometer (Shimadzu, FTIR-8400S) with KBr as the reference matrix. The photoluminescence behavior of the synthesized nanomaterial was studied by a spectroflurophotometer (Shimadzu Corp. model RF-5301), and its photocatalytic activity was observed using a double beam UV-visible spectrophotometer (UV-1800 Series, Shimadzu Corporation, Kyoto, Japan). Electrochemical characteristic measurements of the fabricated SnO2·ZnO·TiO2/Nafion/GCE composite were conducted to detect benzaldehyde using a Keithley electrometer (6517A, USA) under ambient conditions.
Preparation of the SnO2·ZnO·TiO2 nanomaterial
A simple co-precipitation method was used to synthesize the SnO2·ZnO·TiO2 nanomaterial. This synthetic process began with preparing 0.25 M solutions of SnCl2, TiBr4, and Zn(NO3)2·6H2O, which acted as sources of tin, zinc and titanium, respectively. All these solutions were mixed in a beaker in the same volume ratio with constant stirring for 15 minutes. To this triple metal mixture, 0.5 M Na2CO3 was added dropwise until completion of the reaction at 45 °C. The resulting mixture was stirred for 1 more hour at 45 °C with constant stirring. After terminating the reaction, the white precipitate was separated from the solution by centrifugation, washed several times with deionized water and finally dried at 120 °C in an oven for 2 hours. The obtained white precipitate was crushed in a mortar until it became amorphous. Then, the amorphous powder sample was calcined in an electric muffle furnace (Gallenkamp, Korea) at 650 °C for four hours. The calcinations converted the carbonates of the samples into their oxides.21Modification of GCE with the SnO2·ZnO·TiO2 nanomaterial
GCE was modified with the as-grown SnO2·ZnO2·TiO2 using 5% ethanolic Nafion solution to obtain a 0.4 mm (approx.) thick film. This was then heated in an oven at 45.0 °C for 2 hours to obtain a dry film on the GC electrode. In the electro-chemical cell, the SnO2·ZnO·TiO2 fabricated GCE was used as a working electrode (WE), a platinum wire was used as the counter electrode (CE), and aqueous benzaldehyde in 0.1 M phosphate buffer solution (PBS; pH 6.5) was used as the supporting electrolyte. Using an electrometer (Keithley, 6517A Electrometer, USA), the electrochemical method was applied to aqueous benzaldehyde using SnO2·ZnO·TiO2/GCE as the WE.Results and discussion
Structural characterization of SnO2·ZnO·TiO2 nanomaterials
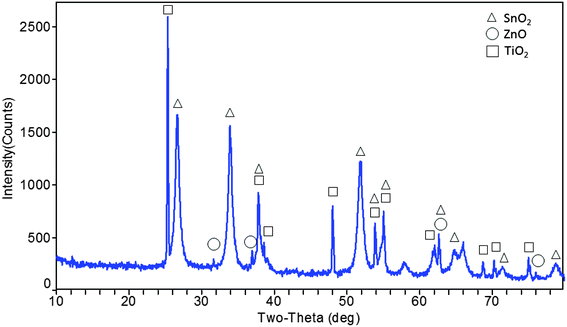
As shown in Fig. 1, the peaks at 2θ values of 26.603°, 33.898°, 37.803°, 51.8°, 55.037°, 57.941°, 62.083°, 64.692°, 65.996°, 71.253° and 78.745° are due to tetragonal SnO2 (cassiterite) as compared to PDF file 71-0652. Similarly, the presence of ZnO in this nanomaterial can be identified by the peaks at 31.6°, 36.9°, 62.9° and 76° with hexagonal ZnO according to PDF 76-0704. In this figure, tetragonal TiO2 (anatase) peaks are assigned as 2θ values of 25.333°, 37.803°, 38.558°, 48.013°, 53.857°, 55.037°, 62.083°, 62.649°, 68.707°, 70.24° and 74.985° (PDF #99-0008). From the XRD data, the particle size was calculated and was found to be 17.4 nm using Scherrer's formula t = Kλ/(β![[thin space (1/6-em)]](https://www.rsc.org/images/entities/char_2009.gif) cos
cos![[thin space (1/6-em)]](https://www.rsc.org/images/entities/char_2009.gif) θ), where τ is the mean size, K is a dimensionless shape factor with a value of 0.94, λ is the X-ray wavelength (0.1506 nm), β is the line broadening at half the maximum intensity (FWHM), and θ is the Bragg angle.
θ), where τ is the mean size, K is a dimensionless shape factor with a value of 0.94, λ is the X-ray wavelength (0.1506 nm), β is the line broadening at half the maximum intensity (FWHM), and θ is the Bragg angle.
Surface analysis of the SnO2·ZnO·TiO2 nanomaterial
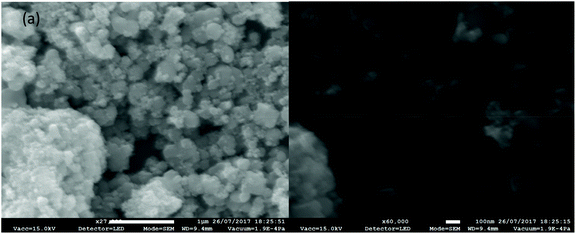
The scanning electron microscope images shown in Fig. 2(a) and (b) reveal the morphology of the nanomaterial, SnO2·ZnO·TiO2, at different magnifications. Fig. 2 shows that the nanoparticles formed a complex porous nanostructure which may have high surface activity, possibly resulting in superior catalytic and sensor activity.EDS analysis of the SnO2·ZnO·TiO2 nanomaterial
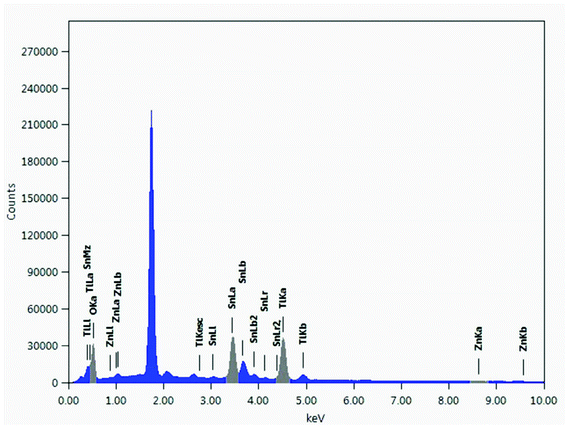
EDS of SnO2·ZnO·TiO2 (Fig. 3) was carried out to map the elemental distribution in the nanomaterial. As is evident in Table S1,† the NPs are composed of Sn, Zn, Ti and O with atomic percentages of 10.20%, 0.51%, 20.13%, and 69.16%, respectively. Furthermore, EDS mapping (Fig. S1†) indicated that these elements were not confined in a specific space; rather, they were distributed throughout the matrix.XPS spectrum of the SnO2·ZnO·TiO2 nanomaterial
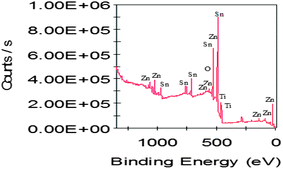
Fig. 4 shows the XPS spectrum of SnO2·ZnO·TiO2. XPS peaks can be observed corresponding to nano SnO2, ZnO and TiO2 in the mixed metal nanocomposite oxide SnO2·ZnO·TiO2. Peaks were assigned at different binding energies (eV) for each metal and oxygen in the metal oxides from lower energy to higher energy: Zn (3d), Zn (3p), Zn (3s), Ti (3p5/2), Ti (3p3/2), Sn (3d5/2), Sn (3d3/2), ZnL (MM), ZnL (MM), O (1s), ZnL (MM), Sn (3p3), Sn (3p1), Sn (3s), Zn (2p3/2) and Zn (2p1/2). The XPS results indicated the formation of the mixed metal nanocomposite oxide SnO2·ZnO·TiO2.Spectroscopic investigation of the SnO2·ZnO·TiO2 nanomaterial
An FTIR spectrum of the nanomaterial was acquired (Fig. S2†). The bands in the low wavenumber region, 400 to 850 cm−1, correspond to the vibration modes of M–O and O–M–O (M = Sn, Ti, Zn). The broad absorption band at 3200 cm−1 is due to the presence of the O–H stretching mode of hydroxyl groups absorbed from the moisture. The peaks at 1641 cm−1 and 1629 cm−1 may be due to the H–O–H bending vibration of water.Atomic force microscopy of the SnO2·ZnO·TiO2 nanomaterial
Atomic force microscopy of the SnO·ZnO·TiO2 nanomaterial was obtained by fabricating a film on a glass slide of the nanomaterial dispersed in acetone by ultrasonication. The 2D-topology (Fig. S3†) was determined using a silicon carbide cantilever in dynamic mode. The image showed around 1 nm average roughness. The RMS roughness of the surface is around 5 nm.Photoluminescence properties of the SnO2·ZnO·TiO2 nanomaterial
Photoluminescence spectra of SnO2·ZnO·TiO2 were measured in acetone at different excitation wavelengths at room temperature. Fig. S4† depicts the PL spectra of SnO2·ZnO·TiO2 annealed at 650 °C. Emissions peaking at 372 and 468 nm were observed when the sample was excited at 220 nm. Emissions were observed at 372 and 468 nm when the sample was excited at 230 nm. When excited at 250 nm, PL peaks were found at 372 and 468 nm. Emission peaks at 369 and 468 nm were observed when the sample was excited at 290 nm. Emissions were also observed at 366, 380, 400 and 422 nm when the sample was excited at 320 nm. Excitation at 350 nm provided emissions at 402 and 426 nm. Finally, when the sample was excited at 370 nm, only three closely equidistant PL peaks were observed at 400, 426 and 451 nm. Sharp peaks in the UV region at 366, 369, 372, 373 and 380 nm corresponding to the excitations at 220, 230, 250, 290 and 320 nm may be due to NBE emissions. The NBE emissions are blue shifted compared to those of single ZnO nanoparticles; this may be due to the formation of nanostructures by mixing tetragonal SnO2, hexagonal ZnO and tetragonal TiO2 in the SnO2·ZnO·TiO2 nanocomposite. The UV region emission should be attributed to the radiative annihilation of excitons. The visible emission is caused by the radiative recombination of a photogenerated hole with an electron occupying the oxygen vacancy. The bands in the blue part of the spectrum are related to free or bound excitons at room temperature. However, some peaks may result from radiative recombination through deep defects on the boundaries between tetragonal SnO2, hexagonal ZnO and tetragonal TiO2. All these data are tabulated in Table 1.| Excitation wavelength (nm) | Peaks (nm) |
|---|---|
| 220 | 372 and 468 |
| 230 | 372 and 468 |
| 250 | 372 and 468 |
| 290 | 369 and 468 |
| 320 | 366, 380, 400 and 422 |
| 350 | 402 and 426 |
| 370 | 400, 426 and 451 |
Photocatalytic activity of the SnO2·ZnO·TiO2 nanomaterial
The photocatalytic degradation of MV dye by the SnO2·ZnO·TiO2 nanomaterial was observed under UV light as well as under visible light. Here, a germicidallamp (G-10T8, 10 W, 362 nm) and 100 W tungsten filament lamps were used as UV and visible light sources, respectively. A series of catalyst doses were studied. The catalytic efficiency of dye degradation was calculated using eqn (1).21| η = (1 − C/C0) × 100 = (1 – A/A0) × 100 | (1) |
First, the optimum dosage for maximum performance of our synthesized nanomaterial was examined. As shown in Fig. 5, when a 150 ppm dose was used, the efficiency was 77.8%; for a 200 ppm dose, the efficiency was 91.7%, and for a 250 ppm dose, the efficiency reached the maximum of 100%. For a 300 ppm dose, the efficiency decreased to 97%, and for a 400 ppm dose, the efficiency decreased further to 87.2%. It can be seen that the SnO2·ZnO·TiO2 nanomaterial functions maximally when a 250 ppm dose is applied. For this reason, throughout this study, 250 ppm doses were used.
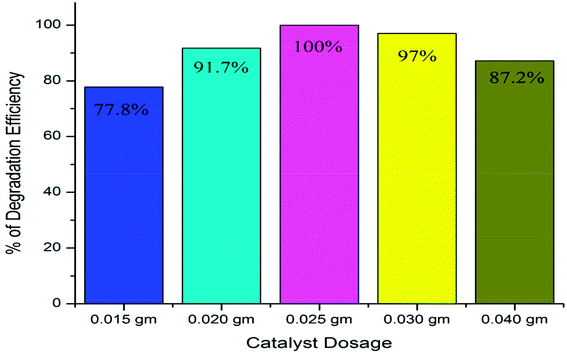 | ||
| Fig. 5 Photocatalytic dye degradation efficiency dependence on dose for the SnO2·ZnO·TiO2 nanomaterial. | ||
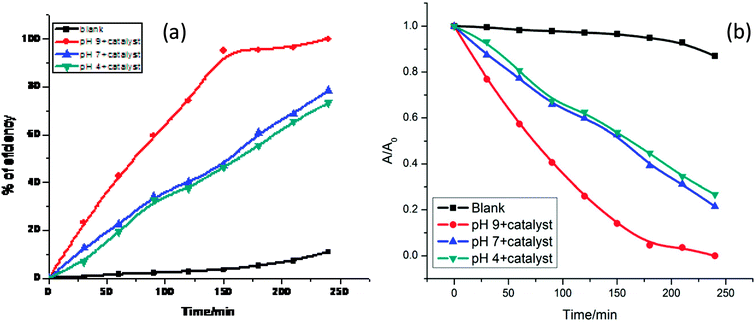
After that, 250 ppm catalyst was used to identify the optimum pH for the best fitted degradation conditions. A series of pH values of 4, 7 and 9 were used to assess the compatibility, and 73.33%, 78.5% and 100% efficiencies were observed within 240 minutes, respectively, as shown in Fig. 6(a). Therefore, with increasing pH, degradation of the dye increases rapidly, as shown in Fig. 6(b); this efficiency increase may be due to facile generation of hydroxyl radical at higher pH values.
Furthermore, to understand the true value of a photocatalyst, its stability must be assessed. In sample analysis, retention of efficiency is very important. In this study, we attempted to answer this question by recovering the nanomaterial from solution through ultracentrifugation and washing it with acetone. The extracted nanomaterial was reused and its efficiency was calculated (Fig. 7). The reusability study of this nanomaterial indicated that its efficiency decreased by around 12% over 5 re-uses. For a fresh sample, the 1st, 2nd, 3rd, 4th and 5th cycle efficiencies were 100%, 96%, 94.1%, 90.8% and 87.7%, respectively.
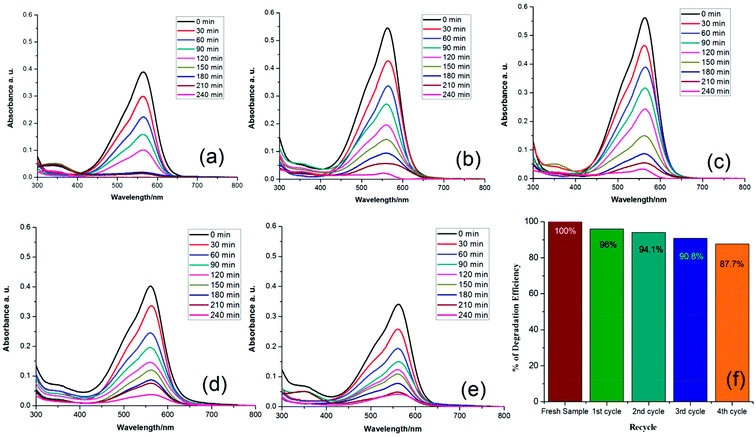 | ||
| Fig. 7 Photocatalytic degradation of (a) fresh sample, (b) 1st cycle, (c) 2nd cycle, (d) 3rd cycle, (e) 4th cycle and (f) comparison of the efficiencies. | ||
Sensor applications
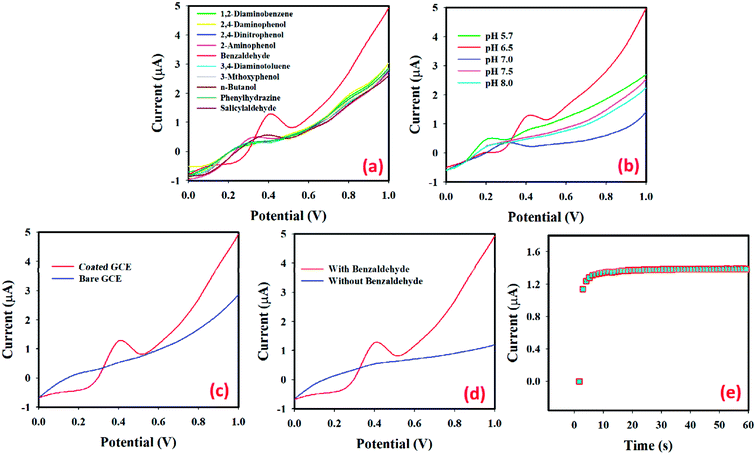
Fig. 8(a) shows the current responses for ten toxic chemicals, where (1.0 μM; 25.0 μL) benzaldehyde solution (red-dotted) in PBS (pH 6.5) produced a distinct peak at +0.4 V with the SnO2·ZnO·TiO2 NM/Nafion/GCE surface. The changes in the electrochemical properties of SnO2·ZnO·TiO2 with the pH value were studied in PBS with pH values of 5.7 to 8.0, as shown in Fig. 8(b). The obtained results show that the SnO2·ZnO·TiO2 nanomaterial exhibits better electro-chemical performance at different pH values. It is clear that the electrocatalytic properties of SnO2·ZnO·TiO2 change with the pH value, as revealed by the variations in the current response. In the pH optimization using benzaldehyde (1.0 μM; 25.0 μL) in PBS, a pH value of 6.5 produced the maximum current response. Hence, pH 6.5 was used in the remaining experimental studies of benzaldehyde determination by the SnO2·ZnO·TiO2/GCE assembly. The current intensities using benzaldehyde (1.0 μM; 25.0 μL) in PBS (5.0 mL, pH 6.5) for bare GCE (blue-dotted) and the sample 4 fabricated GCE (red-dotted) are given in Fig. 8(c). Sample 4/GCE produces a much better response than bare GCE, which demonstrates the excellent electrochemical properties of the SnO2·ZnO·TiO2 nanomaterial towards the target benzaldehyde. Fig. 8(d) shows the current response of the SnO2·ZnO·TiO2 nanomaterial-fabricated GCE in the absence of benzaldehyde (blue-dotted) and in the presence of benzaldehyde (red-dotted; 1.0 μM; 25.0 μL) in 5.0 mL of PBS. With benzaldehyde, a remarkable increase in the current response indicates the benzaldehyde sensing capability of the proposed SnO2·ZnO·TiO2/GCE sensor. The current vs. time (I–t) responses for benzaldehyde (1.0 μM; 25.0 μL) in 5.0 mL of PBS solution using the SnO2·ZnO·TiO2 nanomaterial-fabricated GCE as the WE are shown in Fig. 8(e). With benzaldehyde (1.0 μM; 25.0 μL) in 5.0 mL of PBS, a constant current response was obtained in approximately 10 seconds.
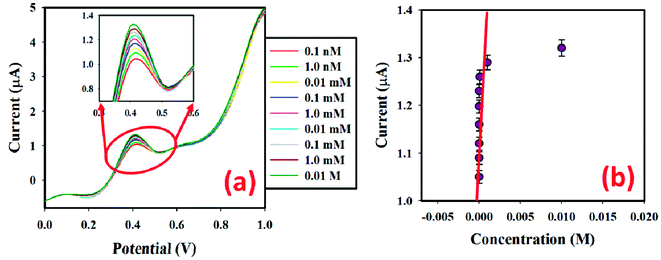
In 5.0 mL PBS, low (0.1 nM) to high (0.01 M) concentrations of benzaldehyde solution (25.0 μL) were injected sequentially, and the surface current response variation was studied after every injection. The electrochemical responses from the SnO2·ZnO·TiO2 nanomaterial-fabricated GCE surface were estimated using aqueous benzaldehyde with different concentrations (0.1 nM to 0.01 M), as given in Fig. 9(a) (the inset shows the magnification peak current at 0.4 V). It is obvious that when the potential increases, the electrochemical response also increases for the SnO2·ZnO·TiO2 nanomaterial-fabricated GCE sensor with increasing concentration of benzaldehyde at room temperature (25.0 °C). It was also noted that from dilute (0.1 nM) to concentrated (0.01 M) benzaldehyde solutions, the electrochemical responses increased regularly. Aqueous benzaldehyde (0.1 nM to 0.01 M) was taken to select the LOD of the developed sensor. The calibration plot (at +0.4 V) for the full concentration range is given in Fig. 9(b). A higher sensitivity value of 4.35 nA μM−1 cm−2 was estimated from the calibration plot. From the calibration plot, the linear dynamic range of the developed SnO2·ZnO·TiO2/GCE sensor was determined to be 0.1 nM to 1.0 mM (r2 = 0.9993), and the LOD was estimated as 3.2 ± 0.1 pM [3 × noise (N)/slope (S)].
The electrochemical responses were investigated on the thin film of SnO2·ZnO·TiO2 NM/Nafion/GCE during the benzaldehyde sensing experiment, and it was observed that the intensity of the current responses increased with increasing benzaldehyde concentration in the phosphate buffer measuring medium. The apparent increasing tendency of the current responses is due to the release of electrons from the applied current by benzaldehyde and the oxidation of benzaldehyde to benzylic alcohol. The holding period in the electrometer was set at 1 s, and a proposed reduction mechanism of benzaldehyde is illustrated in Scheme 1. As represented in the reactions, two electrons are released to oxidize benzaldehyde. As a result, enhancement of electrons in the phosphate buffer measuring system is observed, and this is fulfilled by the applied potential. Thus, the intensity of the resulting current response increases. Consequently, with increasing analyte (benzaldehyde) concentration, the current response increases significantly.
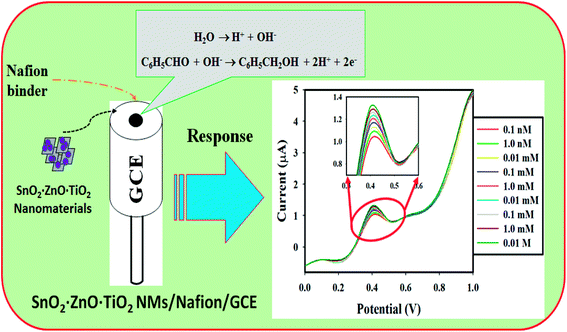 | ||
| Scheme 1 Schematic of the fabricated GCE with SnO2·ZnO·TiO2 NM/Nafion/GCE using a conducting Nafion binder and its electrochemical response. | ||
A thin film of SnO2·ZnO·TiO2 NM was deposited on GCE with a conducting Nafion binder to fabricate the working electrode of a benzaldehyde chemical sensor. This was implemented to detect benzaldehyde in environmental samples with various concentrations of benzaldehyde. Here, during chemisorption, the dissolved oxygen is converted to ionic species (such as O2− and O−) by gaining electrons from the conduction band of aggregated SnO2·ZnO·TiO2 NM, which improves and enhances the current response against the potential during the electrochemical measurements under ambient conditions. An aqueous benzaldehyde sensing mechanism of the SnO2·ZnO·TiO2 NM/Nafion/GCE sensor based on the semiconductor oxides is presented, where oxidation or reduction of the semiconductor oxide itself occurs according to the dissolved O2 in the bulk solution or surface air of the surrounding atmosphere. These reactions take place in the bulk solution, air/liquid interface or surrounding air due to the low carrier concentration, which affects the resistance of the electrode. The benzaldehyde sensitivity toward SnO2·ZnO·TiO2 NM/Nafion/GCE can be attributed to the higher oxygen deficiency and defect density, which leads to increased oxygen or hydroxide adsorption. The larger the number of ionic counters adsorbed on the surface, the greater the reducing capability and the faster the reduction of benzaldehyde. The reactivity of benzaldehyde with the surface is very high compared to those of other chemicals under identical conditions. When benzaldehyde reacts with the adsorbed OH− on the conjugated surface of the film of SnO2·ZnO·TiO2 NM/Nafion/GCE, it liberates the free electrons in the conduction band (Scheme 1). The free electrons function with the hydroxide to enhance the reduction of benzaldehyde per the equation in Scheme 1.
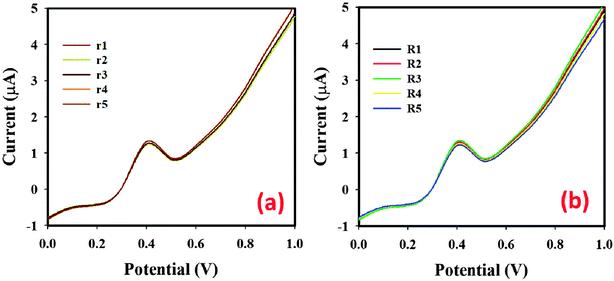 | ||
| Fig. 10 (a) Repeatability using five different working electrodes and (b) reproducibility using the same working electrode conditions: 0.1 μM, 25.0 μL benzaldehyde; 5.0 mL, 0.1 M PBS at pH 6.5. | ||
To check the functionality of the proposed sensor, SnO2·ZnO·TiO2 NM/Nafion/GCE was employed to determine benzaldehyde in industrial effluent water and drinking water from a plastic bottle after seven days of sunlight irradiation inside a car (S2). For this, we used the standard addition method to verify the accuracy of the aqueous benzaldehyde determination. 25.0 μL of aqueous benzaldehyde with different concentrations and equal amounts of real sample were mixed and analyzed in PBS (5.0 mL, pH 6.5) using SnO2·ZnO·TiO2 NM/GCE as the WE. Table 2 presents the obtained outcomes; it was demonstrated that the SnO2·ZnO·TiO2 NM/Nafion/GCE modified sensor exhibited a quantitative (∼100%) recovery of benzaldehyde. Therefore, we can conclude that the electrochemical method is suitable and reliable for analyzing real samples with the SnO2·ZnO·TiO2 NM/Nafion/GCE assembly.
| Real sample | Benzaldehyde concentrationb added | Benzaldehyde conc.b determinedc by SnO2·ZnO·TiO2/GCE | Recoveryc (%) | RSDd (%) (n = 3) |
|---|---|---|---|---|
| a S1 and S2: real water samples collected from an industrial effluent treatment plant and a Safa drinking water bottle, respectively, Jeddah, Saudi Arabia.b Mean of three repeated determinations (S/N = 3) with SnO2·ZnO·TiO2 NM/Nafion/GCE.c Concentration of benzaldehyde determined/concentration of benzaldehyde taken.d The relative standard deviation value indicates precision among three repeated determinations. | ||||
| S1 | 1.000 nM | 1.061 nM | 106.1 | 3.7 |
| S1 | 1.000 μM | 1.056 μM | 105.6 | 2.2 |
| S1 | 1.000 mM | 1.021 mM | 102.1 | 3.6 |
| S2 | 1.000 nM | 1.036 nM | 103.6 | 2.6 |
| S2 | 1.000 μM | 1.006 μM | 100.6 | 3.1 |
| S2 | 1.000 mM | 0.994 mM | 99.4 | 2.9 |
A control experiment was performed and is presented in the ESI section (Fig. S5†). It was observed that a higher benzaldehyde sensing response was found with SnO2·ZnO·TiO2 NM/Nafion/GCE compared to its individual single oxides, namely SnO2/GCE, ZnO/GCE, and TiO2/GCE. The electrochemical response in benzaldehyde determination mainly depends on the dimensions, morphology, and nano-porosity of the nanostructure materials. When the SnO2·ZnO·TiO2 nanomaterial surface comes in contact with the reducing benzaldehyde, a surface-mediated oxidation reaction takes place. Oxidation of benzaldehyde provides electrons to the SnO2·ZnO·TiO2 nanomaterial surface, which ultimately enhances the conductance of the SnO2·ZnO·TiO2/GCE assembly. Consequently, when the potential increases, the electrochemical response also increases. The SnO2·ZnO·TiO2/GCE sensor also displays superior consistency and stability. Despite this progress regarding the proposed sensor, there are still many aspects that must be studied further before commercial production.
Conclusions
In summary, a facile synthetic approach has been demonstrated for the synthesis of a ternary SnO2·ZnO·TiO2 nanomaterial and its application as an efficient photo and electro catalyst has been demonstrated. This inexpensive, facile, and easily controllable synthetic method can improve physicochemical interaction between the active materials of the nanoparticles. The nanocomposite was characterized by XRD, SEM, EDS, XPS, IR, AFM, and PL. This nanomaterial exhibits excellent efficiency in dye degradation and electrochemical sensing. It has an efficiency of 100% under UV light at pH 9 within 240 minutes. Moreover, it loses only about 12% efficiency over five re-uses. The photoluminescence properties of the composite are also diverse. Here, we highlighted the analytical potential of this ternary SnO2·ZnO·TiO2 NM as a chemical sensor and suggested avenues for further research. A SnO2·ZnO·TiO2 NM/Nafion/GCE electrode was successfully employed as a chemical sensor for the determination of aqueous benzaldehyde. The fabricated benzaldehyde chemical sensor based on SnO2·ZnO·TiO2 coated on GCE was a very effective electron mediator in the oxidation of benzaldehyde in a PBS system. The proposed SnO2·ZnO·TiO2 NM/Nafion/GCE sensor for benzaldehyde exhibits higher sensitivity and an ultra-low limit of detection with superb linear response for an extensive range of concentrations in a short response time. This introduces a new route to develop an effective chemical sensor using doped nanostructure nanomaterials for a sustainable environment.Conflicts of interest
There are no conflicts to declare.Acknowledgements
The MOE (Ministry of Education), Bangladesh Grant 2015-16 (PS 14290), is gratefully acknowledged for support. SUST research grant PS/2017/01 is also gratefully acknowledged. The Center of Excellence for Advanced Materials Research, King Abdulaziz University, Jeddah, Saudi Arabia is highly acknowledged for their lab facilities and instrumental support.References
- M. A. Subhan, A. M. M. Fahim, P. C. Saha, M. M. Rahman, K. Begum and A. K. Azad, Nano-Struct. Nano-Objects, 2017, 30–41 CrossRef.
- A. Fujishima and K. Honda, nature, 1972, 238, 37 CrossRef PubMed.
- R. C. Dorf, Sensors, Nanoscience, Biomedical Engineering, and Instruments: Sensors Nanoscience Biomedical Engineering, CRC press, 2016 Search PubMed.
- C. M. Wang, J. F. Wang and W. B. Su, J. Am. Ceram. Soc., 2006, 89, 2502–2508 CrossRef.
- A. Dibb, M. Cilense, P. R. Bueno, Y. Maniette, J. A. Varela and E. Longo, Mater. Res., 2006, 9, 339–343 CrossRef.
- A. Punnoose, J. Hays, A. Thurber, M. H. Engelhard, R. K. Kukkadapu, C. Wang and S. Thevuthasan, Phys. Rev. B, 2005, 72, 054402 CrossRef.
- A. Moezzi, A. M. McDonagh and M. B. Cortie, Chem. Eng. J., 2012, 185, 1–22 CrossRef.
- M. Banoee, S. Seif, Z. E. Nazari, P. Jafari-Fesharaki, H. R. Shahverdi, A. Moballegh and A. R. Shahverdi, J. Biomed. Mater. Res., Part B, 2010, 93, 557–561 CrossRef PubMed.
- M. Kim, D. G. Kim, S. W. Choi, P. Guerrero, J. Norambuena and G. S. Chung, Chemosphere, 2011, 9, 1225–1229 CrossRef PubMed.
- A. Becheri, M. Dürr, P. L. Nostro and P. Baglioni, J. Nanopart. Res., 2008, 10, 679–689 CrossRef.
- R. L. Cowan, Nucl. Energy, 2001, 40, 245–252 Search PubMed.
- W. R. LaCourse and I. S. Krull, Anal. Chem., 1987, 59, 49–53 CrossRef PubMed.
- J. Ahmed, M. M. Rahman, I. A. Siddiquey, A. M. Asiri and M. A. Hasnat, Electrochim. Acta, 2017, 246, 597–605 CrossRef.
- B. Shi, Y. Zhong, L. Guo and G. Li, Dalton Trans., 2015, 44, 4362–4369 RSC.
- M. M. Rahman, J. Ahmed, A. M. Asiri, I. A. Siddiquey and M. A. Hasnat, J. Taiwan Inst. Chem. Eng., 2016, 64, 157–165 CrossRef.
- P. Y. Du, W. Gu and X. Liu, Dalton Trans., 2016, 45, 8700–8704 RSC.
- A. Shockravi, A. Javadi and E. Abouzari-Lotf, RSC Adv., 2013, 3, 6717–6746 RSC.
- F. Yang and Z. Guo, J. Colloid Interface Sci., 2016, 467, 192–202 CrossRef PubMed.
- Z. Sun, M. Yang, Y. Ma and L. Li, Cryst. Growth Des., 2017, 17, 4326–4335 CrossRef.
- M. A. Kumar, J. K. Choe, W. Lee and S. Yoon, Environmental Nanotechnology, Monitoring and Management, 2017, 8, 97–102 CrossRef.
- M. A. Subhan, P. C. Saha, M. M. Rahman, M. A. R. Akand, A. M. Asiri and M. Al-Mamun, New J. Chem., 2017, 2, 7220–7231 RSC.
Footnote |
| † Electronic supplementary information (ESI) available. See DOI: 10.1039/c8ra05182h |
| This journal is © The Royal Society of Chemistry 2018 |

