 Open Access Article
Cerium and tin oxides anchored onto reduced graphene oxide for selective catalytic reduction of NO with NH3 at low temperatures
Yanli Wanga,
Ying Kanga,
Meng Gea,
Xiu Zhanga and
Liang Zhan *ab
*ab
aState Key Laboratory of Chemical Engineering, Key Laboratory for Specially Functional Polymers and Related Technology of Ministry of Education, Shanghai Key Laboratory of Multiphase Materials Chemical Engineering, East China University of Science and Technology, Shanghai 200237, China. E-mail: zhanliang@ecust.edu.cn; Fax: +86 21 64252914
bCAS Key Laboratory of Carbon Materials, Institute of Coal Chemistry, Chinese Academy of Sciences, Taiyuan 030001, China
First published on 26th October 2018
Abstract
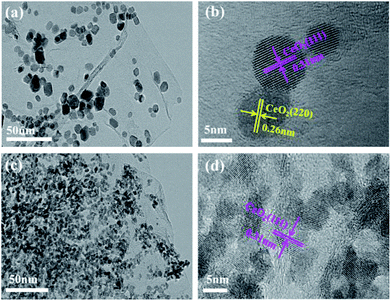
A series of cerium and tin oxides anchored on reduced graphene oxide (CeO2–SnOx/rGO) catalysts are synthesized using a hydrothermal method and their catalytic activities are investigated by selective catalytic reduction (SCR) of NO with NH3 in the temperature range of 120–280 °C. The results indicate that the CeO2–SnOx/rGO catalyst shows high SCR activity and high selectivity to N2 in the temperature range of 120–280 °C. The catalyst with a mass ratio of (Ce + Sn)/GO = 3.9 exhibits NO conversion of about 86% at 160 °C, above 97% NO conversion at temperatures of 200–280 °C and higher than 95% N2 selectivity at 120–280 °C. In addition, the catalyst presents a certain SO2 resistance. It is found that the highly dispersed CeO2 nanoparticles are deposited on the surface of rGO nanosheets, because of the incorporation of Sn4+ into the lattice of CeO2. The mesoporous structures of the CeO2–SnOx/rGO catalyst provides a large specific surface area and more active sites for facilitating the adsorption of reactant species, leading to high SCR activity. More importantly, the synergistic interaction between cerium and tin oxides is responsible for the excellent SCR activity, which results in a higher ratio of Ce3+/(Ce3+ + Ce4+), higher concentrations of surface chemisorbed oxygen and oxygen vacancies, more strong acid sites and stronger acid strength on the surface of the CeSn(3.9)/rGO catalyst.
1. Introduction
Nitrogen oxides (NOx) emitted from flue gases are considered to be one of the major air pollutants, and must be removed before emission. Selective catalytic reduction (SCR) of NO with NH3 has become the mainstream strategy of industrial application and research due to its high NOx removal efficiency and low energy consumption.1,2 Up to now, commercial SCR catalysts (such as V2O5/TiO2, V2O5–WO3/TiO2) must be operated in a high temperature range of 350–450 °C to avoid catalyst deactivation by SO2,3,4 while the stack gas temperatures in many industrial boilers are only about 120–250 °C. To satisfy the high reaction temperature (350–450 °C) for V2O5/TiO2 based catalysts, existing boiler systems must be coupled with a heating system or the flue gases are preheated, resulting in high energy consumption. Therefore, various novel low temperature SCR catalysts are designed and developed for practical NOx removal, such as V2O5, CeO2, MnOx, MnOx–CeO2 supported on TiO2 (ref. 5–7) or carbon materials (activated carbon,8 activated carbon fibers,9 carbon nanotubes10–12 and honeycomb activated carbon13,14).Among the novel SCR catalyst candidates, MnOx–CeO2 catalysts have attracted much attention due to their high NOx removal activities and resistance to SO2 poisoning in the low temperature range of 100–200 °C.15,16 The promoting effect of CeO2 is attributed to its unique redox property and excellent oxygen storage capacity,17,18 which associates with the formation of oxygen vacancies. As literatures reported,7,18 the replacement of partial cerium atoms in the CeO2 lattice by the other transition metal ions caused the distortion of CeO2 lattice and generated defects, resulting in improved thermal stability and increased SCR activity. However, it should be pointed out that MnOx–CeO2 based catalysts exhibit low SCR activities especially in the presence of SO2. To improve the resistance to SO2 poisoning in NO removal, the MnOx–CeO2 catalysts modified with SnO2 have been developed. Chang et al.19,20 reported SnO2-modified MnOx–CeO2 catalysts enhanced the SCR activity, broadened the operating temperature window (80–300 °C) and exhibited good SO2 resistance. Our recent studies21 revealed that spherical activated carbons supported SnOx–CeO2–MnOx catalyst (SnCeMn/SACs) with a molar ratio of Sn/Mn = 0.25 yielded higher than 95% NO conversion in the temperature range of 140–280 °C, and showed high SO2 resistance. At 240 °C, NO conversion over SnCeMn/SACs gradually decreased from 96% in the absence of SO2 to about 77% in 480 min upon the introduction of SO2 in the feed gas. Recently, it has also been demonstrated CeO2–SnOx catalysts showed high SCR activities, which was attributed to the strong synergistic effect between Ce and Sn species, leading to increased surface acidity of Lewis acid sites.22 Based on the high activities of CeO2–SnOx based catalysts, it is necessary the development of CeO2–SnOx in nanoscale to further improve their SCR activities. As a novel carbon nanomaterial, reduced graphene oxide (rGO) has been attracted attention, because of its unique two-dimensional microstructure and the existence of a certain amount of oxygen-containing functional groups on it.23,24 Therefore, the combination of rGO nanosheets and CeO2–SnOx are expected to achieve nanostructured CeO2–SnOx that provides larger reaction interfaces, leading to the enhancement of the catalytic activity.
In this work, a series of CeO2–SnOx anchoredon reduced grapheme oxide (CeO2–SnOx/rGO) catalysts are synthesized using hydrothermal method and their activities for SCR of NO are evaluated. The effects of SnOx on the activities, structures and surface properties of CeO2/rGO catalyst are also investigated. The catalysts are characterized to understand the physical and chemical properties of CeO2–SnOx/rGO as well as the relationship between structure and catalytic activity. The obtained CeO2–SnOx/rGO catalysts exhibit high SCR activities in the low temperature range of 120–280 °C, resulted from the highly dispersed CeO2 nanoparticles, mesoporous structures with high surface area and the synergistic interaction between cerium and tin oxides.
2. Experimental
2.1 Catalyst preparation
All the chemical reagents purchased from Aldrich were analytical grade. The graphene oxide (GO) was prepared using the modified Hummers.25 The CeO2–SnOx/rGO catalysts were synthesized by the hydrothermal method using GO, Ce(NO3)3·6H2O and SnCl4·5H2O as the precursors. In a typical procedure, 100 mg GO was initially dispersed in 50 mL deionized water by ultrasonic treatment for 3 h. Then appropriate amounts of Ce(NO3)3·6H2O and SnCl4·5H2O were dropped slowly into the GO slurry and the mixture was stirred for 1 h. Subsequently, ammonia solution was added into the above solution under vigorously stirring until the pH value reached.11 After stirring for 30 min, the obtained suspension was transferred into a 100 mL Teflon-lined stainless autoclave and heated at 180 °C for 12 h. Finally, the product was washed with deionized water and then freeze-dried for 24 h, followed by calcination at 300 °C for 2 h in N2 atmosphere. The molar ratio of Sn/Ce in all CeO2–SnOx/rGO catalysts is controlled at 0.5, which was reported to be the optimum ratio of Ce–Sn/TiO2 catalyst for NO removal.26 Besides, the mass ratios of (Ce + Sn)/GO is 1.3, 2.6 and 3.9, respectively. The resultant catalysts are denoted as CeSn(m)/rGO, where m presents the mass ratio of (Ce + Sn)/GO. For example, CeSn(1.3)/rGO refers to the mass ratio of (Ce + Sn)/GO is 1.3 in the CeO2–SnOx/rGO catalyst. For comparison, CeO2/rGO and SnOx/rGO were also synthesized using the similar procedure.2.2 Activity test
The activity test was carried out in a fixed-bed reactor with a diameter of 12 mm. At steady state, the feed gases are consisted with 500 ppm NO, 500 ppm NH3, 5 vol% O2, 200 ppm SO2 (when used), and balance N2. The total flow rate was controlled at 500 mL min−1, where the gas hourly space velocity (GHSV) is 62![[thin space (1/6-em)]](https://www.rsc.org/images/entities/char_2009.gif) 500 h−1, and the reaction temperature was regulated from 120 to 280 °C. The concentrations of NO and O2 in the inlet and outlet gases were continually monitored on-line by a flue gas analyzer (MRU VARIO PLUS, Germany). The effluent gas concentrations of NO and N2O were monitored by Nicolet (FTIR, PROTÉGÉ460, America). The SCR behaviors of the catalysts are expressed by NO conversion and N2 selectivity, which were calculated as literature reported.27
500 h−1, and the reaction temperature was regulated from 120 to 280 °C. The concentrations of NO and O2 in the inlet and outlet gases were continually monitored on-line by a flue gas analyzer (MRU VARIO PLUS, Germany). The effluent gas concentrations of NO and N2O were monitored by Nicolet (FTIR, PROTÉGÉ460, America). The SCR behaviors of the catalysts are expressed by NO conversion and N2 selectivity, which were calculated as literature reported.27
2.3 Characterization
Nitrogen adsorption/desorption isotherms of the samples were performed by Micromeritics ASAP 2020 M analyzer, and the pore size distributions were obtained by the Barrett–Joyner–Halenda (BJH) model. Raman and Fourier transform infrared (FT-IR) spectra were recorded on a Spex 1403Raman spectrometer and a Nicolet 5700 FTIR spectrometer, respectively. Powder X-ray diffraction (XRD) patterns of the samples were recorded by a Riguku D/Max 2550 diffractometer using Cu Kα radiation. The lattice parameters and crystallite sizes of all samples were calculated according to Bragg's law and the Debye–Scherrer equation, respectively. The microstructures of the samples were investigated using a JEOLJSM-6360LV scanning electron microscope (SEM) and a JEOL JEM-2010 transmission electron microscopy (TEM). The surface compositions of the catalysts were analyzed by X-ray photoelectron spectroscopy (XPS) with a PHI 5000 VersaProbe system. NH3-temperature programmed desorption (NH3-TPD) experiments were carried out on an adsorption apparatus (TP-5080, Xianquan Co.) with a thermal conductivity detector (TCD). 0.1 g sample was loaded into the reactor and pretreated at 300 °C for 30 min in He stream, and then cooled to 100 °C in He. Then the He flow was switched to a stream containing 5 vol% NH3/He to adsorb NH3 for 60 min at 100 °C. And subsequently the sample was purged with He at the same temperature. Finally, the sample was heated in He from 100 °C to 800 °C at a heating rate of 10 °C min−1.3. Results and discussion
3.1 SCR activities
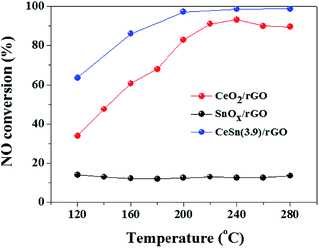
Fig. 1 presents the SCR activities versus reaction temperature over the CeO2/rGO, SnOx/rGO and CeO2–SnOx/rGO catalysts. The CeO2/rGO catalyst exhibits a relatively high SCR activity, and NO conversion increases from 34% at 120 °C to 68% at 180 °C, and is more than 83% from 200 to 280 °C. Although NO conversion of SnOx/rGO catalystis less than 15% in the temperature range of 120–280 °C, interestingly, the CeSn(3.9)/rGO catalyst shows a higher SCR activity than both of CeO2/rGO and SnOx/rGO catalysts. NO conversion of the CeSn(3.9)/rGO catalyst can achieve about 86% at 160 °C, and above 97% at temperatures of 200–280 °C, respectively. These results indicate that the interaction between CeO2 and SnOx is beneficial to promote the SCR activity of CeO2/rGO catalyst.Since Fig. 1 indicates that the addition of SnOx has a positive effect on the SCR activity of CeO2/rGO catalyst, the SCR activities of CeO2–SnOx/rGO catalysts with different mass ratios of (Ce + Sn)/GO were further investigated. As shown in Fig. 2a, all the CeO2–SnOx/rGO catalysts exhibit high SCR activities and NO conversions of all the catalysts increase with increasing reaction temperature. NO conversion of CeSn(1.3)/rGO catalyst is less than 30% in the low temperature range of 120–160 °C, and it reaches about 80% at 280 °C. Furthermore, NO conversion is obviously and greatly enhanced with increasing mass ratio of (Ce + Sn)/GO at different reaction temperatures. NO conversion of CeSn(2.6)/rGO catalyst can increase to about 91% at 200 °C, and about 98% at temperatures of 240–280 °C. NO conversion of CeSn(3.9)/rGO catalyst can reach about 64% at 120 °C, about 86% at 160 °C and about 97% at 200 °C. And it shows nearly 99% NO conversion in the temperature range of 240–280 °C. This SCR activity result is better than the data reported in the literatures for CeO2–SnOx (ref. 22), CeO2/TixSn1−xO2 (ref. 28) and H-CeSnTiOx (ref. 29) catalysts in the temperature range of 120–280 °C. The increase in SCR activity with increasing mass ratio of (Ce + Sn)/GO may be attributed to the increase of active sites on the surface of catalyst. Fig. 2b shows the N2 selectivity at different temperatures over CeSn(1.3)/rGO, CeSn(2.6)/rGO and CeSn(3.9)/rGO catalysts. The N2 selectivity of all the catalysts decreases with increasing temperature, however, higher than 95% N2 selectivity is still obtained at 280 °C. This result is similar to that reported on other CeO2–SnOx based catalysts.22,28,29 Therefore, the CeSn(3.9)/rGO catalyst is very active and highly selective for the SCR of NO.
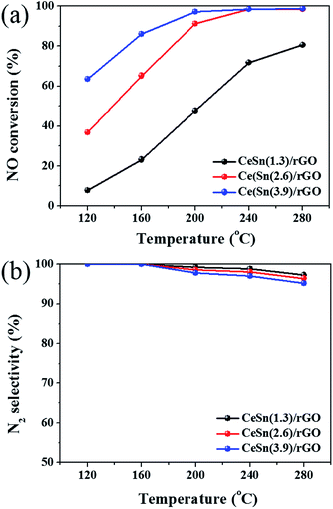 | ||
| Fig. 2 NO conversions (a) and N2 selectivity (b) over CeO2–SnOx/rGO catalysts with different mass ratios of (Ce + Sn)/GO. | ||
3.2 Morphological and structural characterization of the catalysts
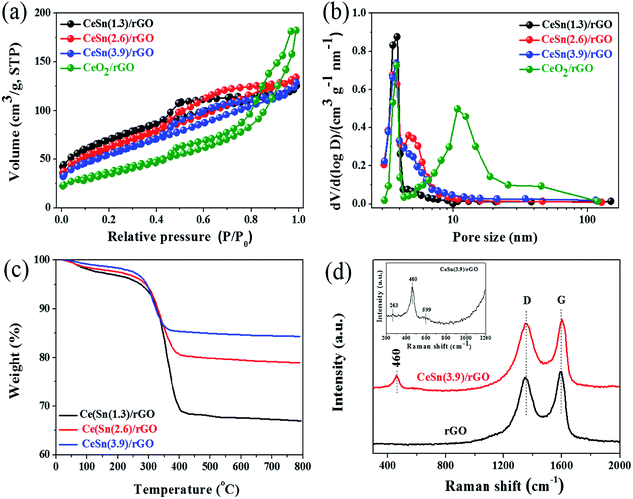 | ||
| Fig. 4 (a) N2 adsorption–desorption isotherms, (b) corresponding pore size distributions, (c) TG curves of the various catalysts, (d) Raman spectra of rGO and the CeSn(3.9)/rGO catalyst. | ||
| Sample | SBET (m2 g−1) | Vtotal (cm3 g−1) | Average pore size (nm) | Lattice parameterb (Å) | Crystallize sizec (nm) |
|---|---|---|---|---|---|
| a SBET: BET specific surface area; Vtotal: total pore volume.b Calculated from the diffraction peak of the (111) plane.c Calculated from the XRD peak of the (111) plane. | |||||
| CeO2/rGO | 133.4 | 0.28 | 8.43 | 5.419 | 13.3 |
| CeSn(1.3)/rGO | 249.1 | 0.19 | 3.29 | 5.361 | 3.7 |
| Ce(Sn(2.6)/rGO | 220.8 | 0.21 | 3.76 | 5.369 | 4.4 |
| CeSn(3.9)/rGO | 197.7 | 0.20 | 4.04 | 5.364 | 5.5 |
To determine the total contents of CeO2 and SnOx in the CeO2–SnOx/rGO catalysts, TG were carried out from 25 to 800 °C in air atmosphere (Fig. 4c). From TG curves, a small weight loss below 150 °C is attributed to the removal of physically adsorbed water in the samples. And the obvious weight loss between 280 and 500 °C is ascribed to the combustion of grapheme into CO2. The residual weight after TG tests is determined to be 67.0%, 78.9% and 84.4% for CeSn(1.3)/rGO, CeSn(2.6)/rGO and CeSn(3.9)/rGO, respectively, corresponding to the total contents of CeO2 and SnOx in the samples.
To analyze the chemical structure of CeSn(3.9)/rGO catalyst, the Raman spectroscopy is explored as shown in Fig. 4d. Two characteristic peaks at about 1350 (D band) and 1596 cm−1 (G band) can be clearly observed in both rGO and the CeSn(3.9)/rGO catalyst, corresponding to the sp3 and sp2 carbon atoms, respectively.32 This phenomenon confirms the existence of rGO in the obtained sample. The ratio of relative intensity ID/IG reflects the degree of graphitization, defects and the domain size of graphitization. The ID/IG value of CeSn(3.9)/rGO catalyst (0.99) is higher than that of rGO (0.92), indicating much more defects in the CeSn(3.9)/rGO catalyst. Another peak at 460 cm−1 is also observed in the Raman spectrum of CeSn(3.9)/rGO catalyst, corresponding to the F2g vibration mode of CeO2 in the fluorite structure,20,33 which indicates the presence of CeO2 nanoparticles in the CeSn(3.9)/rGO catalyst. Unfortunately, the characteristic peaks at about 610 cm−1 corresponding to SnOx cannot be observed,34 suggesting that no pure SnOx phase is formed. It is worth noting that two broad peaks at 263 and 599 cm−1 can be also observed in the CeSn(3.9)/rGO catalyst (the inset in Fig. 4d), which are related to the existence of oxygen vacancies.35 The generation of oxygen vacancies could increases the oxygen storage capacity and transfer ability between Ce3+ and Ce4+, which contributes to enhancing the SCR activity.36
The XRD patterns of the CeO2–SnOx/rGO catalysts with different mass ratios of (Ce + Sn)/GO were characterized, along with that of CeO2/rGO for comparison (Fig. 5a). CeO2/rGO catalyst shows characteristic diffraction peaks located at 28.5°, 33.1°, 47.5° and 56.4°, which can be assigned to (111), (200), (220) and (311) planes of cubic CeO2 crystalline (JCPDS card no. 34-0394), respectively.37,38 For CeO2–SnOx/rGO catalysts, only diffraction peaks of cubic CeO2 are observed and the typical characteristic peaks of SnO2 located at 26.7°, 33.9° and 51.6° can not be observed,39,40 in accordance with TEM and Raman results, indicating the replacement of Ce4+ by Sn4+ due to the smaller ionic radius of Sn4+ than Ce4+(the former is 0.069 nm, the latter is 0.087 nm). Meanwhile, no a broad peak around 26° related to the restacked rGO is detected, suggesting the as-prepared grapheme oxide is well exfoliated. It is worth pointing out that the diffraction peaks of CeO2–SnOx/rGO catalysts slightly shift to higher angle compared to those of CeO2/rGO catalyst. This result further suggests Sn4+ can be incorporated into the lattice of CeO2 to form the CeO2–SnOx solid solution. Such catalyst solid solution phenomenonon was also reported by Chen et al. on CuO/CexSn1−xO2 catalysts (1 − x ≤ 0.2), which found the formation of homogeneous solid solutions between CeO2 and SnO2.41 Similar explanations were also elucidated by Machida et al. on MnOx–CeO2 binary oxides, where the replacement of Ce4+ by Mn3+ in the fluorite structure results in the formation of a solid solution between Mn2O3 and CeO2.16,42 Additionally, CeO2 diffraction peaks of CeO2–SnOx/rGO catalysts are broader than those of individual CeO2/rGO and the crystallize size of CeO2–SnOx/rGO catalysts is smaller than that of CeO2/rGO (Table 1), further confirming the formation of CeO2–SnOx solid solution resulted from the interaction between cerium and tin species, which leads to higher dispersion of the metal oxides on the surface of CeO2–SnOx/rGO. Therefore, the improved dispersion of cerium and tin species on the catalyst surface plays a positive effect on SCR activity, which is consistent with SCR activity results.
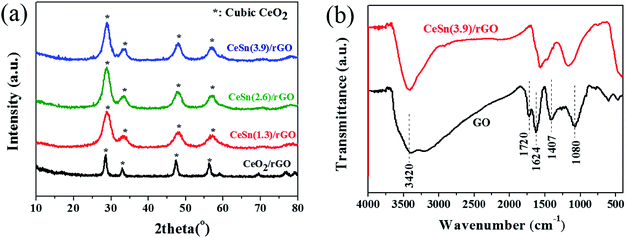 | ||
| Fig. 5 (a) XRD patterns of the various catalysts. (b) FT-IR spectra of GO and the CeSn(3.9)/rGO catalyst. | ||
To illustrate the different types of chemical functional groups in the obtained samples from GO to the CeSn(3.9)/rGO catalyst, FT-IR spectra were carried out. As shown in Fig. 5b, the representative absorption peaks ofGO can be observed, including the stretching vibration peak of O–H group at approximately 3420 cm−1, the C![[double bond, length as m-dash]](https://www.rsc.org/images/entities/char_e001.gif) O (COOH) stretching vibration peak at 1720 cm−1, the aromatic C
O (COOH) stretching vibration peak at 1720 cm−1, the aromatic C![[double bond, length as m-dash]](https://www.rsc.org/images/entities/char_e001.gif) C stretching vibration peak at approximately 1624 cm−1, the C–OH deformation vibration peak at 1407 cm−1, and the alkoxy C–O stretching vibration peak at 1080 cm−1.43,44 For the CeSn(3.9)/rGO catalyst, the spectrum peaks of C
C stretching vibration peak at approximately 1624 cm−1, the C–OH deformation vibration peak at 1407 cm−1, and the alkoxy C–O stretching vibration peak at 1080 cm−1.43,44 For the CeSn(3.9)/rGO catalyst, the spectrum peaks of C![[double bond, length as m-dash]](https://www.rsc.org/images/entities/char_e001.gif) O, C–OH and C–O are significantly weakened. This result further confirms GO is reduced to rGO during the hydrothermal treatment, agreeing well with the Raman result.
O, C–OH and C–O are significantly weakened. This result further confirms GO is reduced to rGO during the hydrothermal treatment, agreeing well with the Raman result.
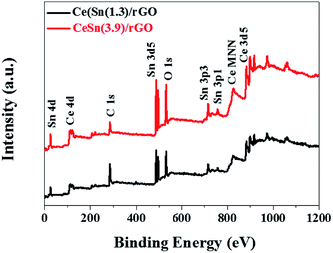
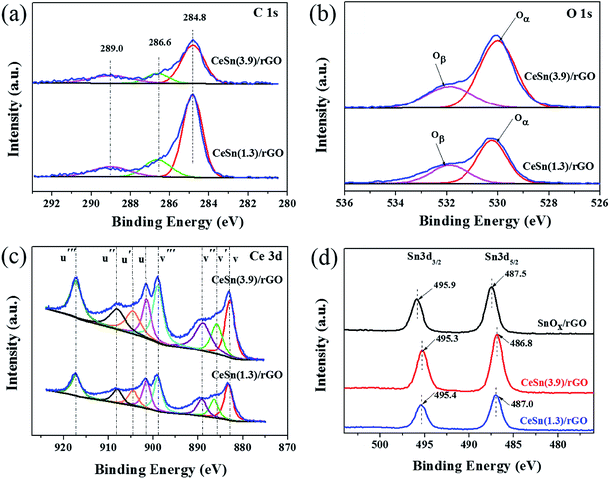
To further determine the chemical composition of the CeO2–SnOx/rGO catalyst, the XPS analysis was performed. Fig. 6 presents the XPS survey spectra of CeSn(1.3)/rGO and CeSn(3.9)/rGO, revealing the presence characteristic peaks of cerium, tin, carbon and oxygen. And the detail surface atomic concentrations of Ce, Sn, C, O and the relative atomic ratios of Ce3+/(Ce3+ + Ce4+) are summarized in Table 2. Fig. 7a shows the XPS spectra of C 1s. Three peak at 284.8, 286.6 and 289.0 eV are observed, corresponding to the C–C, the C–O, and O–C![[double bond, length as m-dash]](https://www.rsc.org/images/entities/char_e001.gif) O groups, respectively.45 The low intensities of C–O, and O–C
O groups, respectively.45 The low intensities of C–O, and O–C![[double bond, length as m-dash]](https://www.rsc.org/images/entities/char_e001.gif) O functional groups in the obtained samples indicate the reduction of GO to rGO during the hydrothermal process,46 which is consistent with the Raman and FT-IR results.
O functional groups in the obtained samples indicate the reduction of GO to rGO during the hydrothermal process,46 which is consistent with the Raman and FT-IR results.
| Sample | Surface atomic concentration (%) | Atomic ratio (%) | ||||
|---|---|---|---|---|---|---|
| Ce | Sn | C | O | Ce3+/(Ce3+ + Ce4+) | ||
| Oα | Oβ | |||||
| CeSn(1.3)/rGO | 2.80 | 4.09 | 64.87 | 18.33 | 9.92 | 18.7 |
| CeSn(3.9)/rGO | 5.59 | 7.59 | 40.12 | 33.13 | 13.57 | 19.8 |
The O 1s XPS spectra are fitted into two peaks and the results are shown in Fig. 7b. Two peaks at 529.5–530.2 eV and 531.2–532.0 eV correspond to the peaks of lattice oxygen (Oα) and chemisorbed oxygen (Oβ), respectively.37 As shown in Fig. 7b and Table 2, the Oα concentration of CeSn(3.9)/rGO markly increases compared with that of CeSn(1.3)/rGO, due to increased lattice oxygen in SnOx and CeO2 with the increasing of (Ce + Sn)/GO mass ratio. It is worth noting that the Oβ concentration on CeSn(3.9)/rGO (13.57%) is higher than that on CeSn(1.3)/rGO (9.92%), indicating increased chemisorbed oxygen concentration on the surface of CeSn(3.9)/rGO. It has been generally accepted that the chemisorbed oxygen species (Oβ) are more active than the lattice oxygen species (Oα) due to their higher oxygen mobility.47 Furthermore, the higher concentration of Oβ is beneficial for the oxidation of NO to NO2, which accelerates the “fast SCR” process (4NH3 + 2NO + 2NO2 → 4N2 + 6H2O) and hence promotes the catalytic activity.48
The Ce 3d XPS spectra are shown in Fig. 7c. The u′′′, u′′, u, v′′′, v′′, and v peaks are assigned to Ce4+, while the peaks labeled u′ and v′ are attributed to Ce3+.37,49 For the two catalysts, the intensities of the u′ and v′ peaks for Ce3+are much weaker than those of the u′′′, u′′, u, v′′′, v′′, and v peaks for Ce4+, suggesting that Ce4+ and Ce3 coexist and the main valence state of cerium is Ce4+. It is noted that the intensities of Ce4+ and Ce3+ peaks in CeSn(3.9)/rGO are much stronger than those in CeSn(1.3)/rGO, indicating increased concentrations of Ce4+ and Ce3+. The ratios of Ce3+/(Ce3+ + Ce4+) can be determined by the area ratio of Ce3+ species. As illustrated by Table 2, the ratio of Ce3+/(Ce3+ + Ce4+) in CeSn(3.9)/rGO (19.8%) is slightly higher than that in CeSn(1.3)/rGO (18.7%). It has been reported that the existence of Ce3+ can create charge imbalance to form oxygen vacancies and unsaturated chemical bonds,26,50 leading to the increase in chemisorbed oxygen on the catalyst surface, in accordance with the above results of O 1 s spectra. Thus, the higher ratio of Ce3+/(Ce3+ + Ce4+) in CeSn(3.9)/rGO implies the generation of more oxygen vacancies. The increase of oxygen vacancies on the catalyst surface could result in more gaseous oxygen being supplied on the catalyst.51 Moreover, higher concentration of oxygen vacancies is advantageous to the improvement of oxygen mobility.52 Both of them could facilitate the activation and transportation of the active oxygen species in the SCR reactions, which result in the excellent SCR activity of CeSn(3.9)/rGO catalyst, as evidenced by the results shown in Fig. 2a.
Fig. 7d presents the Sn 3d XPS spectra of SnOx/rGO, CeSn(1.3)/rGO and CeSn(3.9)/rGO. The binding energies of Sn 3d3/2 and Sn 3d5/2 in SnOx/rGO are located at 495.9 and 487.5 eV, respectively, indicating the existence of Sn4+.21,40 Compared with SnOx/rGO, the peaks of Sn 3d3/2 and Sn 3d5/2 in CeSn(1.3)/rGO and CeSn(3.9)/rGO catalysts slightly shift to lower binding energies. The shift in binding energy indicates that there are excess electrons around Sn atoms on CeSn(1.3)/rGO and CeSn(3.9)/rGO, and the existence of synergistic interaction between cerium and tin oxides is further demonstrated by the following redox equilibrium: Sn4+ + 2Ce3+ ↔ Sn2+ + 2Ce4+.53 The above XPS results demonstrate that relatively high concentrations of chemisorbed oxygen species, oxygen vacancies and Ce3+/(Ce3+ + Ce4+) are beneficial for the SCR activity of CeSn(3.9)/rGO catalyst.
3.3 NH3-TPD analysis
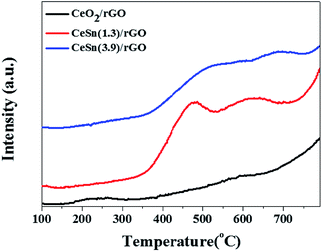
It is generally recognized that the adsorption and activation (partial oxidation: NH3(ads) → NH2(ads)) of NH3 is a key step in the NH3-SCR reaction.54,55 Therefore, the adsorption and activation of NH3 is promoted by increasing the surface acidity of the catalyst, which is favorable for improving SCR activity. NH3-TPD experiments were carried out to measure the acidity of the obtained catalysts. Fig. 8 shows the NH3-TPD curves for CeO2/rGO, CeSn(1.3)/rGO and CeSn(3.9)/rGO. For CeO2/rGO, one desorption peak appeared at 150–320 °C is assigned to the weak acid sites, while another broad desorption peak at 350–620 °C is assigned to the strong acid sites. For CeSn(1.3)/rGO and CeSn(3.9)/rGO, two obvious desorption peaks above 350 °C are observed. It is widely accepted that the position of NH3 desorption peak is connected with the acid strength and the area of desorption peak is proportional to the acid amount. Compared with CeO2/rGO, the desorption peaks of CeSn(1.3)/rGO and CeSn(3.9)/rGO markly shift to higher temperature, suggesting that the strength of strong acid sites become stronger after the addition of SnOx. Meanwhile, the desorption peak areas of CeSn(1.3)/rGO and CeSn(3.9)/rGO are larger than that of CeO2/rGO, indicating that there are more strong acid sites on them. It could be attributed to the larger specific surface area of CeSn(1.3)/rGO and CeSn(3.9)/rGO (Table 1). The amount of strong acid sites on CeSn(3.9)/rGO is lower than that of CeSn(1.3)/rGO, probably due to the decrease in specific surface area (Table 1). Additionally, the desorption peak temperature of CeSn(3.9)/rGO is higher than that of CeSn(1.3)/rGO, suggesting that the strength of strong acid sites on CeSn(3.9)/rGO is stronger. The stronger acid sites could be related to the stronger interaction between CeO2 and SnOx on CeSn(3.9)/rGO. Therefore, CeSn(3.9)/rGO has more amount and stronger strength of strong acid sites, which facilitates the adsorption and activation of NH3, resulting in the higher SCR activity of CeSn(3.9)/rGO.3.4 Effect of SO2 on SCR activity
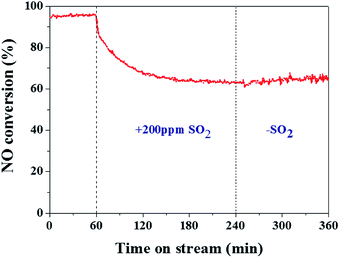
The actual flue gas still contains some residual SO2 even after desulfurization, and thus it is necessary to investigate the SO2 resistance of CeSn(3.9)/rGO catalyst in the temperature range of 120–280 °C. Fig. 9 presents the effect of SO2 on SCR activity of CeSn(3.9)/rGO catalyst at 240 °C. After the introduction of 200 ppm SO2 into the feed stream, NO conversion gradually decreases from about 95% to about 63% in 180 min. After SO2 is shut off, NO conversion cannot be recovered to the original value, but NO conversion still maintains at about 65%. Such results suggest that CeSn(3.9)/rGO catalyst has a certain SO2 resistance. Since CeSn(3.9)/rGO catalyst not only exhibits high SCR activity in the temperature range of 120–280 °C but also presents good SO2 resistance, CeSn(3.9)/rGO catalyst seems to have promising prospect for NO removal at low temperature.4. Conclusions
The CeO2–SnOx anchored on reduced graphene oxide (CeO2–SnOx/rGO) catalysts were successfully synthesized using hydrothermal method. The CeO2–SnOx/rGO catalysts show high SCR activities in the temperature range of 120–280 °C. About 86% NO conversion at 160 °C and more than 97% NO conversion in the temperature range of 200–280 °C are achieved over the CeSn(3.9)/rGO catalyst. All the catalysts yield higher than 95% N2 selectivity at 120–280 °C. Additionally, CeSn(3.9)/rGO catalyst presents a certain SO2 resistance. The excellent SCR activity can be attributed to the highly dispersed CeO2 nanoparticles on the rGO nanosheets, and its mesoporous structures with large specific surface area. More importantly, there are higher ratio of Ce3+/(Ce3+ + Ce4+), higher concentrations of surface chemisorbed oxygen and oxygen vacancies, more amount of strong acid sites and stronger acid strength on the surface of CeSn(3.9)/rGO catalyst, because there exists the synergistic interaction between cerium and tin oxides. These factors contribute to higher SCR activity of CeSn(3.9)/rGO catalyst. Further experiments are underway to elucidate the mechanisms of SO2 deactivation and SCR reaction over CeO2–SnOx/rGO catalyst.Conflicts of interest
There are no conflicts to declare.Acknowledgements
This work was financially supported by National Science Foundation of China (No. 51472086, 51002051, 20806024) and CAS Key Laboratory of Carbon Materials (No. KLCMKFJJ1703).References
- G. Busca, L. Lietti, G. Ramis and F. Berti, Appl. Catal., B, 1998, 18, 1–36 CrossRef CAS.
- H. Bosch and F. Janssen, Catal. Today, 1988, 2, 369–379 CrossRef CAS.
- P. Forzatti, Catal. Today, 2000, 62, 51–65 CrossRef CAS.
- M. D. Amiridis, I. E. Wachs, G. Deo, J. M. Jehng and D. S. Kim, J. Catal., 1996, 161, 247–253 CrossRef CAS.
- B. Q. Jiang, Y. Liu and Z. B. Wu, J. Hazard. Mater., 2009, 162, 1249–1254 CrossRef CAS PubMed.
- Z. B. Wu, R. B. Jin, Y. Liu and H. Q. Wang, Catal. Commun., 2008, 9, 2217–2220 CrossRef CAS.
- W. Q. Xu, Y. B. Yu, C. B. Zhang and H. He, Catal. Commun., 2008, 9, 1453–1457 CrossRef CAS.
- Z. G. Huang, Z. P. Zhu and Z. Y. Liu, Appl. Catal., B, 2002, 39, 361–368 CrossRef CAS.
- B. X. Shen and T. Liu, Acta Phys.-Chim. Sin., 2010, 26, 3009–3016 CAS.
- X. Wang, Y. Y. Zheng, Z. Xu, Y. Liu and X. L. Wang, Catal. Sci. Technol., 2014, 4, 1738–1741 RSC.
- L. Zhang, D. S. Zhang, J. P. Zhang, S. X. Cai, C. Fang, L. Huang, H. R. Li, R. H. Gao and L. Y. Shi, Nanoscale, 2013, 5, 9821–9829 RSC.
- S. X. Cai, H. Hu, H. R. Li, L. Y. Shi and D. S. Zhang, Nanoscale, 2016, 8, 3588–3598 RSC.
- Y. L. Wang, Z. Y. Liu, L. Zhan, Z. G. Huang, Q. Y. Liu and J. R. Ma, Chem. Eng. Sci., 2004, 59, 5283–5290 CrossRef CAS.
- Y. L. Wang, X. X. Li, L. Zhan, C. Li, W. M. Qiao and L. C. Ling, Ind. Eng. Chem. Res., 2015, 54, 2274–2278 CrossRef CAS.
- Z. M. Liu, Y. Yi, S. X. Zhang, T. L. Zhu, J. Z. ZhuandJ and G. Wang, Catal. Today, 2013, 216, 76–81 CrossRef CAS.
- G. Qi, R. T. Yang and R. Chang, Appl. Catal., B, 2004, 51, 93–106 CrossRef CAS.
- B. M. Reddy, A. Khan, Y. Yamada, T. Kobayashi, S. Loridant and J. C. Volta, J. Phys. Chem. B, 2003, 107, 5162–5167 CrossRef CAS.
- A. Trovarelli, F. Zamar, J. Llorca, C. deLeitenburg, G. Dolcetti and J. T. Kiss, J. Catal., 1997, 169, 490–502 CrossRef CAS.
- H. Z. Chang, J. H. Li, X. Y. Chen, L. Ma, S. J. Yang, J. W. Schwank and J. M. Hao, Catal. Commun., 2012, 27, 54–57 CrossRef CAS.
- H. Z. Chang, X. Y. Chen, J. H. Li, L. Ma, C. Z. Wang, C. X. Liu, J. W. Schwank and J. M. Hao, Environ. Sci. Technol., 2013, 47, 5294–5301 CrossRef CAS PubMed.
- Y. L. Wang, Z. G. He, L. Zhan and M. Ge, New Carbon Mater., 2015, 30, 533–538 CAS.
- Z. M. Liu, X. Feng, Z. Z. Zhou, Y. J. Feng and J. H. Li, Appl. Surf. Sci., 2018, 428, 526–533 CrossRef CAS.
- A. V. Murugan, T. Muraliganth and A. Manthiram, Chem. Mater., 2009, 21, 5004–5006 CrossRef CAS.
- S. F. Pei and H. M. Cheng, Carbon, 2012, 50, 3210–3228 CrossRef CAS.
- W. S. Hummers and R. E. Offeman, Preparation of graphitic oxide, J. Am. Chem. Soc., 1958, 80, 1339 CrossRef CAS.
- M. E. Yu, C. T. Li, G. M. Zeng, Y. Zhou, X. N. Zhang and Y. E. Xie, Appl. Surf. Sci., 2015, 342, 174–182 CrossRef CAS.
- P. Li, Q. Y. Liu and Z. Y. Liu, Ind. Eng. Chem. Res., 2011, 50, 1906–1910 CrossRef CAS.
- L. Zhang, L. L. Li, Y. Cao, Y. Xiong, S. G. Wu, J. F. Sun, C. J. Tang, F. Gao and L. Dong, Catal. Sci. Technol., 2015, 5, 2188–2196 RSC.
- G. D. Zhang, We. L. Han, H. J. Zhao, L. Y. Zong and Z. C. Tang, Appl. Catal., B, 2018, 226, 117–126 CrossRef CAS.
- Q. C. Lin, J. H. Li, L. Ma and J. M. Hao, Catal. Today, 2010, 151, 251–256 CrossRef CAS.
- J. F. Liang, Y. K. Liu, L. Guo and L. D. Li, RSC Adv., 2013, 3, 11489–11492 RSC.
- K. N. Kudin, B. Ozbas, H. C. Schniepp, R. K. Prud'homme, I. A. Aksay and R. Car, Nano Lett., 2008, 8, 36–41 CrossRef CAS PubMed.
- D. Y. Deng, N. Chen, X. C. Xiao, S. F. Du and Y. D. Wang, Ionics, 2017, 23, 121–129 CrossRef CAS.
- L. Abello, B. Bochu, A. Gaskov, S. Koudryavtseva, G. Lucazeau and M. Roumyantseva, J. Solid State Chem., 1998, 135, 78–85 CrossRef CAS.
- Y. X. Gao, R. T. Li, S. L. Chen, L. F. Luo, T. Cao and W. X. Huang, Phys. Chem. Chem. Phys., 2015, 17, 31862–31871 RSC.
- Y. Xiong, C. J. Tang, X. J. Yao, L. Zhang, L. L. Li, X. B. Wang, Y. Deng, F. Gao and L. Dong, Appl. Catal., A, 2015, 495, 206–216 CrossRef CAS.
- Y. L. Wang, C. Z. Ge, L. Zhan, C. Li, W. M. Qiao and L. C. Ling, Ind. Eng. Chem. Res., 2012, 51, 11667–11673 CrossRef CAS.
- M. Vanitha, Keerthi, P. Cao and N. Balasubramanian, J. Alloys Compd., 2015, 644, 534–544 CrossRef CAS.
- X. L. Li, Y. H. Li, S. S. Deng and T. A. Rong, Catal. Commun., 2013, 40, 47–50 CrossRef.
- X. L. Xu, R. B. Zhang, X. R. Zeng, X. Han, Y. C. Li, Y. Liu and X. Wang, ChemCatChem, 2013, 5, 2025–2036 CrossRef CAS.
- Y. Z. Chen, B. J. Liaw and H. C. Chen, Int. J. Hydrogen Energy, 2006, 31, 427–435 CrossRef CAS.
- M. Machida, M. Uto, D. Kurogi and T. Kijima, J. Mater. Chem., 2001, 11, 900–904 RSC.
- J. L. Zhang, H. J. Yang, G. X. Shen, P. Cheng, J. Y. Zhang and S. W. Guo, Chem. Commun., 2010, 46, 1112–1114 RSC.
- H. M. Xu, Z. Qu, C. X. Zong, W. J. Huang, F. Q. Quan and N. Q. Yan, Environ. Sci. Technol., 2015, 49, 6823–6830 CrossRef CAS PubMed.
- I. Nam, N. D. Kim, G. P. Kim, J. Park and J. Yi, J. Power Sources, 2013, 244, 56–62 CrossRef CAS.
- J. W. Lee, A. S. Hall, J. D. Kim and T. E. Mallouk, Chem. Mater., 2012, 24, 1158–1164 CrossRef CAS.
- W. P. Shan, F. D. Liu, H. He, X. Y. Shi and C. B. Zhang, Catal. Today, 2012, 184, 160–165 CrossRef CAS.
- B. X. Shen, Y. Y. Wang, F. M. Wang and T. Liu, Chem. Eng. J., 2014, 236, 171–180 CrossRef CAS.
- T. T. Gu, Y. Liu, X. L. Weng, H. Q. Wang and Z. B. Wu, Catal. Commun., 2010, 12, 310–313 CrossRef CAS.
- S. X. Yang, W. P. Zhu, Z. P. Jiang, Z. X. Chen and J. B. Wang, Appl. Surf. Sci., 2006, 252, 8499–8505 CrossRef CAS.
- Q. Shen, L. Y. Zhang, N. N. Sun, H. Wang, L. S. Zhong, C. He, W. Wei and Y. H. Sun, Chem. Eng. J., 2017, 322, 46–55 CrossRef CAS.
- B. Guan, H. Lin, L. Zhu and Z. Huang, J. Phys. Chem. C, 2011, 115, 12850–12863 CrossRef CAS.
- X. J. Yao, Y. Xiong, W. X. Zou, L. Zhang, S. G. Wu, X. Dong, F. Gao, Y. Deng, C. J. Tang, Z. Chen, L. Dong and Y. Chen, Appl. Catal., B, 2014, 144, 152–165 CrossRef CAS.
- G. Ramis, Y. Li, G. Busca, M. Turco, E. Kotur and R. J. Willey, J. Catal., 1995, 157, 523–535 CrossRef CAS.
- G. Ramis, Y. Li and G. Busca, Catal. Today, 1996, 28, 373–380 CrossRef CAS.
| This journal is © The Royal Society of Chemistry 2018 |

