
 Open Access Article
 This Open Access Article is licensed under a Creative Commons Attribution-Non Commercial 3.0 Unported Licence
Resveratrol metabolites ameliorate insulin resistance in HepG2 hepatocytes by modulating IRS-1/AMPK†
Wendi Teng ab,
Wenjing Yinab,
Liang Zhaoabc,
Changwei Maabc,
Jiaqiang Huangabc and
Fazheng Ren*abc
ab,
Wenjing Yinab,
Liang Zhaoabc,
Changwei Maabc,
Jiaqiang Huangabc and
Fazheng Ren*abc
aBeijing Advanced Innovation Center for Food Nutrition and Human Health, College of Food Science & Nutritional Engineering, China Agricultural University, P.O. Box 287, No. 17 Qinghua East Road, Beijing 100083, China. E-mail: renfazheng@cau.edu.cn; Tel: +86-10-62736344
bKey Laboratory of Functional Dairy, Co-constructed by Ministry of Education and Beijing Municipality, College of Food Science & Nutritional Engineering, China Agricultural University, Beijing, China
cBeijing Higher Institution Engineering Research Center of Animal Product, College of Food Science & Nutritional Engineering, China Agricultural University, Beijing, China
First published on 23rd October 2018
Abstract
Resveratrol (trans-3,5,4′-trihydroxystilbene, RSV), a naturally occurring biologically active polyphenol has been observed to induce numerous beneficial effects in diabetic animals and humans. However, its protective effects are somewhat controversial due to low bioavailability and rapid clearance rate. Therefore, we in this study have tried to investigate if its main metabolites, RSV-3-O-glucuronide (R3G) and RSV-4-O-glucuronide (R4G) could ameliorate insulin resistance, similar to RSV in insulin-resistant HepG2 cells. Herein, we first established an insulin-resistant cell model by treating HepG2 cells with 1 × 10⁻⁶ mol L−1 insulin for 24 h. Subsequently, the effects of R3G and R4G on insulin resistance inhibition were evaluated in HepG2 cells. Interestingly, our data indicated that R3G and R4G treatment improved cellular glucose uptake and glycogen synthesis contents, and blocked generation of intracellular reactive oxygen species (ROS). Additionally, R3G and R4G also modulated insulin signaling and improved insulin sensitivity by modulating the IRS-1/AMPK signaling pathway. Taken together, our data provided a significant new insight into the effects and molecular mechanism of R3G and R4G on ameliorating insulin resistance in HepG2 cells. Overall, our data supported the hypothesis that despite low bioavailability in vivo, RSV biological effects could be mediated through its metabolites.
1 Introduction
Type 2 diabetes mellitus (T2DM), an intricate metabolic disorder has emerged as a main global public health problem.1 According to the estimates of The World Health Organization, the T2DM global occurrence rate in the year 2016 was a striking 8.5%, which means about 1 in 12 people suffer from this disease.2 In addition, it has been assessed that by the year 2030, there would be about 400 million people suffering from T2DM.3 The morbidity and mortality rate due to T2DM are very high, as it is closely associated with numerous diabetes-related complications, like retinopathy, blindness, nephropathy and cardiovascular disease.4–6 Insulin resistance, a state of reduced response to insulin, is a pivotal pathological feature of T2DM and the primary organs responsive to insulin are liver, skeletal muscle and adipose tissue.7,8 Among these tissues, 90% of the endogenous glucose production occurs in the liver, and increased hepatic gluconeogenesis seems to be the probable cause of fasting hyperglycemia, which eventually exacerbates insulin resistance.9,10 Thus, to ameliorate hepatic insulin resistance and increase sensitivity, various synthetic pharmaceuticals have already been in the market. Nevertheless, multiple clinical studies have highlighted that long-term use of these medicines results in drug resistance and shows various side effects. For instance, among the diabetic patients taking metformin, currently a first-line therapeutic drug to prevent hepatic glucose generation, 30% of them develop nausea, bloating, abdominal pain, or diarrhea, and 5–10% are thus unable to go on with metformin.11,12 These examples highlight the importance to identify additional natural active compounds which can potentially improve hepatic insulin sensitivity with least side effects.Resveratrol (RSV, Fig. 1), an active polyphenol primarily found in red grapes and nuts, is well known for anti-diabetic effects in both animals and humans. It has been shown to be involved in maintaining glucose homeostasis, decreasing insulin resistance, protecting pancreatic β-cells, promoting insulin secretion and relieving metabolic disorders. Its effects have mainly been shown to be triggered largely due to its ability to activate AMP-activated protein kinase (AMPK) and sirtuin 1 in peripheral tissues of diabetic subjects.13 However, these protective effects are debatable, as RSV pharmacokinetics studies have reported about its low bioavailability, and rapid clearance from the circulation.14–16 Two human studies analyzed the absorption and bioavailability of RSV after an oral dose of 25 mg,17,18 and showed that it was difficult to detect nonmetabolized RSV in circulating plasma, despite using high sensitivity detection methods. Approximate calculations indicated that maximal concentrations, after 0.5–2 hours of oral dose, were under 10 ng mL−1. However, RSV plasma concentrations along with its metabolites, mainly RSV-3-O-sulfate, RSV-3-O-glucuronide (R3G, Fig. 1), and RSV-4-O-glucuronide (R4G, Fig. 1), were quite higher, nearly 400–500 ng mL−1. These studies thus suggested very low oral bioavailability of free RSV, but relatively high bioavailability of its metabolites.17,18 This led to the assumption that conjugated metabolites might principally contribute to RSV activity, despite its low bioavailability and little information about its metabolite activity.19–21 However, one earlier study has shown that one of its metabolite, RSV-3-sulfate failed to inhibit human cytochrome P450 isozymes,22 and currently there is no evidences of it crossing the plasma membrane. Therefore, in our study, we have tried to compare and investigate the protective effects of R3G and R4G, using insulin-resistant HepG2 cells.
 | ||
| Fig. 1 Chemical structures of RSV and RSV metabolites. RSV, resveratrol; R3G, resveratrol-3-O-glucuronide; R4G, resveratrol-4-O-glucuronide. | ||
2 Materials and methods
2.1 Materials and chemicals
RSV (purity > 99%) and human recombinant insulin were obtained from Sigma-Aldrich (St. Louis, MO, USA). R3G (purity > 98%) and R4G (purity > 95%) compounds were procured from Bertin Pharma (Montigny-le-Bretonneux, France). All three chemicals were dissolved in dimethyl sulfoxide and the solutions were stored in −20 °C. 2-[N-(7-Nitrobenz-2-oxa1,3-diazol-4-yl) amino]-2-deoxy-D-glucose (2-NBDG) was purchased from Life Technologies (Carlsbad, CA, USA). The antibody to β-actin was obtained from Abcam (Cambridge, UK), while anti-AMPKα, anti-AMPKα (Thr172), anti-IRS-1, anti-phospho-IRS-1 (Ser307) and anti-phospho-IRS-1 (Ser612) rabbit anti-human polyclonal antibodies were purchased from Cell Signaling Technology. The antibody to Phospho-IRS-1 (Tyr608) was obtained from Millipore (Billerica, MA, USA). All chemicals used in our study were of analytical grade.2.2 Cell culturing and establishment of insulin resistance model
Human hepatic carcinoma, HepG2 cells were obtained from American Type Culture Collection (Rockville, MD, USA), and were cultured in Minimum Essential Medium (MEM) containing 10% fetal bovine serum, 1% MEM non-essential amino acids, streptomycin (100 μg mL−1) and penicillin (100 U mL−1) (Invitrogen, Carlsbad, CA, USA). Cells were grown in a 37 °C incubator with 5% CO2 and 95% humidity.Insulin-resistant cell model was established according to the previously described method.23 Briefly, HepG2 cells (5 × 10⁴ cells) were seeded into each well of 12-well plates, and after 24 h incubation, the medium was exchanged with FBS-free medium containing 1 × 10⁻⁹, 1 × 10⁻⁸, 1 × 10⁻⁷, 1 × 10⁻⁶, 1 × 10⁻⁵ mol L−1 of insulin for 12, 24 and 36 h. After this treatment, 1 × 10⁻⁶ mol L−1 of insulin for 24 h were finalized to build the insulin-resistant cell model.
2.3 Cell viability assessment
The HepG2 cells viability was detected using Cell Counting Kit-8 (CCK-8) colorimetric assay (Beyotime, Haimen, Jiangsu, China), according to the manufacturer's instructions. In brief, HepG2 cells were seeded at a density of 1 × 10⁴ cells per well into 96-well plates, and cultured in complete MEM culture medium for 12 h. Then, the cells were treated with various concentrations of insulin (1 × 10⁻⁹, 1 × 10⁻⁸, 1 × 10⁻⁷, 1 × 10⁻⁶ and 1 × 10⁻⁵ mol L−1) or various concentrations of RSV, R3G and R4G (0.001, 0.01, 0.1, 1, 10 and 100 μM) for 24 h. Next, CCK8 reagent was added to each well, followed by incubation at 37 °C in a 5% CO2 incubator for another 1 h. Finally, absorbance was quantified by a microplate reader at 450 nm (Bio-Rad, Hercules, CA, USA), and cell viability was calculated as percentage values, as compared to the control group.2.4 Cellular glucose uptake analysis
Cellular glucose uptake was detected using 2-NBDG reagent, as described previously.24 Briefly, cells were plated into 12-well plates at a density of 5 × 10⁴ cells per well. The cells were treated with 1 × 10⁻⁶ mol L−1 of insulin for 24 h. Then, the cells were treated with various concentrations of RSV, R3G and R4G (0.001, 0.01, 0.1, 1, 10 μM) in the presence of 1 × 10⁻⁶ mol L−1 of insulin for another 24 h. After washing the cells twice with phosphate-buffered saline (PBS) (pH 7.4), 2-NBDG solution was added to each well, at a final concentration of 10 μM, and plates were incubated at 37 °C. After 1 h, cells were again washed three times with PBS to remove remaining 2-NBDG reagent, and the cells were subsequently suspended for flow cytometry analysis using FACS CytoFLEX flow cytometer (Beckman Coulter, S. Kraemer Boulevard Brea, CA, USA), at an excitation wavelength of 488 nm and an emission wavelength of 535 nm. Data were analyzed using CytExpert 2.0.0 software (Beckman Coulter, S. Kraemer Boulevard Brea, CA, USA).2.5 Determination of intracellular glycogen content
To measure the glycogen content, cells were seeded into a 6-well plate, at a density of 3 × 10⁵ cells per well. The cells were treated with 1 × 10⁻⁶ mol L−1 of insulin for 24 h. Then, the cells were cultured with 1 μM of RSV, R3G and R4G in the presence of 1 × 10⁻⁶ mol L−1 of insulin for another 24 h. After treatment, cells were collected after washing three times with PBS. The glycogen content in the cells was assayed by using anthrone reagent, and the amount of blue compound generated by this reaction was detected at 620 nm wavelength using microplate reader (Bio-Rad, Hercules, CA, USA). In addition, the protein content of the collected HepG2 cells was quantified by BCA method, and the values were showed as ratio of glycogen (mg)/protein (mg).2.6 Detection of intracellular ROS levels
The intracellular ROS levels were detected using 2,7-dichlorodi-hydrofluorescein diacetate (DCFH-DA) probe, as per the manufacturer's instructions (Beyotime, Haimen, Jiangsu, China). Cells were plated into 12-well plates at a density of 5 × 10⁴ cells per well. The cells were treated with 1 × 10⁻⁶ mol L−1 of insulin for 24 h. Then, the cells were cultured with 1 μM of RSV, R3G and R4G in the presence of 1 × 10⁻⁶ mol L−1 of insulin for another 24 h. After treatments, cells were washed twice with PBS, and 10 μM of DCFH-DA reagent was added to each well, and cells were further incubated at 37 °C. After 20 min, cells were again washed three times with PBS to remove uncombined DCFH-DA probe. Next, the cells were suspended for flow cytometry analyses using FACS CytoFLEX flow cytometer (Beckman Coulter, S. Kraemer Boulevard Brea, CA, USA), at an excitation wavelength of 488 nm and emission wavelength of 525 nm. Data were analyzed using CytExpert 2.0.0 software (Beckman Coulter, S. Kraemer Boulevard Brea, CA, USA).2.7 Western blotting
HepG2 cells were lysed in ice-cold radio immunoprecipitation assay lysis buffer, and isolated proteins were separated by protein gel electrophoresis, followed by transfer to the membrane. Later individual immunoblots were probed with anti-IRS-1, p-IRS-1, AMPKα and p-AMPKα antibodies at 1![[thin space (1/6-em)]](https://www.rsc.org/images/entities/char_2009.gif) :1000 dilution, and anti-β-actin antibody at 1:2500 dilution. Finally, the band signal intensities were determined by ImageJ software, as described previously.24
:1000 dilution, and anti-β-actin antibody at 1:2500 dilution. Finally, the band signal intensities were determined by ImageJ software, as described previously.24
2.8 Statistical analysis
All experiments in the current study were performed at least in triplicate and data were presented as mean ± standard deviation (SD). The significant differences (p < 0.05) between means were assessed by one-way ANOVA test using SPSS 19.0 software.3 Results
3.1 Establishment of insulin-resistant HepG2 cell model
To develop insulin-resistant HepG2 cells, we first evaluated the effects of different insulin concentrations on glucose uptake. The HepG2 cells were initially cultured in media containing 1 × 10⁻⁹, 1 × 10⁻⁸, 1 × 10⁻⁷, 1 × 10⁻⁶ and 1 × 10⁻⁵ mol L−1 of insulin for 12, 24 and 36 h, and glucose uptake was detected using fluorescent 2-NBDG reagent. As seen in Fig. 2A, the cells incubated with 1 × 10⁻⁶ mol L−1 insulin for 24 h showed significant decrease in the cellular glucose uptake as compared to the control cells without insulin treatment. In parallel, we also analyzed the effects of different concentrations (1 × 10⁻⁹, 1 × 10⁻⁸, 1 × 10⁻⁷, 1 × 10⁻⁶ and 1 × 10⁻⁵ mol L−1) of insulin on inducing cell cytotoxicity. The CCK-8 assay showed no cytotoxicity as seen in Fig. 2B. In addition, we also independently validated the developed insulin-resistant HepG2 cell model by measuring glycogen level and ROS generation. As seen in Fig. 2C and D, compared to control group, 1 × 10⁻⁶ mol L−1 insulin treated cells displayed significantly decreased glycogen level, and markedly increased ROS production. Next, we also investigated the mechanism of insulin resistance, by analyzing the phosphorylation status of insulin receptor substrate-1 (IRS-1) and AMPK signaling molecules. The 1 × 10⁻⁶ mol L−1 insulin treatment of HepG2 cells increased IRS-1 Ser307, Ser612 phosphorylation and decreased IRS-1 Tyr608 and AMPK Thr172 phosphorylation in comparison to HepG2 cells cultured under normal conditions, as seen in Fig. 2E. Thus, all these results indicated that 10−6 mol L−1 insulin treatment for 24 h induced insulin resistance in HepG2 cells. To further investigate the stability of this insulin-resistant HepG2 model, the cells were grown in medium without insulin for another 24, 48 and 72 h respectively (Fig. 2F), and it appeared that the model remained stable for 24 h, and cellular glucose uptake then slightly went up after 48 and 72 h.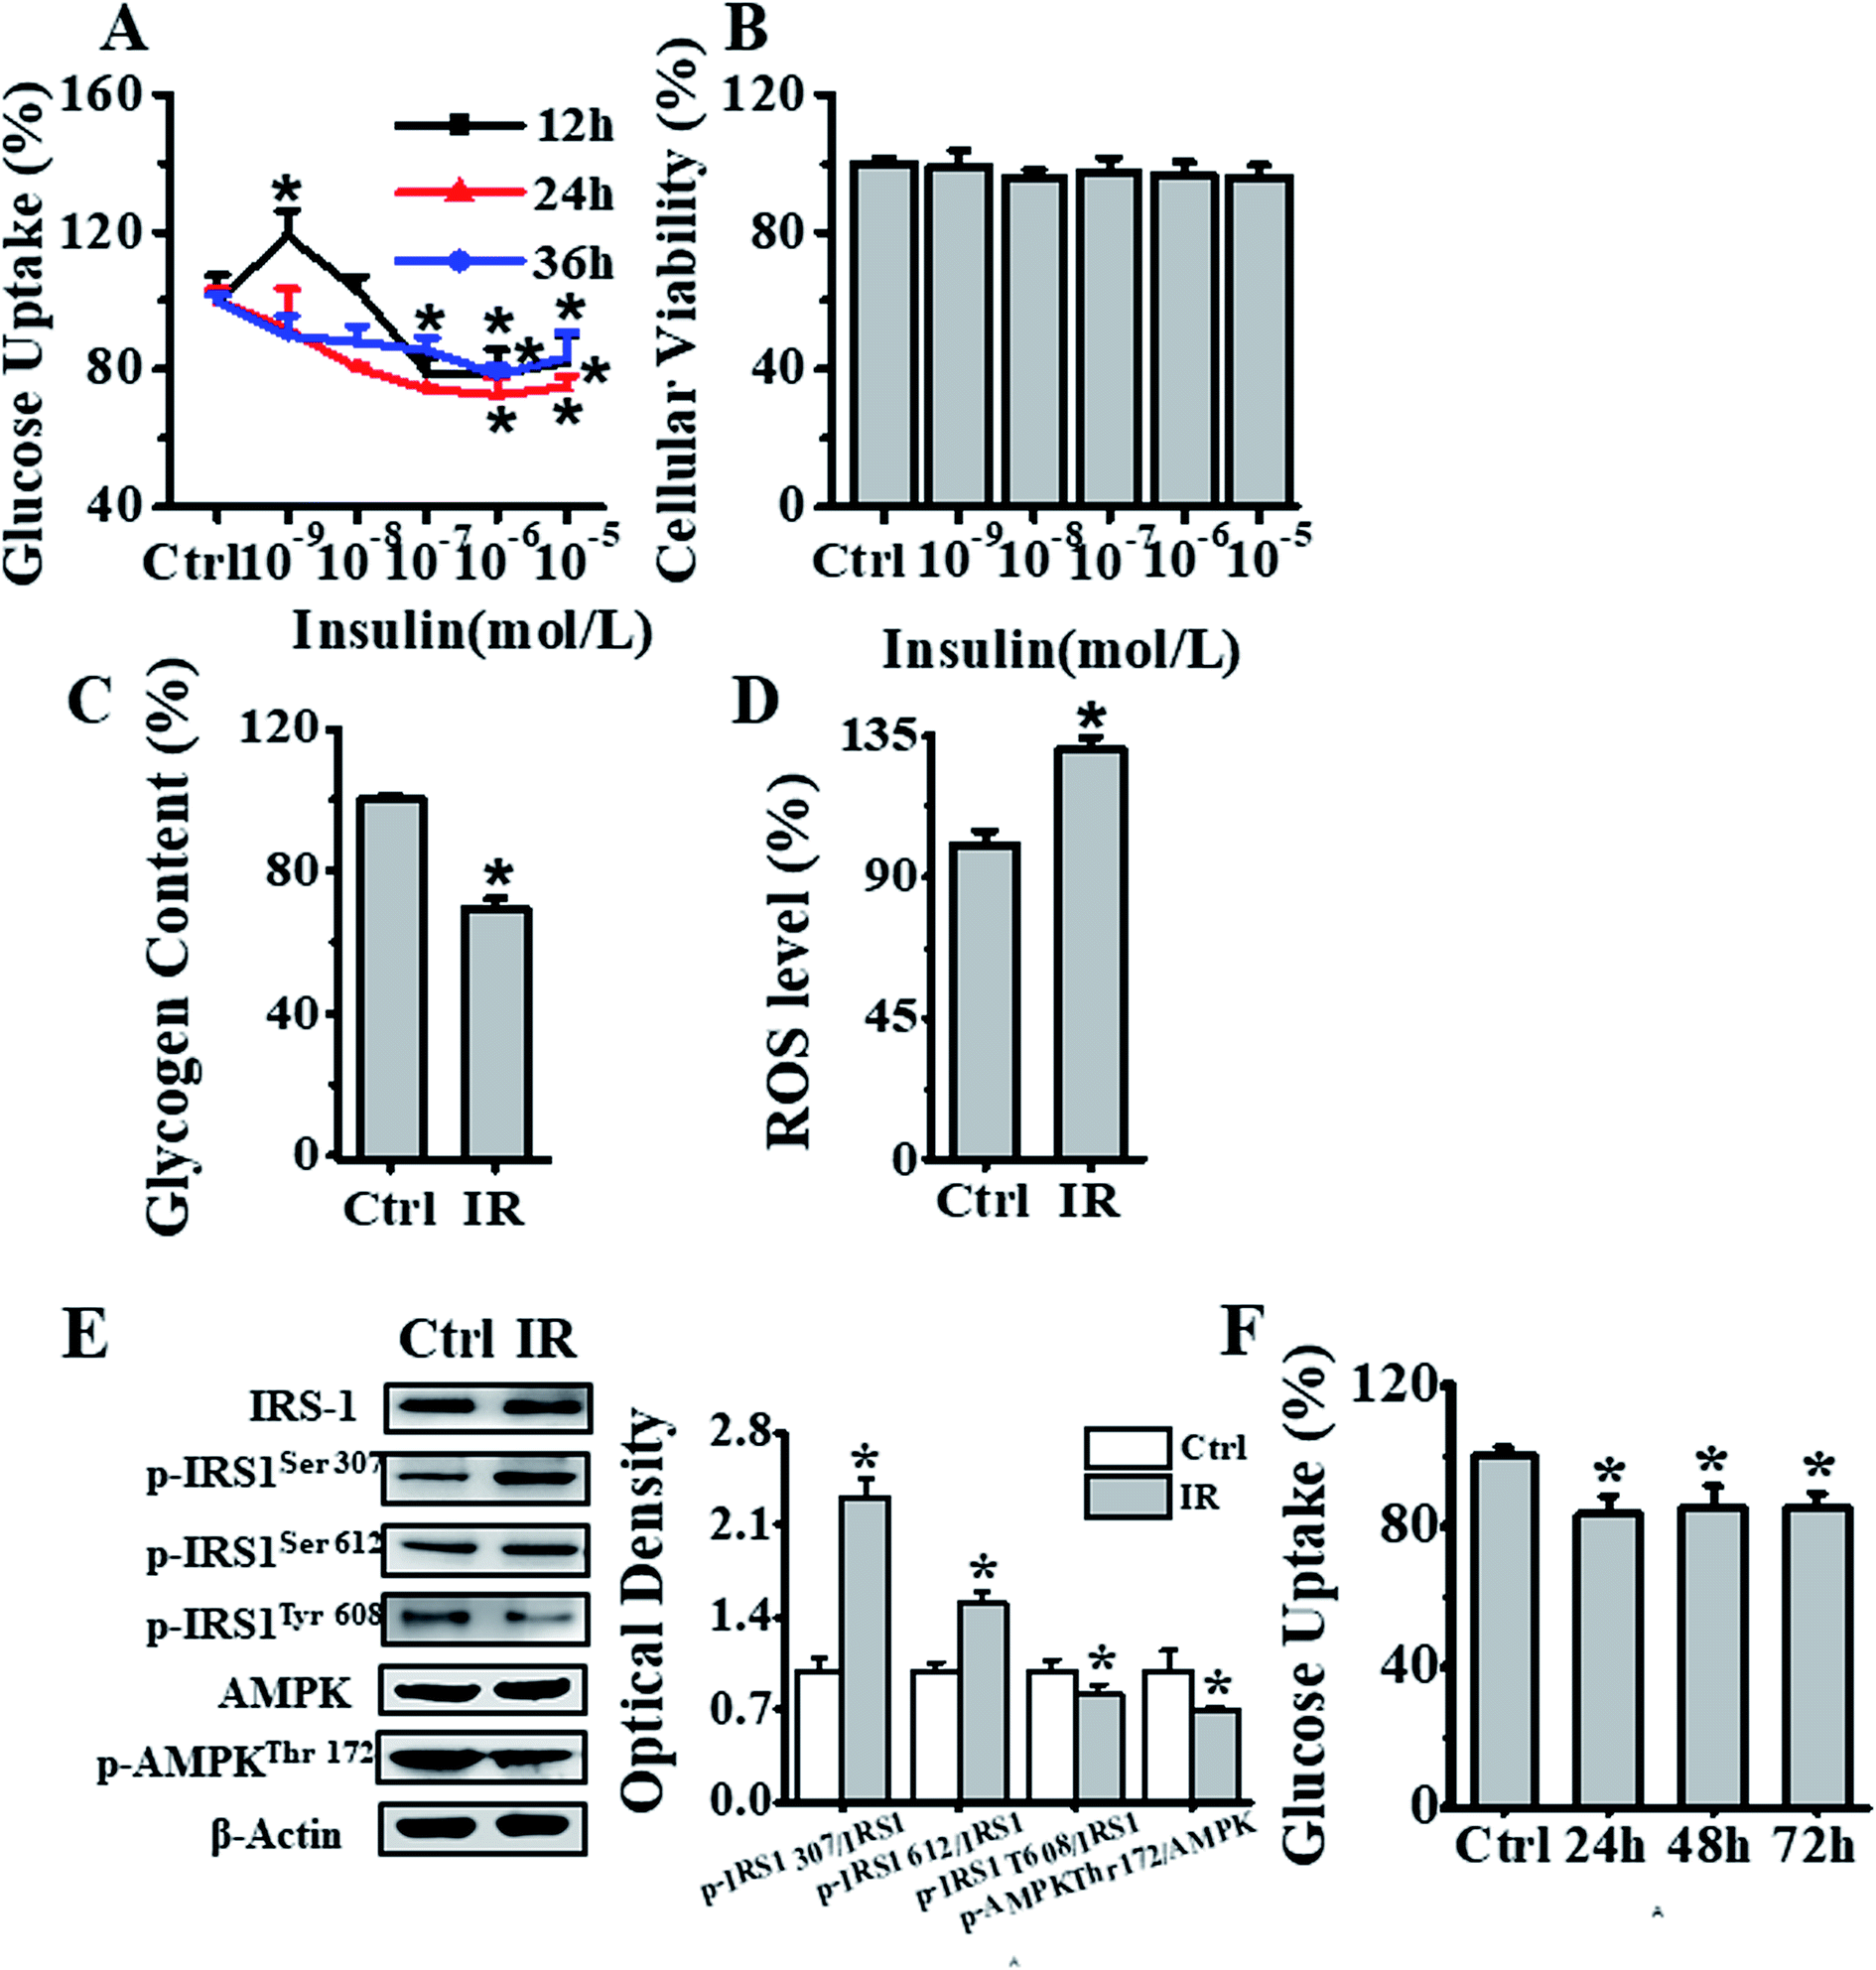 | ||
| Fig. 2 Establishment of an insulin-resistant cell model. (A) Effects of different concentrations (0, 1 × 10⁻⁹, 1 × 10⁻⁸, 1 × 10⁻⁷, 1 × 10⁻⁶, 1 × 10⁻⁵ mol L−1) of insulin on glucose uptake in HepG2 cells. Black, red and blue lines represented insulin treatment for 12, 24, & 36 h respectively, and the results were expressed as percentage of mean fluorescence intensity relative to control cells. (B) Cell viability analysis of cells treated with different concentrations (0, 1 × 10⁻⁹, 1 × 10⁻⁸, 1 × 10⁻⁷, 1 × 10⁻⁶ and 1 × 10⁻⁵ mol L−1) of insulin for 24 h, by CCK-8 method, and the results were expressed as percentage viability relative to the control group. (C) Glycogen content estimation in cells after treatment with 1 × 10⁻⁶ mol L−1 insulin for 24 h. The results were expressed as percent of control. (D) Flow cytometry-based assessment of intracellular ROS levels in cells treated with 1 × 10⁻⁶ mol L−1 insulin for 24 h, using DCFH-DA fluorescent reagent. The results were expressed as mean fluorescence intensity. (E) Analysis of the 1 × 10⁻⁶ mol L−1 insulin treatment effects after 24 h on IRS-1 and AMPK phosphorylation status in HepG2 cells. (F) Analysis of insulin-resistant HepG2 cells stability, as measured by glucose uptake after treatment of cells first with 1 × 10⁻⁶ mol L−1 insulin for 24 h, and later further culturing them in medium without insulin for another 24, 48 and 72 h. Represented values are means ± SD from three separate experiments. *p < 0.05 vs. control cells. IR, insulin resistance. | ||
3.2 Analyzing the effects of different RSV, R3G and R4G concentrations on cell viability
To determine the potential effects of RSV, R3G and R4G on cell viability, HepG2 cells were exposed to various concentrations (0.001, 0.01, 0.1, 1, 10 and 100 μM) of these compounds for 24 h. As displayed in Fig. 3A, compared with control group, RSV treatment impacted cell viability of HepG2 cells at concentrations of 10 μM and 100 μM, with 100 μM showing statistically significant decrease (P < 0.01). Similarly, data in Fig. 3B and C revealed that 100 μM of R3G and R4G also affected cell growth. Therefore, 0.001, 0.01, 0.1, 1 and 10 μM concentrations of these three compounds were selected for subsequent experiments.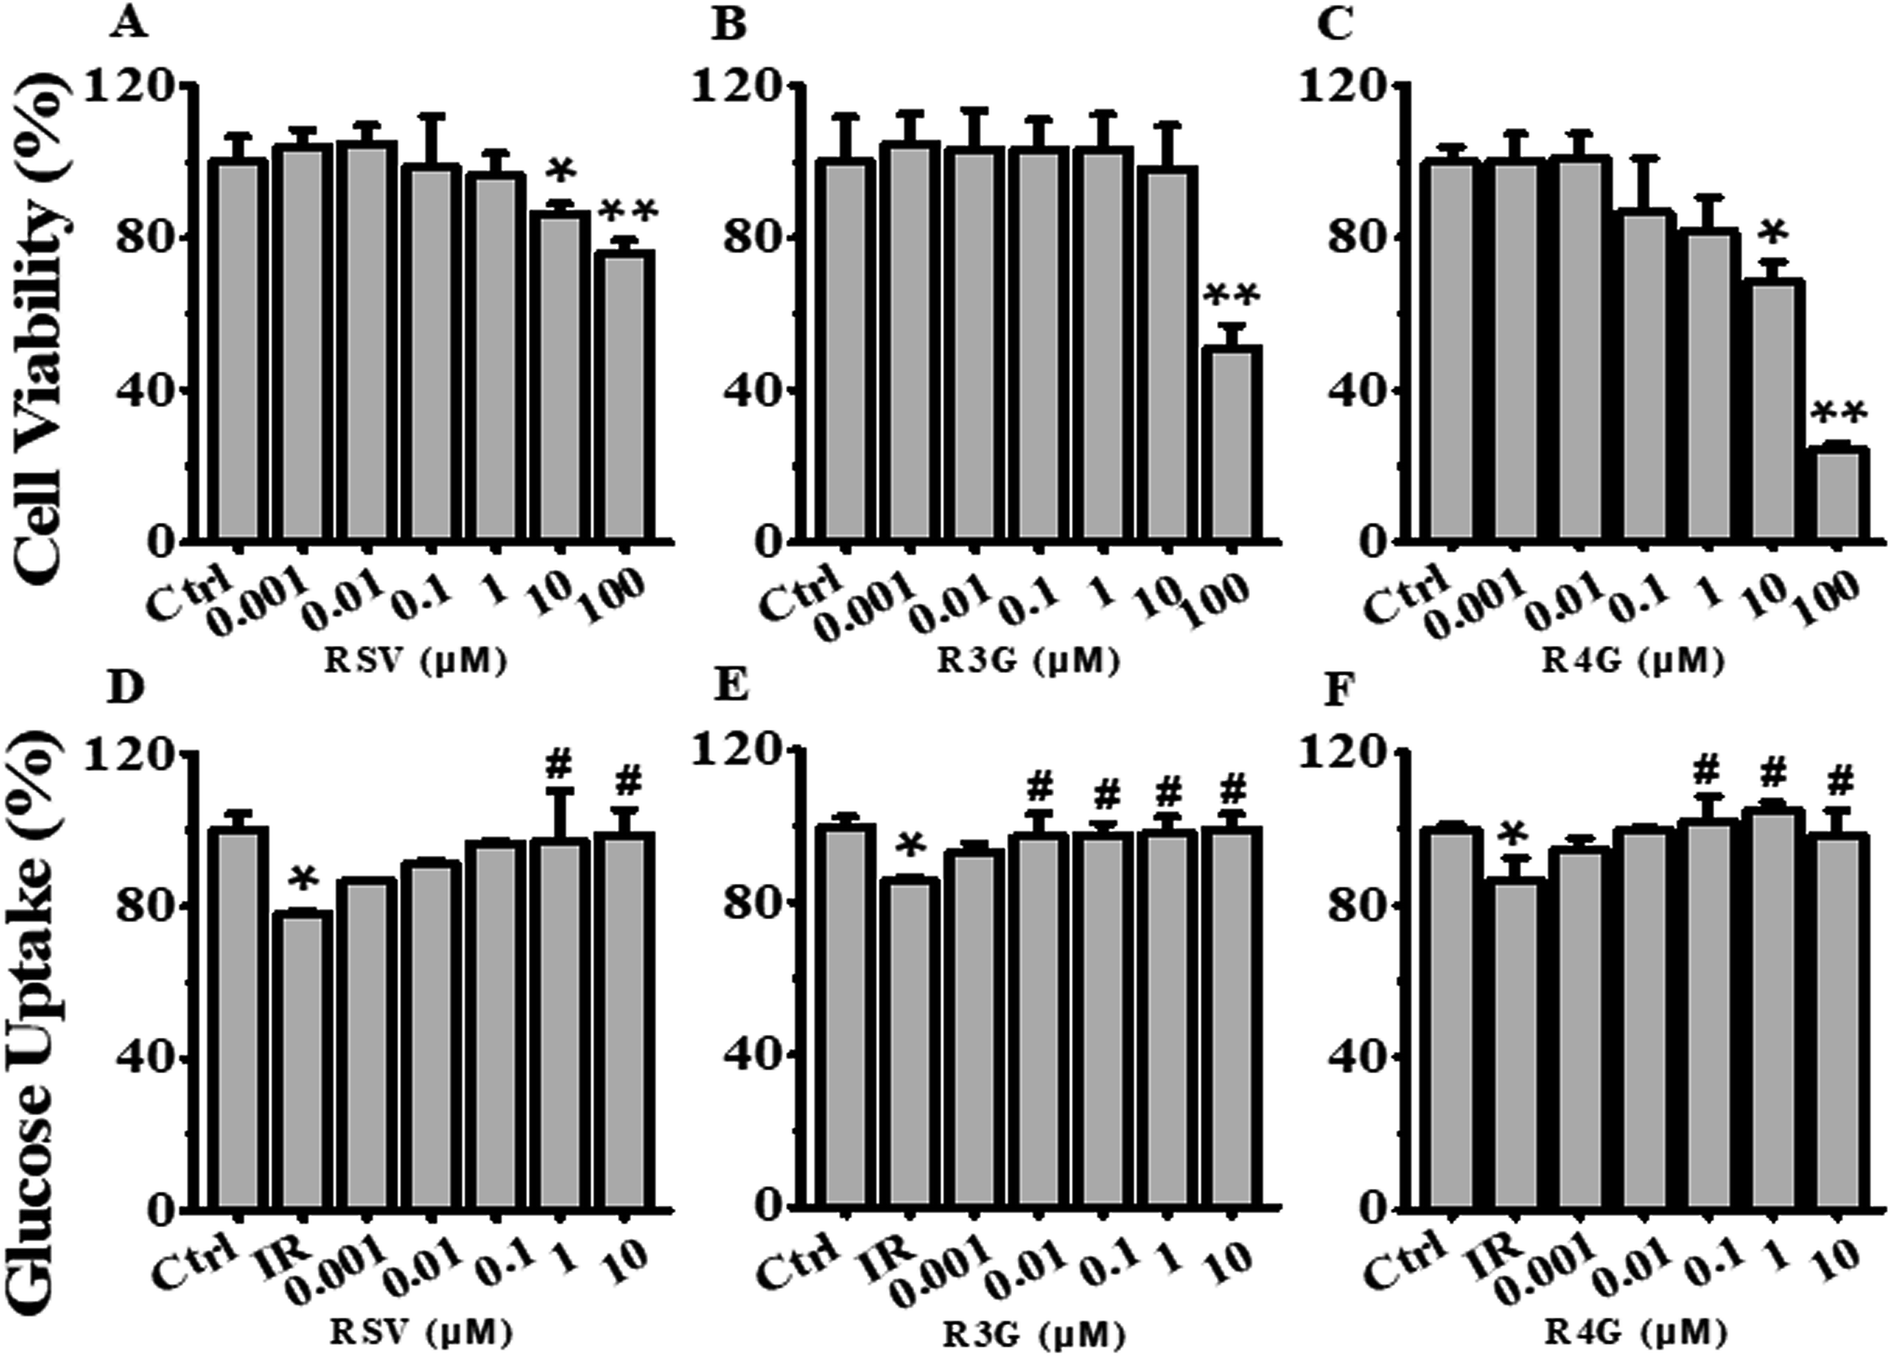 | ||
| Fig. 3 Effects of different concentrations of RSV, R3G and R4G on cell viability and glucose uptake in HepG2 cells. (A–C) Cells were treated with different concentrations (0.001, 0.01, 0.1, 1, 10 and 100 μM) of RSV, R3G and R4G for 24 h, and then cell viability was assessed and expressed as a percentage relative to the control group. (D–F) Cellular glucose uptake was analyzed in cells first incubated with 1 × 10⁻⁶ mol L−1 insulin for 24 h, then cultured in medium containing different concentrations (0.001, 0.01, 0.1, 1 and 10 μM) of RSV, R3G and R4G for another 24 h. The values represented percentage of control and are means ± SD from three separate determinations. *p < 0.05, **p < 0.01 vs. control cells; #p < 0.05 vs. only insulin-resistant HepG2 cells. IR, insulin resistance; RSV, resveratrol; R3G, resveratrol-3-O-glucuronide; R4G, resveratrol-4-O-glucuronide. | ||
3.3 R3G and R4G enhanced cellular glucose uptake in insulin-resistant HepG2 cells
The potential role of R3G and R4G on glucose uptake in insulin-resistant HepG2 cells was analyzed, after treating the cells with different concentrations of RSV, R3G and R4G for another 24 h. As seen in Fig. 3D–F, compared with control group, insulin stimulation significantly decreased the cellular glucose uptake (p < 0.05), but this was notably improved by 1 and 10 μM of RSV treatment, 0.01, 0.1, 1 and 10 μM of R3G treatment, and 0.1, 1 and 10 μM of R4G treatment. Since 1 and 10 μM were the common effective dose of the three compounds and 1 μM was the smaller one, meanwhile 10 μM of RSV and R4G slightly inhibited cell viability (Fig. 3A and C), we selected 1 μM concentration for the subsequent experiments. As revealed in Fig. 4A, the decreased cellular glucose uptake was notably prevented by 1 μM of RSV, R3G and R4G treatments by 19.67%, 15.06% and 22.25, respectively. Similarly, we found R3G and R4G could also alleviate insulin resistance in primary mouse hepatocytes and differentiated C2C12 cells (Fig. S1A and S1B†).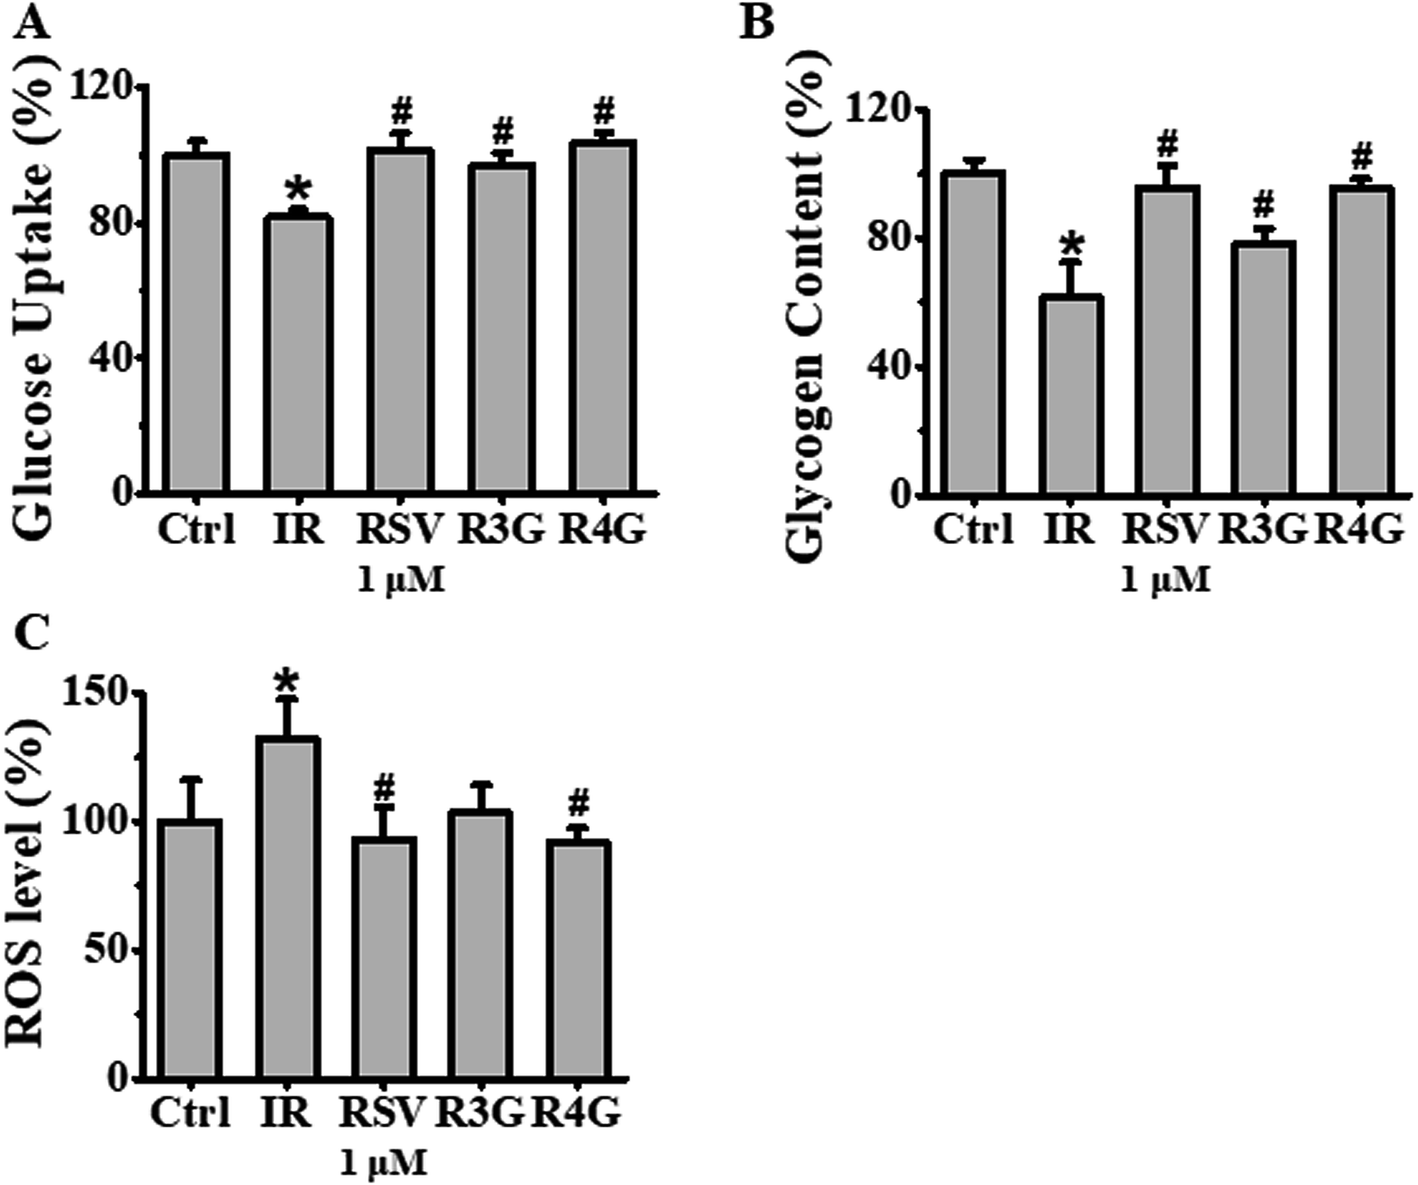 | ||
| Fig. 4 Effects of RSV, R3G and R4G treatment on cellular glucose uptake, glycogen synthesis and ROS levels in insulin-resistant HepG2 cells. After cells were incubated with 1 × 10⁻⁶ mol L−1 insulin for 24 h, the medium was discarded and was further grown with 1 μM of RSV, R3G and R4G for another 24 h, respectively. Panel A showed glucose uptake expressed as percentage of control in insulin-resistant HepG2 cells. Panel B showed glycogen content expressed as percentage of control. Panel C showed ROS levels expressed as mean fluorescence intensity. Values shown are means ± SD from three separate determinations. *p < 0.05; #p < 0.05 vs. only insulin-resistant HepG2 cells. | ||
3.4 R3G and R4G improved cellular glycogen synthesis in insulin-resistant HepG2 cells
Next, to investigate the effects of R3G and R4G on glycogenesis of insulin-resistant HepG2 cells, we assessed the intracellular glycogen levels. As observed in Fig. 4B, compared to control group, 1 × 10⁻⁶ mol L−1 insulin treatment decreased the glycogen levels (p < 0.05). However, this reduced intracellular glycogen contents was recovered by RSV, R3G and R4G treatment by 34.25%, 16.92% and 33.83%, respectively. This implied that R3G and R4G increased intracellular glycogen synthesis in insulin-resistant HepG2 cells, as RSV did.3.5 R3G and R4G decreased intracellular ROS generation in insulin-resistant HepG2 cells
We also evaluated the effects of R3G and R4G on intracellular ROS generation by assessing cellular ROS levels using DCFH-DA fluorescent probe. Our results in Fig. 4C clearly demonstrated that 1 × 10⁻⁶ mol L−1 insulin treatment markedly increased ROS production, in comparison to the control cells without any insulin treatment (p < 0.05). As expected, 1 μM treatment of RSV, R3G and R4G was able to reduce insulin-induced ROS production by 29.7%, 22% and 30.3%, respectively. This data indicated that R3G and R4G could effectively eliminate intracellular ROS generation in insulin-resistant HepG2 cells.3.6 R3G and R4G regulated phosphorylation of IRS-1 and AMPK in insulin-resistant HepG2 cells
To understand the signaling pathway involved in induction of insulin resistance, we analyzed the phosphorylation status of IRS-1 and AMPK signaling proteins. As observed in Fig. 5A, 1 × 10⁻⁶ mol L−1 insulin exacerbated phosphorylation of IRS-1 at Ser307, Ser612, and weakened the phosphorylation of IRS-1 at Tyr608. However, RSV, R3G and R4G treatment reduced IRS-1 Ser307 phosphorylation 47.1%, 38.8% and 45%, reduced Ser612 phosphorylation 39.2%, 34% and 57% and enhanced Tyr608 phosphorylation 38.5%, 28.1% and 96%, respectively. Similarly, threonine 172 phosphorylation of AMPK was reduced following 1 × 10⁻⁶ mol L−1 insulin treatment in HepG2 cells as compared to control treatment, whereas RSV, R3G and R4G treatments rescued the reduced phosphorylation by 41.5%, 7.5% and 38%, respectively (Fig. 5B). Overall, these results indicated that R3G and R4G alleviate insulin resistance by regulating IRS-1/AMPK signaling pathway, just like RSV.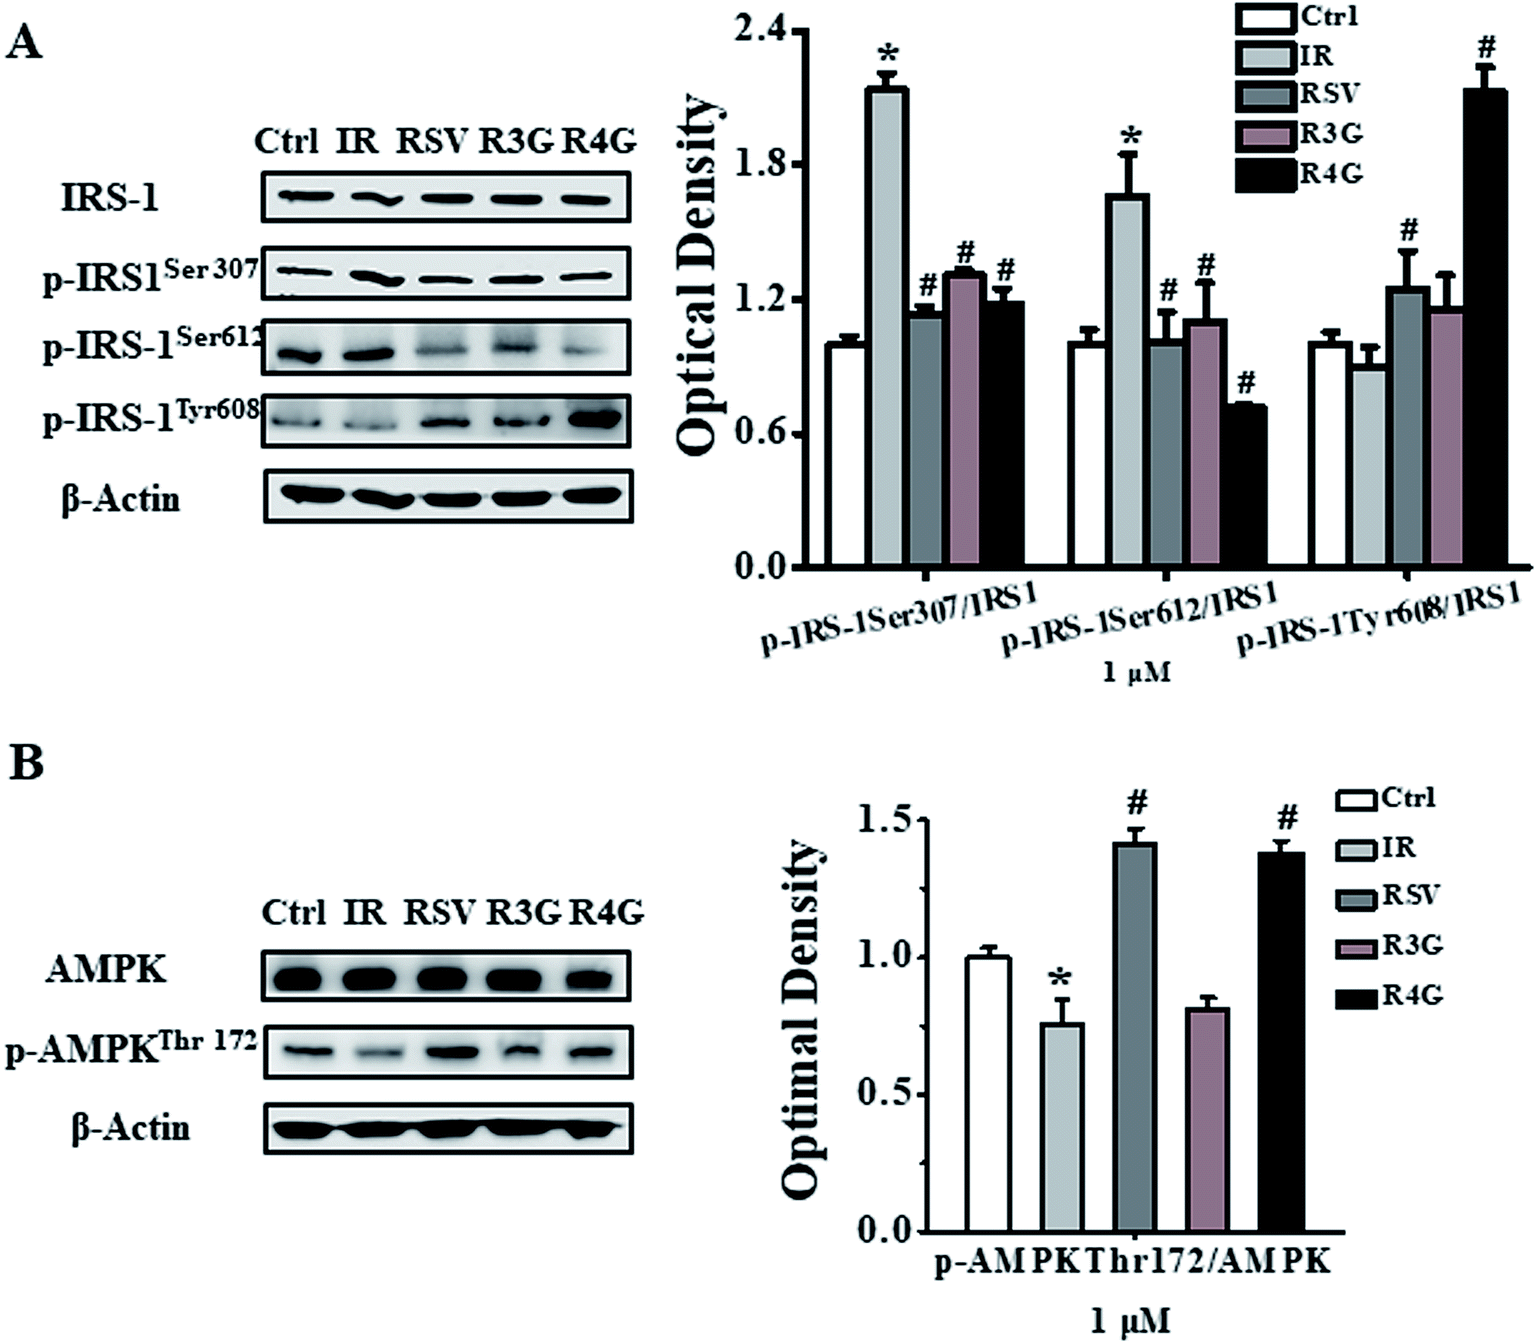 | ||
| Fig. 5 Effects of RSV, R3G and R4G treatment on IRS-1/AMPK signaling pathway in insulin-resistant HepG2 cells. After cells were incubated with 1 × 10⁻⁶ mol L−1 insulin for 24 h, their media was discarded and was grown in the presence of medium containing 1 μM of RSV, R3G and R4G for another 24 h, respectively. The left side of panel of A showed representative western blot for phosphorylated and total levels of IRS-1, while the right side depicted quantitative analysis of each band. Similarly, left side of panel B showed a representative western blot of phosphorylated and total AMPK levels, and right side depicted quantitative analysis of each band. Values shown are means ± SD from three separate determinations. *p < 0.05; #p < 0.05 vs. only insulin-resistant HepG2 cells. | ||
4 Discussion
RSV, as a naturally active polyphenol, its advantageous effects have been well investigated. Nevertheless, since its low bioavailability and rapid clearance from the circulation, RSV is quickly transformed into its metabolites. Thus, it is important to explore the potential activity of RSV metabolites, in order to better understand RSV mechanisms of action. Earlier study by Virginie Aires et al. showed that mixture of RSV metabolites inhibited human colon carcinoma and metastatic cell proliferation through accumulation of cells in DNA replication phase.25 Another study by Itziar Eseberri et al. demonstrated that RSV and its metabolites exerted inhibitory effect on adipogenesis through up-regulation of miR-155 in 3T3-L1 maturing pre-adipocytes.26 However, very little information is available about role of RSV metabolites in regulating insulin resistance and their anti-diabetic effects. In this regard, our study for the first time showed that R3G and R4G could relieve insulin resistance and improve insulin sensitivity in vitro.HepG2 cells are extensively used for biological and nutritional researches as a cell cultured model of human hepatocytes because of their retained morphology and most of function in culture.27,28 Therefore, this cell line has been a nice choice to mimic in vitro hepatic glucose generation and regulation of insulin signaling pathway.29 Thus, in current study we established the insulin-resistant HepG2 cell model with 1 × 10⁻⁶ mol L−1 insulin treatment and found it could be stable for another 24 h. Among various human tissues, liver has a primary role in regulating glucose homeostasis and maintenance of normal blood glucose levels by controlling the balance between gluconeogenesis, glycogen synthesis and glycogenolysis.30 The primary function of insulin in the liver is to decrease the hepatic glucose production by activating glycogen synthesis and inhibiting gluconeogenesis.31 Consistent with this, hepatic insulin resistance is characterized by reduced ability of insulin to enhance cellular glycogen synthesis and decrease gluconeogenesis. In this regard, our data suggested that R3G and R4G treatment reversed the negative effect of insulin resistance on glucose metabolism, partially through promoting glycogenesis and inhibiting hepatic glucose generation. On comparing these two metabolites, it was observed that R4G had better effect on enhancing cellular glucose metabolism than R3G in insulin-resistant HepG2 cells. Earlier study by Sifan Chen et al. demonstrated that RSV treatment significantly increased glucose uptake in insulin-resistant 3T3-L1 adipocytes through activating sirtuin 1 and glucose transporter 4.32 Also, study by Jeng-YuanYao et al. showed that RSV upregulated glycogen synthesis in type 1 diabetes mellitus induced metabolic disorders in rats, probably through recovering hepatic mTORC1 activity.33 These studies consistently concluded that RSV recovered impaired glucose metabolism partially through promoting glycogenesis and inhibiting hepatic glucose generation. However, in our study, we demonstrated that R3G and R4G could also modulate hepatic glucose metabolism.
Importantly, insulin resistance has also been suggested to be triggered by mitochondrial oxidants due to excess fuels within mitochondria in lack of increased energy demand.34 In fact, surplus energy leads to an accumulation of mitochondrial ROS production, which leads to a more oxidized intracellular redox environment, and subsequently may cause insulin resistance, via directly targeting proteins involved in the glucose uptake process.35,36 Our data revealed that R3G and R4G were effectively able to eliminate ROS generation. Here again R4G showed better response. A number of in vitro and in vivo studies based on cells and T2DM animal models displayed the connection between ROS generation and insulin resistance. Like, the study by Marilena Lepretti et al. showed that dietary omega 3 polyunsaturated fatty acids were able to recover insulin resistance by modulating ROS production and endoplasmic reticulum stress.37 Similarly, Hoehn et al. also showed that manganese(III) tetrakis (4-benzoic acid) porphyrin, a broad-spectrum antioxidant, was capable of scavenging not only O2− and H2O2, but also reactive nitrogen species, and improved glucose tolerance in HFD-fed C57BL/6JSlc mice.38 Thus, it was important to highlight that R3G and R4G were also able to reduce cellular ROS levels in insulin-resistant HepG2 cells.
Excess ROS production also exacerbate insulin resistance via directly targeting IRS/AMPK signaling pathway. Soon-Hee Kim et al. showed that capsaicin increased glucose uptake via ROS generation and consequent AMPK activations. When ROS were captured using the nonspecific antioxidant N-acetylcysteine, the increase in both capsaicin-induced AMPK phosphorylation and capsaicin-induced glucose uptake was attenuated, suggesting that ROS function as an upstream activator of AMPK.47 Zakłosszyda M. et al. also demonstrated that pretreatment of the insulin-resistant HepG2 cells with Japanese quince fruit polyphenolic extract caused decrease of intracellular ROS generation and influenced mitochondrial membrane polarization which seemed to lead to AMPK and IRS1/2 activation.48 IRS/AMPK signaling pathway has been shown to be closely related with regulation of insulin-induced elevated glycogenesis and suppression of hepatic glucose production.39 This signaling axis is generally weakened in hepatocytes and livers of T2DM patients.40–42 Under insulin-resistant condition, IRS-1 serine site is phosphorylated, and is followed by inhibition of IRS-1 tyrosine phosphorylation, which prevents IRS binding to insulin receptor. This in turn inhibits downstream signaling pathway, and insulin-stimulated glucose metabolism.27 Similarly, hepatic dysregulation of AMPK has also been shown to be related with insulin resistance and disordered glucose utilization.43 Activated AMPK usually promotes insulin signaling by enhancing tyrosine and inhibiting serine phosphorylation of IRS-1, and thus improves insulin sensitivity and regulates glucose homeostasis.39 Therefore, AMPK activation has been a target for alleviating insulin resistance and T2DM.44 Interestingly, in our study we observed that R3G and R4G reduced IRS-1 serine 307, 612 phosphorylation, and enhanced IRS-1 tyrosine 608 and AMPK threonine 172 phosphorylation. In addition, we found that R4G treatment was more effective to relieve insulin resistance than R3G. We speculated that this might be because the locations of the phenolic hydroxy group between R3G and R4G are different. R4G has a meta-hydroxy group on the same benzene ring, which maybe offer a better water-solubility effect. The water-soluble structure could enhance the cellular uptake and be better for medicine metabolism. Also, two hydroxy groups connected with the one benzene ring in R4G has the smaller stereospecific blockade than two hydroxy groups connected with the two benzene rings in R3G. The structure is much easier for R4G to combinate with target proteins. Previous studies have shown that RSV promoted insulin signaling in liver of insulin-resistant mice by weakening serine phosphorylation of IRS protein, and enhancing glucose utilization.45 The study by Choi et al. also confirmed that RSV and its synthesized derivative decreased lipid accumulation in H4IIEC3 cells and HFD-fed C57BL/6 mice, by increasing AMPK phosphorylation.46 However, there were no reports if RSV metabolites could modulate IRS/AMPK signal pathway, and our data was the first to show R3G and R4G could indeed enhance insulin sensitivity via modulating IRS/AMPK pathway. However, specific mechanism about if RSV metabolites directly regulate IRS-1/AMPK signaling pathway requires further investigation.
5 Conclusion
In summary, our study showed that RSV metabolites R3G and R4G protected HepG2 cells from insulin resistance by improving both cellular glucose uptake and glycogen synthesis content, along with inhibiting intracellular ROS generation. Their action on insulin signaling regulation and improved insulin sensitivity were mediated through IRS-1/AMPK signaling pathway. In addition, it was noticed that R4G was more effective to relieve insulin resistance than R3G. Thus, our data provided a significant new insight into the effects and molecular mechanism of R3G and R4G on ameliorating insulin resistance, and indicated that despite low bioavailability in vivo, the biological effects of RSV can also be mediated at least in part by its metabolites.Conflicts of interest
The authors declare that there is no conflict of interest.Abbreviations
| AMPK | AMP-activated protein kinase |
| CCK-8 | Cell Counting Kit-8 |
| DCFH-DA | 2,7-Dichlorodi-hydrofluorescein diacetate |
| HFD | High fat diet |
| IRS-1 | Insulin receptor substrate-1 |
| mTOR | Mammalian target of rapamycin |
| 2-NBDG | 2-[N-(7-Nitrobenz-2-oxa1,3-diazol-4-yl) amino]-2-deoxy-D-glucose |
| PBS | Phosphate-buffered saline |
| RSV | Resveratrol |
| R3G | Resveratrol-3-O-glucuronide |
| R4G | Resveratrol-4-O-glucuronide |
| ROS | Reactive oxygen species |
| T2DM | Type 2 diabetes mellitus |
Acknowledgements
The research in the authors' laboratory was supported in part by a grant from the Major International (Regional) Joint Research Program of the Natural Science Foundation of China (No. 31320103920), and the 111 Project from the Education Ministry of China (No. B18053), and supported by “the Fundamental Research Funds for the Central Universities”.References
- L. Chen, D. J. Magliano and P. Z. Zimmet, Nat. Rev. Endocrinol., 2011, 8, 228–236 CrossRef PubMed
.
- World Health Organization, Global Report on Diabetes, World Health Organization, 2016 Search PubMed
- S. Wild, G. Roglic, A. Green, R. Sicree and H. King, Diabetes Care, 2004, 27, 1047–1053 CrossRef PubMed
- M. Ding, S. N. Bhupathiraju, M. Chen, R. M. van Dam and F. B. Hu, Diabetes Care, 2014, 37, 569–586 CrossRef PubMed
- S. E. Kahn, M. E. Cooper and S. Del Prato, Lancet, 2014, 383, 1068–1083 CrossRef CAS
- L. K. J. Stadler and I. S. Farooqi, Cell, 2017, 170, 12 CrossRef CAS PubMed
- B. M. Herrera, H. E. Lockstone, J. M. Taylor, Q. F. Wills, P. J. Kaisaki, A. Barrett, C. Camps, C. Fernandez, J. Ragoussis, D. Gauguier, M. I. McCarthy and C. M. Lindgren, BMC Med. Genomics, 2009, 2, 54 CrossRef PubMed
- J. Cao, X. Li, Y. Liu, F. Leng, X. Li, C. Sun and K. Chen, J. Food Sci., 2015, 80, C234–240 CrossRef CAS PubMed
- I. Magnusson, D. L. Rothman, L. D. Katz, R. G. Shulman and G. I. Shulman, J. Clin. Invest., 1992, 90, 1323–1327 CrossRef CAS PubMed
- M. C. Petersen and G. I. Shulman, Trends Pharmacol. Sci., 2017, 38, 649–665 CrossRef CAS PubMed
- A. J. Garber, T. G. Duncan, A. M. Goodman, D. J. Mills and J. L. Rohlf, Am. J. Med., 1997, 103, 491–497 CrossRef CAS PubMed
- A. S. Axelsson, E. Tubbs, B. Mecham, S. Chacko, H. A. Nenonen, Y. Tang, J. W. Fahey, D. Jmj, C. B. Wollheim and N. Wierup, Sci. Transl. Med., 2017, 9, 394 Search PubMed
- T. Szkudelski and K. Szkudelska, Biochim. Biophys. Acta, 2015, 1852, 1145–1154 CrossRef CAS PubMed
- J. A. Baur and D. A. Sinclair, Nat. Rev. Drug Discovery, 2006, 5, 493–506 CrossRef CAS PubMed
- A. J. Gescher and W. P. Steward, Cancer Epidemiol., Biomarkers Prev., 2003, 12, 953–957 CAS
- D. Delmas and H. Y. Lin, Mol. Nutr. Food Res., 2011, 55, 1142–1153 CrossRef CAS PubMed
- T. Walle, F. Hsieh, M. H. DeLegge, J. E. Oatis Jr and U. K. Walle, Drug Metab. Dispos., 2004, 32, 1377–1382 CrossRef CAS PubMed
- D. M. Goldberg, J. Yan and G. J. Soleas, Clin. Biochem., 2003, 36, 79–87 CrossRef CAS PubMed
- M. Yoshizumi, K. Tsuchiya, Y. Suzaki, K. Kirima, M. Kyaw, J. H. Moon, J. Terao and T. Tamaki, Biochem. Biophys. Res. Commun., 2002, 293, 1458–1465 CrossRef CAS PubMed
- C. Morand, V. Crespy, C. Manach, C. Besson, C. Demigné and C. Rémésy, Am. J. Physiol., 1998, 275, R212 CAS
- M. S. Claudine Manach, P. D. Françoise Regerat, P. D. Odile Texier, M. S. Georgine Agullo, D. S. Christian Demigne and D. S. Christian Remesy, Nutr. Res., 1996, 16, 517–544 CrossRef
- C. Yu, Y. G. Shin, J. W. Kosmeder, J. M. Pezzuto and R. B. van Breemen, Rapid Commun. Mass Spectrom., 2003, 17, 307–313 CrossRef CAS PubMed
- Q. Huang, L. Chen, H. Teng, H. Song, X. Wu and M. Xu, J. Funct. Foods, 2015, 19, 487–494 CrossRef CAS
- J. j. Song, Q. Wang, M. Du, T. g. Li, B. Chen and X. y. Mao, Mol. Nutr. Food Res., 2016, 61, 2 Search PubMed
- V. Aires, E. Limagne, A. K. Cotte, N. Latruffe, F. Ghiringhelli and D. Delmas, Mol. Nutr. Food Res., 2013, 57, 1170–1181 CrossRef CAS PubMed
- I. Eseberri, A. Lasa, J. Miranda, A. Gracia and M. P. Portillo, PLoS One, 2017, 12, e0184875 CrossRef PubMed
- C. L. Lin and J. K. Lin, Mol. Nutr. Food Res., 2008, 52, 930–939 CrossRef CAS PubMed
- E. F. Brandon, T. M. Bosch, M. J. Deenen, R. Levink, E. van der Wal, J. B. van Meerveld, M. Bijl, J. H. Beijnen, J. H. Schellens and I. Meijerman, Toxicol. Appl. Pharmacol., 2006, 211, 1–10 CrossRef CAS PubMed
- C. L. Lin, H. C. Huang and J. K. Lin, J. Lipid Res., 2007, 48, 2334–2343 CrossRef CAS PubMed
- P. J. Bartlett, L. D. Gaspers, N. Pierobon and A. P. Thomas, Cell Calcium, 2014, 55, 306–316 CrossRef CAS PubMed
- J. D. Mcgarry, Science, 1992, 258, 766–770 CrossRef CAS PubMed
- S. Chen, Z. Zhao, L. Ke, Z. Li, W. Li, Z. Zhang, Y. Zhou, X. Feng and W. Zhu, J. Nutr. Biochem., 2018, 55, 209–218 CrossRef CAS PubMed
- J. Y. Yao, C. K. Liu, K. H. Chen and J. K. Chen, J. Funct. Foods, 2015, 18, 737–745 CrossRef CAS
- K. H. Fisher-Wellman and P. D. Neufer, Trends Endocrinol. Metab., 2012, 23, 142–153 CrossRef CAS PubMed
- E. J. Anderson, M. E. Lustig, K. E. Boyle, T. L. Woodlief, D. A. Kane, C. T. Lin, J. W. Price 3rd, L. Kang, P. S. Rabinovitch, H. H. Szeto, J. A. Houmard, R. N. Cortright, D. H. Wasserman and P. D. Neufer, J. Clin. Invest., 2009, 119, 573–581 CrossRef CAS PubMed
- D. S. Lark, K. H. Fisher-Wellman and P. D. Neufer, Int. J. Obes. Suppl., 2012, 2, S31–S36 CrossRef CAS PubMed
- M. Lepretti, S. Martucciello, M. A. Burgos Aceves, R. Putti and L. Lionetti, Nutrients, 2018, 10 CrossRef PubMed
- P. M. Dang, A. Stensballe, T. Boussetta, H. Raad, C. Dewas, Y. Kroviarski, G. Hayem, O. N. Jensen, M. A. Gougerot-Pocidalo and J. El-Benna, J. Clin. Invest., 2006, 116, 2033–2043 CrossRef CAS PubMed
- T. Zheng, X. Yang, D. Wu, S. Xing, F. Bian, W. Li, J. Chi, X. Bai, G. Wu, X. Chen, Y. Zhang and S. Jin, Br. J. Pharmacol., 2015, 172, 3284–3301 CrossRef CAS PubMed
- M. P. Sajan, R. A. Ivey 3rd and R. V. Farese, Metabolism, 2015, 64, 1454–1465 CrossRef CAS PubMed
- Y. Zhang, J. Hai, M. Cao, Y. Zhang, S. Pei, J. Wang and Q. Zhang, Int. Immunopharmacol., 2013, 17, 714–720 CrossRef CAS PubMed
- K. D. Copps and M. F. White, Diabetologia, 2012, 55, 2565–2582 CrossRef CAS PubMed
- B. R. Sharma, H. J. Kim and D. Y. Rhyu, J. Transl. Med., 2015, 13, 62 CrossRef PubMed
- K. A. Coughlan, R. J. Valentine, N. B. Ruderman and A. K. Saha, Diabetes, Metab. Syndr. Obes.: Targets Ther., 2014, 7, 241–253 Search PubMed
- M. B. Pektas, G. Yücel, H. B. Koca, G. Sadi, O. G. Yıldırım, G. Öztürk and F. Akar, Drug Res., 2017, 11, 103–110 Search PubMed
- Y. J. Choi, H. R. Suh, Y. Yoon, K. J. Lee, D. G. Kim, S. Kim and B. H. Lee, Arch. Pharmacal Res., 2014, 37, 1169–1176 CrossRef CAS PubMed
- S. H. Kim, J. T. Hwang, H. S. Park, D. Y. Kwon and M. S. Kim, Biochem. Biophys. Res. Commun., 2013, 439, 66–70 CrossRef CAS PubMed
- M. Zakłosszyda and N. Pawlik, Acta Biochim. Pol., 2018, 67–78 CrossRef PubMed
Footnote |
| † Electronic supplementary information (ESI) available. See DOI: 10.1039/c8ra05092a |
| This journal is © The Royal Society of Chemistry 2018 |