DOI:
10.1039/C8RA05034A
(Paper)
RSC Adv., 2018,
8, 27775-27785
Carbon supported olivine type phosphate framework: a promising electrocatalyst for sensitive detection of dopamine†
Received
12th June 2018
, Accepted 13th July 2018
First published on 3rd August 2018
Abstract
In this study, a layered olivine-type LiMnPO4/functionalized-multiwall carbon nanotube (f-MWCNTs) composite is used as an electrochemically active material for the real-time detection of dopamine. A wet-chemical ultrasonication process is used to combine LiMnPO4 with f-MWCNTs at room temperature. The composite was subjected to various structural, morphological and electrochemical studies. The blending of olivine-type LiMnPO4 into the f-MWCNTs is revealed by TEM analysis. The electrochemical activities of the LiMnPO4/f-MWCNTs composite are systematically investigated using cyclic voltammetry (CV) and differential pulse voltammetry (DPV) for the real-time detection of dopamine. Furthermore, the applicability of the as prepared LiMnPO4/f-MWCNTs composite was extended for the detection of human serum (E48) and rat brain-serum (C7) samples with satisfactory recoveries for the real-time applications. All these studies revealed that the layered olivine-type LiMnPO4/f-MWCNTs composite is a potential candidate in the field of electrochemical sensing.
1. Introduction
Human brain function is systematically regulated by neurotransmitters, which are endogenous molecules made by neurons used for the communication and transmission of signals between neurons and the central nervous system. According to Otto Loewi study, based on the chemical and molecular characteristics, the neurotransmitters have been categorized into different classes, such as biogenic amine, amino acids, peptides and gaseous transmitters.1 Among them, dopamine (DA; IUPAC: 4-(2-aminoethyl) benzene-1,2-diol) plays an essential role in several vital body functions, such as circadian rhythm, memory management, mood regulation, motor functions, and prolactin secretion. The 3D-chemical structure of DA is depicted in the ESI (Fig. S4†). Typically, the low-level secretion of DA cause Alzheimer's, schizophrenia, Huntington's diseases and HIV infections.2 On the other hand, the high-level secretion of DA leads to loneliness as well as abnormal activity or mental disorder in a central nervous system.3
Therefore, accurate and real-time detection of DA is highly crucial in clinical diagnostics.4 There are several types of analytical techniques available for the detection of DA including high-performance liquid chromatography (HPLC),5 spectrometry,6 calorimetry, and electrophoresis.7 However, the above-mentioned techniques have some limitations, particularly high-cost, being time-consuming and the usage of environmentally hazardous solvents. The electrochemical sensing technique is considered as the potential alternative for the real-time detection of DA because it is facile, cost-effective, easy to operate, eco-friendly, rapidly responsive, highly sensitive, and selective. In the electrochemical sensing technique, the detection of DA is limited by the interfering biomolecules having the similar oxidation potential such as ascorbic acid (AC), uric acid (UA) and glucose, which results in superimpose responses making their differences difficult.8,9 To overcome this problem, modified electrodes are designed for the selective and sensitive detection of DA. Intriguingly, the oxidation peak potential of DA appeared to be more positive over carbon-based modified electrodes. Nevertheless, the low catalytic behavior limits the electrochemical performance of the carbon-based electrodes as an active sensor for the real-time detection of DA. In order to enhance the electrochemical properties of the carbon-based electrodes, it has been suggested to form the composite with highly electrocatalytic materials. Mainly, the formation of a composite with CNTs using high active electrochemical material is believed to be more effective for the sensor applications. Also, the formation of nano-composite is sufficient to reduce the fouling effect that is commonly occurred in pristine MWCNTs.
Phospho-olivines with general formula LiMPO4 (M = Fe, Mn, Co, or Ni) is emerging as the potential electrode materials for electrochemical energy storage devices, electrocatalysts and water splitting applications.10 Recently, the enhanced electrocatalytic activity was demonstrated using multi-component olivine-type transition metal (M = Co, Ni) phosphates for glucose oxidation.11 These olivine-type phosphates are eco-friendly and economically viable.12–14 As mentioned earlier, f-MWCNTs are well-known sensor material because of their large electrode surface area and conductivity. However, their low catalytic behavior limits the performance as a practical sensor. By combining olivine-type phosphate and f-MWCNTs is believed to be useful to improve the electrochemical performance of the sensing applications.
In this study, electrochemically active olivine-type LiMnPO4 combined with f-MWCNTs to investigate the electrochemical properties for the real-time detection of dopamine (DA). The microstructural properties and morphology of the as-prepared nanocomposite were examined. Besides, the LiMnPO4/f-MWCNTs was used to determine the real samples, such as human serum (E48) and rat brain-serum samples (C7) with functional recovery. All these studies revealed that the LiMnPO4/f-MWCNTs composite is efficient for real-time electrochemical sensing application. Furthermore, superior electrochemical performances prove that the olivine-type LiMnPO4/f-MWCNTs frameworks an efficient and promising sensing material for real-time detection of dopamine with high selectivity.
2. Experimental
2.1. Materials
All chemicals, such as Li3PO4 (Chempur 99.99%), MnCO3 (Aldrich 99.99%), NH4H2PO4 (Chempur 99.99%), MnCl2 (99.999% Aldrich) and pure-MWCNTs were used as received without any further purification. The supporting electrolyte solution, 0.05 M phosphate buffer (PB) was prepared by using sodium phosphate (dibasic and monobasic, anhydrous; Sigma-Aldrich). The pH of PB solution was adjusted to neutral (pH-7) by using NaOH/H2SO4. The de-ionized (DI) water was used to prepare all electrolyte solutions for electrocatalytic studies. The samples such as Human serum (E48), and rat brain serum (C7) were acquired from Chang Gung University, Taiwan. The experimental protocols were carried out on approval of the Institutional Animal Ethics Committee.
2.2. Functionalization of MWCNTs
Prior to composite formation, the MWCNTs are subjected to surface functionalization. Typically, surface functionalized multi-walled carbon nanotube (f-MWCNTs) possess large surface area for the more active reaction center. Therefore, hydrophilic functional groups, such as –COOH and –OH were functionalized on the surface of the MWCNTs according to the previously reported procedure.15 Briefly, the pristine–MWCNTs (0.5 g) were dispersed into 50 mL (1![[thin space (1/6-em)]](https://www.rsc.org/images/entities/char_2009.gif) :
:![[thin space (1/6-em)]](https://www.rsc.org/images/entities/char_2009.gif) 1 v/v) ratio of HNO3 (67%) and H2SO4 (97%) and kept at 60 °C for 30 min under constant magnetic stirring. Then, the solution was subjected to ultrasonication for 6 h and finally cooled down to room temperature. The f-MWCNTs residue is washed with DI water to remove acids by centrifugation. The washing and centrifugation process repeated several times until the supernatant liquid to reach the pH value 7, indicating that the acids have been completely removed from the solution. The residual black-powder of f-MWCNTs is dried at room temperature. The well-dried f-MWCNTs is used to combine with olivine LiMnPO4 by sonochemical synthesis method.
1 v/v) ratio of HNO3 (67%) and H2SO4 (97%) and kept at 60 °C for 30 min under constant magnetic stirring. Then, the solution was subjected to ultrasonication for 6 h and finally cooled down to room temperature. The f-MWCNTs residue is washed with DI water to remove acids by centrifugation. The washing and centrifugation process repeated several times until the supernatant liquid to reach the pH value 7, indicating that the acids have been completely removed from the solution. The residual black-powder of f-MWCNTs is dried at room temperature. The well-dried f-MWCNTs is used to combine with olivine LiMnPO4 by sonochemical synthesis method.
2.3. Synthesis of LiMnPO4/f-MWCNTs composite
Fine powder of LiMnPO4 obtained by grinding the high-quality crystals was used for the preparation of LiMnPO4/f-MWCNTs composites. Initially, f-MWCNTs (5 mg mL−1) was dispersed into 100 mL of DI water and then ultrasonicated for 45 min. The fine powder of LiMnPO4 (10 mg) was added to the suspension of f-MWCNTs solutions. The resulting mixture was ultrasonicated for an hour afterward; the suspension was settled down at the bottom like a black residue. Finally, the water was decanted entirely from the residue. The resulting LiMnPO4/f-MWCNTs composite was dried at room temperature. The well-dried LiMnPO4/f-MWCNTs composite was used for the electrochemical analysis. The schematic illustration with real time sensing application of LiMnPO4/f-MWCNTs composite is shown in (Scheme 1).
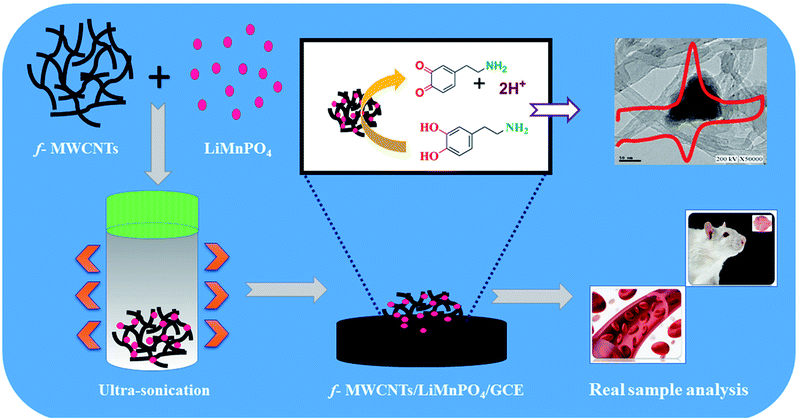 |
| | Scheme 1 Schematic illustration of GCE/LiMnPO4/f-MWCNTs composite and its real-time applications of DA. | |
2.4. Characterization
The formation of LiMnPO4/f-MWCNTs composite is confirmed by X-ray diffraction (XRD) and TEM analysis. Blending of the LiMnPO4 into f-MWCNTs is examined by transmission electron microscopy (TEM – TECNAI G2). XPS measurements were carried out with a Kratos Axis Ultra spectrometer, using a focused monochromatized AlKα X-ray source (1486.6 eV). Electrochemical studies were performed using the conventional three-electrode system, such as glassy carbon electrode (GCE) as a working electrode (surface area: 0.071 cm2), Ag/AgCl as a reference electrode and Pt mesh as a counter electrode. The detection of DA was accomplished by using two different techniques, such as cyclic voltammetry (CV) and differential pulse voltammetry (DPV) from CHI 1205C and CHI 900 (CH Instruments, Electrochemical Analyzer, USA), respectively.
2.5. Fabrication of modified electrode (LiMnPO4/f-MWCNTs)
Before modification, the GCE was well polished (mirror-like) with 0.05 μM alumina slurry and followed by the removal of alumina particles on the surface with DI water. The well-polished GCE was sonicated for few seconds with water and ethanol (1![[thin space (1/6-em)]](https://www.rsc.org/images/entities/char_2009.gif) :
:![[thin space (1/6-em)]](https://www.rsc.org/images/entities/char_2009.gif) 1 ratio). The prepared LiMnPO4/f-MWCNTs composite was re-dispersed in DI water and was sonicated for 15 min to obtain the suspension of LiMnPO4/f-MWCNTs composite. About 6 μL of obtained suspension was drop-casted on the surface of well-polished GCE. The drop-casted GCE was allowed to dry at room temperature. The modified electrode was further used for electrochemical investigation. The redox reaction involved in the DA is given the following equation (Scheme 2).
1 ratio). The prepared LiMnPO4/f-MWCNTs composite was re-dispersed in DI water and was sonicated for 15 min to obtain the suspension of LiMnPO4/f-MWCNTs composite. About 6 μL of obtained suspension was drop-casted on the surface of well-polished GCE. The drop-casted GCE was allowed to dry at room temperature. The modified electrode was further used for electrochemical investigation. The redox reaction involved in the DA is given the following equation (Scheme 2).
 |
| | Scheme 2 A schematic illustration of electrochemical oxidation mechanism of DA by using LiMnPO4/f-MWCNT composite. | |
3. Results and discussion
3.1. Structure and morphology analysis
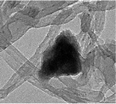
The structure and purity of the olivine type LiMnPO4, before the composite formation with f-MWCNTs, was confirmed by powder X-ray diffraction (XRD) study. The XRD pattern of LiMnPO4 is shown in Fig. 1(b). The observed XRD pattern is well correlated to the orthorhombic crystal structure with Pnma space group. The estimated lattice parameters from the observed XRD pattern, such as a = 10.4561(4) Å, b = 6.1081(2) Å, c = 4.7478(2) Å and α = β = γ = 90° are in good agreement with the earlier report.16 There are no additional diffraction peaks related to the secondary or impurity phases in the XRD pattern, which specifies the high purity of the LiMnPO4 sample. The formation of LiMnPO4/f-MWCNTs composite and its morphology is examined by the TEM analysis. The single-crystalline nature of the LiMnPO4 nanoparticle is evinced from the SAED pattern in the inset of Fig. 2(a). The bundles of interlinked f-MWCNTs with the inset of amorphous SAED are clearly shown in Fig. 2(b). From Fig. 2(c), it is evident that the LiMnPO4 crystallites elegantly intercalated by the tangle of f-MWCNTs. In order to confirm the intercalation of LiMnPO4, the composite is characterized by high-resolution TEM (HRTEM) analysis. From shows the HRTEM image (Fig. 2(d)), the intercalated single crystalline LiMnPO4 diffraction pattern clearly observed. The lattice spacing of 1.03 and 0.47 nm can be assigned to {100} and {001} crystal planes of olivine-type LiMnPO4 respectively. From the HRTEM image (Fig. 2(d)), the blended single crystalline LiMnPO4 diffraction pattern visibly observed. The lattice spacing of 1.03 and 0.47 nm can be assigned to {100} and {001} crystal planes of layered olivine-type LiMnPO4, respectively.
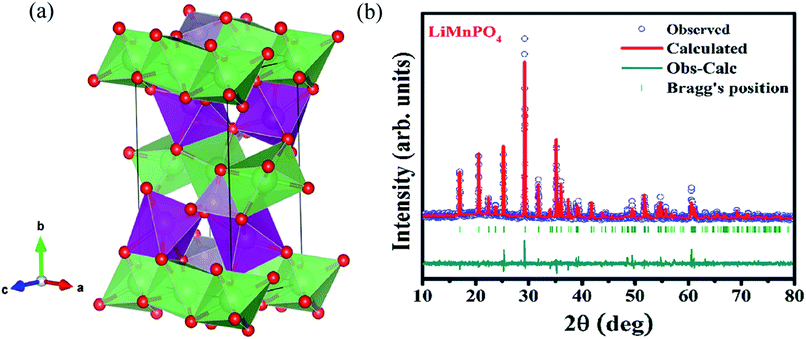 |
| | Fig. 1 (a) Three-dimensional crystal structure view of LiMnPO4 (b) X-ray powder diffraction patterns of LiMnPO4 recorded at room temperature along with Rietveld analysis. | |
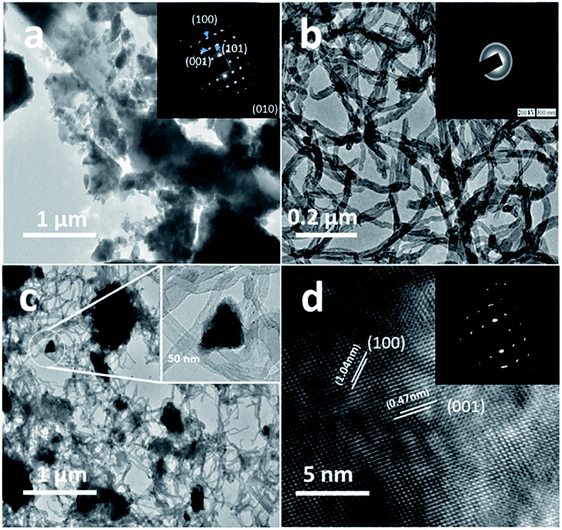 |
| | Fig. 2 Structural and phase purity characterization of the LiMnPO4 nanoparticles. (a) Representative TEM image of the as-synthesized LiMnPO4 particles; (b) f-MWCNTs (inset; SAED pattern of f-MWCNTs) (c) LiMnPO4/f-MWCNTs composite (inset: higher magnification image) and (d) HRTEM image and associated ED pattern of the LiMnPO4/f-MWCNTs composite. | |
3.2. Electrochemical properties
The electrochemical activity of LiMnPO4/f-MWCNTs composite was studied by two different techniques, such as cyclic voltammetry (CV) and differential pulse voltammetry (DPV) for the detection of dopamine.
3.2.1. Electrochemical determination of DA by CV. The cyclic voltammetry is one of the promising techniques to detect the DA concentrations with modified electrodes. The CV responses of bare GCE, GCE/LiMnPO4, GCE/f-MWCNTs, GCE/LiMnPO4/f-MWCNTs in 0.05 M PB solution (pH 7) with 200 μM of DA at the scan rate of 50 mV s−1 are shown in Fig. 3(a). The redox reaction dopamine to dopamine-o-quinone (DA–DAQ, anodic peak) and dopamine-o-quinone to dopamine (DAQ–DA, cathodic peak) is presented in Scheme 2. The GCE modified with LiMnPO4/f-MWCNTs composite exhibits better response as compared to the bare GCE and GCE/LiMnPO4, GCE/f-MWCNTs for the detection of DA. From CV, well-defined redox peaks appeared at 0.2160 V (Epa) and 0.1845 V (Epc) for the GCE/LiMnPO4/f-MWCNTs. From Fig. 3(a), the peak-to-peak potential difference (ΔEp) is lower for the GCE/LiMnPO4/f-MWCNTs as compared to other modified electrodes, which is attributed by the kinetics and electron transfer behavior of LiMnPO4/f-MWCNTs composite. Furthermore, it is important to study the electrochemical activity at different pH value for the real-time detection of DA. Therefore, the LiMnPO4/f-MWCNTs modified electrode CV responses were carried out at different acidic and alkaline mediums in the range of pH from 3 to 11 at the same concentration of DA, which is shown Fig. 3(b). The DA sensing is observed with higher oxidation peak current at pH-7, this is because of the electroactive species that are highly active in the neutral medium. The electrons and protons participate in the redox behavior of biomolecules (DA). The redox peak current and potential are pH dependent,17 hence the oxidation peak shift toward the negative potential. As shown in Fig. 4(b), the LiMnPO4/f-MWCNTs composite generated the highest sensing activity at pH-7 and sensing activity gradually decreased when the pH was increased to neutral and alkaline values. Moreover, the pH dependence current shift of the LiMnPO4/f-MWCNTs composites at gives robust electrocatalytic activity towards the detection of dopamine (DA). For the comparison of oxidation peak current versus potential at different pH value is shown in Fig. 3(c). From Fig. 3(c), the oxidation peak current is much higher at pH-7, which indicates that the GCE/LiMnPO4/f-MWCNTs have shown good electrochemical activity at neutral PH value for the detection of DA. Furthermore, the peak potential (EPa and EPc) shifts towards positive and negative direction at the lower and higher pH value, respectively in the presence of 0.05 M containing PB solution. The Fig. 3(d) shows the corresponding calibration plot for pH vs. formal potential. The formal potential (E0′) of DA between the range of pH from 3 to 11 shows the proper linear range with a slope value of 50.3 mV pH−1. The obtained slope value is very near to the theoretical value (59.0 mV pH−1 ≈ 50.3 mV pH−1) that was reported for the redox reaction involving equal number of electrons (2e−) and protons (2H+).18 In overall consideration, the electrochemical behavior of DA purely depends on pH of the electrolyte solution. Furthermore, the electrochemical redox reaction of DA involves with an equal number of electrons (2e−) and protons (2H+). Typically, the peak current in biosensors is directly proportional to the concentration of the analyte. Fig. 4(a) and (b) shows the modified electrode GCE/LiMnPO4/f-MWCNTs accomplished by the effect of different concentration of DA in neutral 0.05 M PB solution at a scan rate 50 mV s−1.
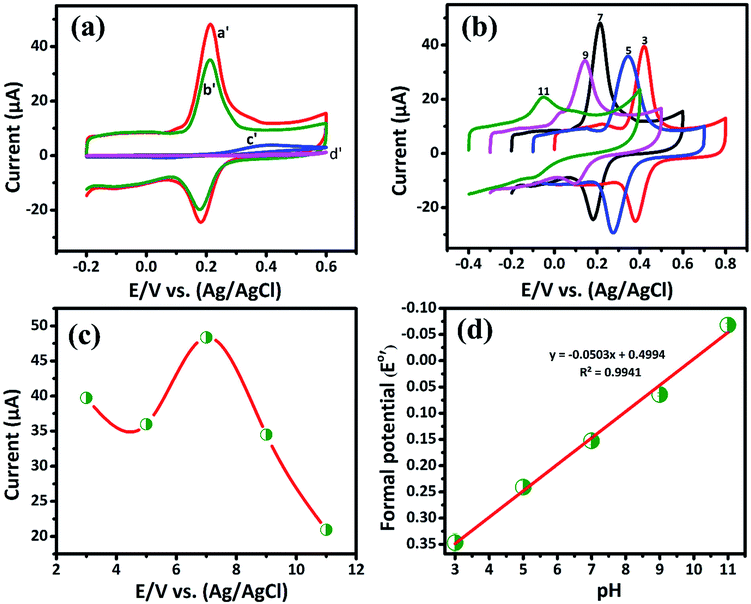 |
| | Fig. 3 (a) The CV curve response of 200 μM of DA on the GCE/LiMnPO4/f-MWCNTs (curve a′), GCE/f-MWCNT (curve b′), GCE/LiMnPO4 (curve c′) and bare GCE (curve d′) in 0.05 M PB solution (scan rate: 50 mV s−1), (b) CV response of DA at GCE/LiMnPO4/f-MWCNTs in different pH in the ranging from 3.0 to 11.0, (c) plot of peak current vs. different pH and (d) corresponding calibration plot for pH vs. formal potential (E0′). | |
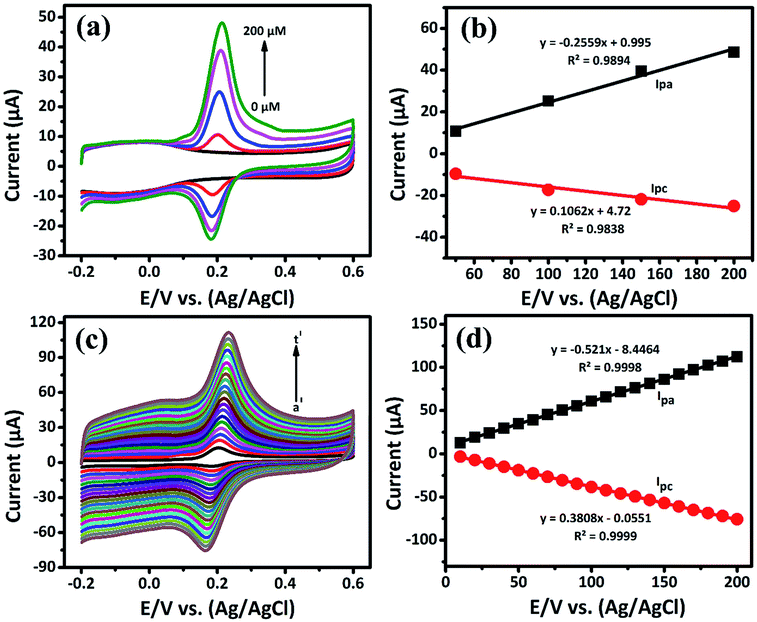 |
| | Fig. 4 (a) The CV response obtained at GCE/LiMnPO4/f-MWCNTs for different concentrations (0 to 200 μM) of DA in 0.05 M PB solution at scan rate of 50 mV s−1, (b) corresponding calibration plot for E/V vs. (Ag/AgCl) vs. peak current response, (c) the CV response of GCE/LiMnPO4/f-MWCNTs modified electrode in the presence 0.05 M PB solution containing 200 μM of DA at different scan rates (a′ = 10 to t′ = 200) and (d) corresponding calibration plot for scan rate (mV s−1) vs. peak current response. | |
The oxidation and reduction peak current at different concentration of DA was estimated using linear regression eqn (1) and (2), respectively. From Fig. 4(a), it is shown that the redox peak current increases linearly with an increase of the DA concentration from 0 to 200 μM. Typically, the peak current in biosensors is directly proportional to the concentration of the analyte.19 Fig. 4(a) and (b) shows the modified electrode GCE/LiMnPO4/f-MWCNTs accomplished by the effect of different concentration of DA was estimated using linear regression eqn (1) and (2), respectively. From Fig. 4(a), it is shown that the redox peak current is found to increases linearly with an increase of the DA concentration from 0 to 200 μM.
| |
 | (1) |
| |
 | (2) |
The electrochemical kinetic behavior of DA was evaluated by performing the CV at different scan rates. The measurement was carried out at 200 μM of DA in 0.05 M PB solution by varying the scan rate from 10 to 200 mV s−1 as in Fig. 4(c). From Fig. 4(c), the redox peak current is steadily increasing with the increase of scan rate from 10 to 200 mV s−1. The oxidation and reduction peak current at different scan rate was estimated using linear regression eqn (3) and (4), respectively. Thus, the obtained redox peak currents of DA are plotted against the various scan rates ranging from 10 to 200 mV s−1 as shown in Fig. 4(d), in which the linear increase of anodic and cathodic currents with an increase of scan rate has been observed.
| |
 | (3) |
| |
 | (4) |
The logarithmic plot of scan rate versus log(Ipa) is shown in the ESI (Fig. S6).† The linear dependent of Ipa with scan rate has been observed. From the ESI-Fig. S6,† the slope value estimated to be 1.0289 with the regression coefficient (R2) is equal to 0.9994. According to the kinetic theory of electrode reaction, the slope of log(Ipa) vs. log(scan rate) should be 0.5 V for pure diffusion controlled process and 1 V for the pure adsorption controlled process.20 Hence, the observed slope value of 1.0289 V indicates that the electron transfer reactions of DA on GCE/LiMnPO4/f-MWCNTs modified electrodes are an adsorption-controlled process.
3.2.2. Electrochemical sensitivity of DA by DPV. Differential pulse voltammetry (DPV) plays a vital role in the electrochemical study due to high sensitivity when compared to the other voltammetry techniques. In this study, DPV was further used to determine the sensitivity of DA in PB (0.05 M) solution at low concentration. Fig. 5(a) shows DPV response attained at a low-level concentration of DA that ranges from 0.1 μM to 49 μM in the presence of N2 saturated PB solution. From Fig. 5(a), the oxidation peak current was found to increase with increasing the DA concentration. Also, for the lowest concentration of DA, a well-defined anodic peak current at 0.1696 V caused due to the oxidation of DA to DAQ is observed. The Fig. 5(b) shows the oxidation peak current is plotted against the concentration of [DA/μM]. It exhibits the good range from 0.1 μM to 49 μM with the linear correlation coefficient of R2 = 0.9872. The lower detection limit (LOD) and sensitivity of DA are calculated from the slope value of linear calibration plot. The lowest detection limit is calculated to be 19 nM with a sensitivity of 37.18169 μA μM−1 cm−2. The low detection limit at the nano-molar level of biomolecules pronounces the better performances of the GCE/LiMnPO4/f-MWCNTs composite. Comparison of the GCE/LiMnPO4/f-MWCNTs sensor with other existed electrochemical DA sensors are given in Table 1.21–31
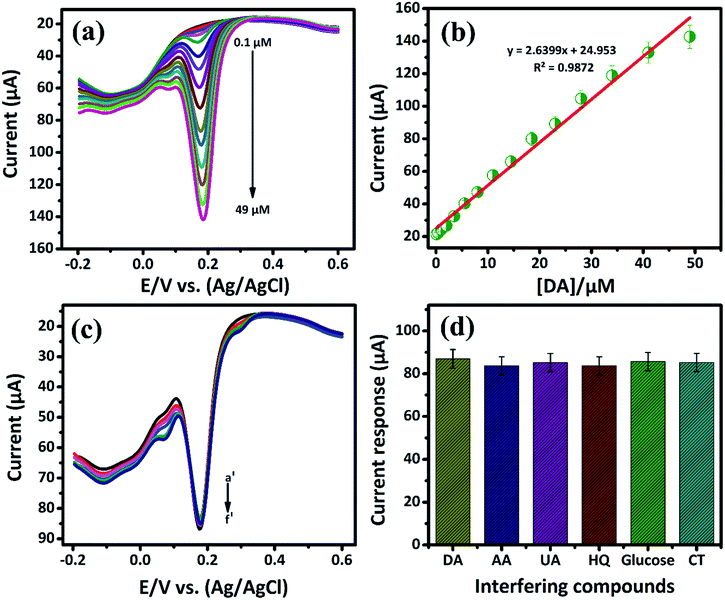 |
| | Fig. 5 (a) DPV response of GCE/LiMnPO4/f-MWCNTs modified electrode in the presence of 0.05 M PB solution containing different addition of DA, the DA oxidation ranging from (0.1 μM to 49 μM), (b) the corresponding calibration plot response for peak current response vs. concentration, (c) the DPV response at GCE/LiMnPO4/f-MWCNTs with successive addition of DA (a′) in the presence of 10 μM was investigated with 10-folds excess of interfering biological compounds such as (b′) ascorbic acid, (c′) uric acid, (d′) hydroquinone, (e′) glucose, (f′) catechol and (d) the corresponding response for the effect of 10-fold interfering biological compounds vs. DA current response. | |
Table 1 Comparison of GCE/LiMnPO4/f-MWCNTs sensor with other existed electrochemical DA sensors
| Electrode |
Morphology |
Method |
LOD (μM) |
Linear range (μM) |
Ref. |
| GEF/CFE |
 |
DPV |
0.5 |
0.7–45.21 |
21 |
| Pd-NC/rGO/GCE |
 |
Amperometry |
7.02 |
20–220 |
22 |
| Graphene/Pt/GCE |
 |
Amperometry |
0.05 |
0.03–8.13 |
23 |
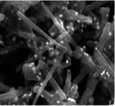
| Pt/MWCNT/GCE |
 |
DPV |
0.027 |
0.04–620 |
24 |
| MWCNT/GCE |
 |
DPV |
0.13 |
0.015–7.8 |
24 |
| Pt/rGO |
 |
DPV |
0.25 |
10–170 |
25 |
| Pt–CNT–GR/GCE |
 |
DPV |
0.01 |
0.1–30 |
26 |
| rGO/PAMAM/MWCNT/AuNP/GCE |
 |
DPV |
3.33 |
10–320 |
27 |
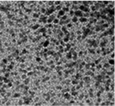
| Pd3Pt1/PDDA-rGO |
 |
DPV |
0.04 |
4–200 |
28 |
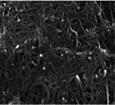
| MWCNT/CCE |
 |
DPV |
0.33 |
5–50 |
29 |
| CHI/VSG/PPy scaffold |
 |
DPV |
0.0194 |
0.1–200 |
30 |
| γ-WO3/GCE |
 |
DPV |
0.024 |
0.1–50, 50–600 |
31 |
| LiMnPO4/f-MWCNT/GCE |
 |
DPV |
0.019 |
0.1–49 |
Present study |
3.2.3. Selectivity and real sample analysis of DA sensor. The DA, AA and UA generally coexist in biological samples, since it plays vital roles in human body.32 Therefore, the selective determination of DA in the presence of some interfering biological compounds (such as, AA, UA) is quit important. The electrochemical detection of these compound has more concern. Commonly, the basal DA concentration is very low, while the concentration of AA is normally higher (0.1 mM). Herein, we demonstrate the selective detection of DA by LiMnPO4/f-MWCNTs composite. Fig. 5(c) shows the DPV response of DA (a′) (10 μM) is investigated in the presence of 10-fold excess of interfering biomolecules, such as ascorbic acid (b′), uric acid (c′), hydroquinone (d′), glucose (e′), and catechol (f′), respectively. It can be seen that the interfering compounds merged over the DA curve. It clearly reveals that there is no electrocatalytic response observed for interfering biological compounds. Since, it may due to the negatively charged nature of AA {pKa = 4.10} at pH 7,respectively. According to crystal field theory, the strong ligands donate their charges to metal ions and therefore will acquire a negative charge.33 Herein, the DA is positively charged {pKa = 8.87} at pH (7.2 to 7.4). Therefore, the negative charge of the metal ions easy to attract the positively charged nature of DA. Moreover, the DA was adsorbed on the surface of LiMnPO4/f-MWCNTs composite, which implies that the continues oxidation of DA was controlled adsorption process. Fig. 5(d) shows the DPV current response of DA oxidation with various coexisting interfering compounds, wherein the proposed sensor (LiMnPO4/f-MWCNTs composite) would be selectively oxidized DA in the presence of other interfering compounds. Hence, GCE/LiMnPO4/f-MWCNTs is more suitable for the real-time detection of DA with better selectivity.The applicability of LiMnPO4/f-MWCNTs composite was investigated ethically by performing conventional real sample experimentation. The real samples such as human serum (E48) and rat brain serum (C7) were acquired from Chang Gung University, Taiwan. The bio-samples (E48) and (C7) were diluted with 0.05 M PB solution (pH-7) and then directly used for determination of at different concentrations (0.01 M [DA/μM]) as shown in Fig. 6(a) and (c). The Fig. 6(b) and (d) shows the linear plot against the oxidation peak current and DA concentration [DA/μM]. From Fig. 6(b) and (d) the calculated linear correlation coefficient were R2 = 0.9979 and R2 = 0.9843, respectively. The bio-samples (E07) and (N2) were diluted with 0.05 M PB solution (pH-7) and directly used for the determination of 0.001 M [DA/μM] at a different concentration as shown in Fig. S8 and S9,† respectively. From these study, the DA sensor shows good recovery from bio-samples (E48) and (C7) with respect to the GCE/LiMnPO4/f-MWCNTs. The bio-samples (E48 and C7) obtain a good recovery ranging from 96.1 to 121.3 and 116.3 to 141.3, respectively given in (Table 2). Hence, the fabricated sensor can be used for the precise detection of DA in the real samples. This result endorses that the GCE/LiMnPO4/f-MWCNTs composite sensor can be a good recovery for the determination of DA and it can be applied to the pharmaceutical industry.
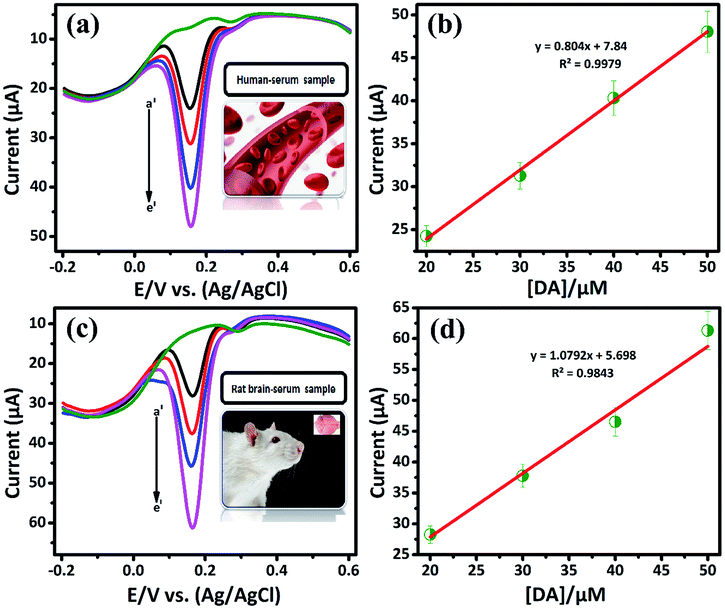 |
| | Fig. 6 DPV response of GCE/LiMnPO4/f-MWCNTs modified electrode in the presence of 0.05 M PB solution containing real samples at different concentration of DA: (a) human serum sample at different concentration of DA (a′) 20, (b′) 30, (c′) 40, (d′) 50, (b) corresponding calibration plot for peak current response vs. concentration [DA]/μM, (c) rat brain-serum sample at different concentration of DA (a′) 20, (b′) 30, (c′) 40, (e′) 50 and (d) corresponding calibration plot for peak current response vs. concentration [DA]/μM. | |
Table 2 Determination of DA in a human serum sample (E48) and rat brain-serum sample (C7) by using LiMnPO4/f-MWCNTs modified GC electrode
| Sample |
Concentration (μM) |
Spiked (μM) |
Found (μM) |
Recovery (%) |
| Human serum |
0.01 |
20 |
24.26 |
121.3 |
| 0.01 |
30 |
31.29 |
104.3 |
| 0.01 |
40 |
40.32 |
100.8 |
| 0.01 |
50 |
48.05 |
96.1 |
| Rat brain |
0.01 |
20 |
28.26 |
141.3 |
| 0.01 |
30 |
37.78 |
125.9 |
| 0.01 |
40 |
46.52 |
116.3 |
| 0.01 |
50 |
61.32 |
122.64 |
4. Conclusions
In summary, the layered olivine-type LiMnPO4/f-MWCNTs composite is prepared by the wet sonochemical method to investigate the electrochemical properties for the real-time detection of dopamine. The LiMnPO4 nanoparticles are found to be well blended between the wrinkles of the MWCNTs, which is clearly evidenced by TEM analysis. Moreover, the retaining of single crystallinity of the LiMnPO4 nanoparticles in the LiMnPO4/f-MWCNTs composite is confirmed by the SAED pattern and HRTEM study. The LiMnPO4/f-MWCNTs composite exhibits enhanced electrochemical performance towards the oxidation of DA in the pure chemical form, as well as that is obtained from various real samples, such as human serum and rat brain-serum samples, respectively. The electrochemical behavior of the GCE/LiMnPO4/f-MWCNTs composite via cyclic voltammetry (CV) and differential pulse voltammetry (DPV) revealed good sensitivity and selectivity towards the real-time detection of dopamine. The validation of applicability of the LiMnPO4/f-MWCNTs composite with real samples human serum sample and rat brain-serum sample with satisfactory recoveries open up the broad scope in the further development of the novel electrochemical sensor for the detection of complex biological systems.
Conflicts of interest
There are no conflicts to declare.
Acknowledgements
The authors are grateful for the financial support (MOST 106-2113-M-027-003) from the Ministry of Science and Technology (MOST), Taiwan.
Notes and references
- T. Pradhan, H. S. Jung, J. H. Jang, T. W. Kim, C. Kang and J. S. Kim, Chem. Soc. Rev., 2014, 43, 4684–4713 RSC.
- S. Sakthinathan, S.-M. Chen and W. C. Liao, Inorg. Chem. Front., 2017, 4, 809–819 RSC.
- C. Rajkumar, B. Thirumalraj, S.-M. Chen and H.-A. Chen, J. Colloid Interface Sci., 2017, 487, 149–155 CrossRef PubMed.
- F. Stocchi, L. Vacca and F. G. Radicati, Transl. Neurodegener., 2015, 4, 4 CrossRef PubMed.
- T. Takeuchi, N. Murase, H. Maki, T. Mukawa and H. Shinmori, Org. Biomol. Chem., 2006, 4, 565–568 RSC.
- V. M. Bhawtankar, Understanding the Dynamic Process of Dissolution Using In-situ FTIR Spectroscopy, Seton Hall University, 2017 Search PubMed.
- E. Dabek-Zlotorzynska, Electrophoresis, 1997, 18, 2453–2464 CrossRef PubMed.
- F. S. Belaidi, A. Civélas, V. Castagnola, A. Tsopela, L. Mazenq, P. Gros, J. Launay and P. Temple-Boyer, Sens. Actuators, B, 2015, 214, 1–9 CrossRef.
- K. Ghanbari and N. Hajheidari, Anal. Biochem., 2015, 473, 53–62 CrossRef PubMed.
- H. Kim, J. Park, I. Park, K. Jin, S. E. Jerng, S. H. Kim, K. T. Nam and K. Kang, Nat. Commun., 2015, 6, 8253 CrossRef PubMed.
- Y. Shu, B. Li, J. Chen, Q. Xu, H. Pang and X. Hu, ACS Appl. Mater. Interfaces, 2018, 10, 2360–2367 CrossRef PubMed.
- G. Wang, H. Liu, J. Liu, S. Qiao, G. M. Lu, P. Munroe and H. Ahn, Adv. Mater., 2010, 22, 4944–4948 CrossRef PubMed.
- S. M. Oh, S. W. Oh, C. S. Yoon, B. Scrosati, K. Amine and Y. K. Sun, Adv. Funct. Mater., 2010, 20, 3260–3265 CrossRef.
- X. L. Wu, L. Y. Jiang, F. F. Cao, Y. G. Guo and L. J. Wan, Adv. Mater., 2009, 21, 2710–2714 CrossRef.
- G. Rosace, V. Trovato, C. Colleoni, M. Caldara, V. Re, M. Brucale, E. Piperopoulos, E. Mastronardo, C. Milone and G. De Luca, Sens. Actuators, B, 2017, 252, 428–439 CrossRef.
- S. t. Geller and J. Durand, Acta Crystallogr., 1960, 13, 325–331 CrossRef.
- C. Sumathi, C. V. Raju, P. Muthukumaran, J. Wilson and G. Ravi, J. Mater. Chem. B, 2016, 4, 2561–2569 RSC.
- K. Aoki, K. Tokuda and H. Matsuda, J. Electroanal. Chem. Interfacial Electrochem., 1987, 235, 87–96 CrossRef.
- J. Wang, B. Yang, J. Zhong, B. Yan, K. Zhang, C. Zhai, Y. Shiraishi, Y. Du and P. Yang, J. Colloid Interface Sci., 2017, 497, 172–180 CrossRef PubMed.
- T. Łuczak, Electrochim. Acta, 2008, 53, 5725–5731 CrossRef.
- J. Du, R. Yue, F. Ren, Z. Yao, F. Jiang, P. Yang and Y. Du, Biosens. Bioelectron., 2014, 53, 220–224 CrossRef PubMed.
- Y.-S. Hsieh, B.-D. Hong and C.-L. Lee, Microchim. Acta, 2016, 183, 905–910 CrossRef.
- C.-L. Sun, H.-H. Lee, J.-M. Yang and C.-C. Wu, Biosens. Bioelectron., 2011, 26, 3450–3455 CrossRef PubMed.
- Z. Dursun and B. Gelmez, Electroanalysis, 2010, 22, 1106–1114 CrossRef.
- T.-Q. Xu, Q.-L. Zhang, J.-N. Zheng, Z.-Y. Lv, J. Wei, A.-J. Wang and J.-J. Feng, Electrochim. Acta, 2014, 115, 109–115 CrossRef.
- S. Ramakrishnan, K. Pradeep, A. Raghul, R. Senthilkumar, M. Rangarajan and N. K. Kothurkar, Anal. Methods, 2015, 7, 779–786 RSC.
- S. Wang, W. Zhang, X. Zhong, Y. Chai and R. Yuan, Anal. Methods, 2015, 7, 1471–1477 RSC.
- J. Yan, S. Liu, Z. Zhang, G. He, P. Zhou, H. Liang, L. Tian, X. Zhou and H. Jiang, Colloids Surf., B, 2013, 111, 392–397 CrossRef PubMed.
- B. Habibi and M. H. Pournaghi-Azar, Electrochim. Acta, 2010, 55, 5492–5498 CrossRef.
- J. Liu, Z. He, J. Xue and T. T. Y. Tan, J. Mater. Chem. B, 2014, 2, 2478–2482 RSC.
- A. Anithaa, N. Lavanya, K. Asokan and C. Sekar, Electrochim. Acta, 2015, 167, 294–302 CrossRef.
- L. Yang, D. Liu, J. Huang and T. You, Sens. Actuators, B, 2014, 193, 166–172 CrossRef.
- N. Karikalan, M. Velmurugan, S. Chen and K. Chelladurai, RSC Adv., 2016, 6, 48523–48529 RSC.
Footnote |
| † Electronic supplementary information (ESI) available. See DOI: 10.1039/c8ra05034a |
|
| This journal is © The Royal Society of Chemistry 2018 |
Click here to see how this site uses Cookies. View our privacy policy here.  Open Access Article
 *
*
![[thin space (1/6-em)]](https://www.rsc.org/images/entities/char_2009.gif) :
:![[thin space (1/6-em)]](https://www.rsc.org/images/entities/char_2009.gif) 1 v/v) ratio of HNO3 (67%) and H2SO4 (97%) and kept at 60 °C for 30 min under constant magnetic stirring. Then, the solution was subjected to ultrasonication for 6 h and finally cooled down to room temperature. The f-MWCNTs residue is washed with DI water to remove acids by centrifugation. The washing and centrifugation process repeated several times until the supernatant liquid to reach the pH value 7, indicating that the acids have been completely removed from the solution. The residual black-powder of f-MWCNTs is dried at room temperature. The well-dried f-MWCNTs is used to combine with olivine LiMnPO4 by sonochemical synthesis method.
1 v/v) ratio of HNO3 (67%) and H2SO4 (97%) and kept at 60 °C for 30 min under constant magnetic stirring. Then, the solution was subjected to ultrasonication for 6 h and finally cooled down to room temperature. The f-MWCNTs residue is washed with DI water to remove acids by centrifugation. The washing and centrifugation process repeated several times until the supernatant liquid to reach the pH value 7, indicating that the acids have been completely removed from the solution. The residual black-powder of f-MWCNTs is dried at room temperature. The well-dried f-MWCNTs is used to combine with olivine LiMnPO4 by sonochemical synthesis method.

![[thin space (1/6-em)]](https://www.rsc.org/images/entities/char_2009.gif) :
:![[thin space (1/6-em)]](https://www.rsc.org/images/entities/char_2009.gif) 1 ratio). The prepared LiMnPO4/f-MWCNTs composite was re-dispersed in DI water and was sonicated for 15 min to obtain the suspension of LiMnPO4/f-MWCNTs composite. About 6 μL of obtained suspension was drop-casted on the surface of well-polished GCE. The drop-casted GCE was allowed to dry at room temperature. The modified electrode was further used for electrochemical investigation. The redox reaction involved in the DA is given the following equation (Scheme 2).
1 ratio). The prepared LiMnPO4/f-MWCNTs composite was re-dispersed in DI water and was sonicated for 15 min to obtain the suspension of LiMnPO4/f-MWCNTs composite. About 6 μL of obtained suspension was drop-casted on the surface of well-polished GCE. The drop-casted GCE was allowed to dry at room temperature. The modified electrode was further used for electrochemical investigation. The redox reaction involved in the DA is given the following equation (Scheme 2).


