
 Open Access Article
 This Open Access Article is licensed under a Creative Commons Attribution-Non Commercial 3.0 Unported Licence
A facile soft template method to synthesize hollow carbon and MnOx composite particles for effective methylene blue degradation†
Qingnan Meng *,
Lulu Du,
Yeye Ji,
Yufei Tang,
Zhenhua Han,
Kang Zhao* and
Guojun Zhang
*,
Lulu Du,
Yeye Ji,
Yufei Tang,
Zhenhua Han,
Kang Zhao* and
Guojun Zhang
School of Material Science and Engineering, Xi'an University of Technology, Xi'an, 710048, China. E-mail: mengqn@xaut.edu.cn; kzhao@xaut.edu.cn
First published on 10th August 2018
Abstract
Hollow carbon and MnOx composite particles (HC-Mn) were fabricated by using polyacrylic acid (PAA) and Mn ion co-assembled colloids as the soft template and resorcinol formaldehyde resin (RF) as the carbon source. The formation process was well studied and a plausible formation mechanism was proposed. The Mn ions played two key roles in the synthesis: first, they promoted the aggregation of the PAA molecules, thus forming the PAA–Mn colloids in solution with high water content, which were suitable for the subsequent RF coating. Secondly, considerable Mn ions were retained after template removal, which were transformed into MnOx particles simultaneously during carbonization. This approach was facile and effective and the as-prepared HC-Mn showed superior catalytic activity toward methylene blue (MB) degradation.
Introduction
In recent years, hollow carbon particles have attracted increasing attention due to their promising features such as favorable conductivity, good stability, large surface area and high affinity to organic chemicals, which make them useful in a wide range of applications including catalyst supports, adsorbents and electrode materials.1–3 The most frequently used strategies for synthesizing the hollow carbon particles are the hard template and soft template methods.4,5 Normally, three steps are involved in the synthesis: (1) template preparation, (2) shell coating, and (3) template removal.4 Rigid particles such as silica, metal and polymer particles are generally used as the hard templates, which can be removed by dissolution, etching or pyrolysis depending on their chemical nature.5–9 For the soft template method, gas bubbles, emulsions and self-assembled amphiphilic molecules are used as the soft templates, which are more facile to prepare and easier to remove than the hard templates.10–14For constructing a carbon shell onto the surface of the template, a polymer layer is usually coated and then carbonized at inert atmosphere.15 Among the various polymeric materials, phenolic resin has been proven to be an ideal carbon source, owing to several advantages including the low cost, easy processing and high char yield.12 Moreover, it is well-known that the Stöber method is widely used for producing monodispersed silica particles and coating silica onto other materials.16 Recently, the Stöber method has been successfully extended to the resorcinol formaldehyde resin (RF) system.17,18 By combining this RF coating process with the above-mentioned template methods, a series of hollow carbon materials have been constructed.11,14,19,20 For example, Zheng's group prepared hollow carbon particles with foam-like shells by using silica spheres as template.19 Liu et al. synthesized hollow carbon spheres with hexadecyl trimethyl ammonium chloride (CTAC) as template and silicate oligomers as structure supporter.20
A plausible application of the hollow carbon particles is to load functional materials into their cavities.4 However, multi-step synthesis and post-treatment are usually indispensable to produce such composites, which hampers their applications.1,2,19 Recent years, benefiting by the convenience and flexibility, polyacrylic acid (PAA) based colloids have been frequently used as soft templates for preparing hollow silica materials.21–24 However, the PAA colloids can hardly form in solutions with a relative larger water/ethanol ratio due to the higher solubility of PAA in water, which is favorable for the RF coating.17,21 We have previously reported that PAA can effectively prevent Mn2+ ions from precipitation in an ethanol/water/ammonia mixture (the volumes are 90, 0.2 and 2 mL, respectively and 0.3 mmol Mn ions are added) due to the strong interactions between the COO− groups and Mn ions.24 Moreover, the PAA–Mn complex can form stable colloids in the solution, which serve as effective templates for constructing hollow silica materials. In this paper, by further increasing the dosage of the Mn ions to 0.5 and 0.7 mmol, stable PAA–Mn colloids have been successfully prepared in an ethanol/water/ammonia mixture with higher water content (the volumes are 8, 20 and 0.2 mL, respectively). Based on the as-prepared PAA–Mn colloids, hollow RF and hollow carbon materials are successfully produced. As far as we known, it is the first application of the PAA based soft template in the extended Stöber method.
More remarkably, in addition to promoting aggregation of the PAA molecules, a large amount of the Mn ions are retained in the hollow RF particles even after template removal, which are further transformed into MnOx particles simultaneously in the following carbonization process. Therefore, the formation of the hollow carbon particles as well as loading them with the functional materials (MnOx particles) are achieved in step, which is more facile than the traditional template methods. The results of the control experiments suggest that the trafficability of the RF shell and the motor ability of the PAA molecules are the two key parameters for the formation of the hollow structures. Moreover, under the optimized condition, the as-prepared hollow carbon and MnOx composite particles show superior catalytic performance and promising stability for methylene blue (MB) decoloration, which may find potential applications in water treatment.
Experimental
PAA (M.W. = 1800) was provided by Aldrich. Manganese acetate tetrahydrate, ammonia solution (25%), ethanol (99.5%), hydrogen peroxide (H2O2, 30%), resorcinol and formaldehyde were purchased from Sinopharm Chemical Reagent Company. All chemical reagents are of analytical grade and used without further purification. Deionized water was used in all the experiments.Typically, 0.5 mmol of the manganese salt and 120 mg PAA were dissolved in 20 mL deionized water, followed by addition of 0.2 mL ammonia solution and 8 mL ethanol to form a stable colloidal dispersion. Then 0.2 g resorcinol and 0.28 mL formaldehyde were added into the colloidal dispersion under vigorous stirring and the reaction time was prolonged for 10 h. The product was collected by centrifugation and then washed with deionized water several times. Finally, the sample was dried and carbonized at 500 °C for 2 h. Abbreviations of the sample names are shown in Table 1.
| Sample name | Abbreviation |
|---|---|
| a n = 0.3, 0.5 or 0.7, representing the amount of manganese salt added. | |
| PAA and Mn ions colloid | PAA–Mn-na |
| RF coated PAA–Mn | PAA–Mn-RF-na |
| Hollow RF and Mn ions composite particles | HRF-Mn-na |
| Solid carbon and MnOx composite particles | SC-Mn-na |
| Hollow carbon and MnOx composite particles | HC-Mn-na |
Characterization
The samples were characterized by X-ray diffraction (XRD, Bruker D8), X-ray photoelectron spectroscopy (XPS, Escalab 250 Xi), thermal gravimetric analysis (TGA, DTG-60AH), transmission electron microscope (TEM, JEM-3010), Fourier transform infrared spectroscopy (FTIR, Nicolet Avatar 360) and Raman spectrometer (Bruker Senterra R200-L). The specific surface areas were measured by an ASAP 2020 system (Micromeritics). UV-vis spectra were recorded on a 7600 MC UV-vis spectrophotometer (BILON).Catalytic activity
In a typical process, 10 mg catalyst was dispersed in 50 mL MB solution (100 mg L−1), which was stirred at 80 °C for 60 min to achieve an adsorption–desorption equilibrium. Then, 3 mL H2O2 solution was added into the mixture. The reaction was conducted at 80 °C and the concentration of the MB solution was monitored by a spectrophotometer based on the adsorption peak at 664 nm. For the recycling tests, the used catalysts were separated by centrifugation and washed with water for three times. After drying in an oven at 60 °C, they were re-dispersed into the MB solution and the catalytic reaction was carried out followed the same procedure mentioned above.Results and discussion
Synthesis and characterization of the HRF-Mn
Previously, we have found that PAA can effectively prevent the Mn ions from precipitation in basic solution. They co-assemble into stable colloids in the solution with low water content, which are further used as templates for constructing hollow silica materials.24 Based on the similarities between the synthesis of SiO2 and RF, the PAA–Mn colloids would also be qualified for the synthesis of hollow RF and hollow carbon based materials.Technically, the RF coating is always conducted in a water/ethanol/ammonia mixture with higher water content.17,19 However, due to the higher solubility of the PAA molecules in water than in ethanol, the PAA–Mn colloids are hardly generated in such a solvent condition.21 As shown in Fig. 1a (solution A), when 0.3 mmol Mn ions are dissolved in the solution, a transparent and clear solution is formed. Interestingly, as the concentrations of Mn ions are further increased to 0.5 and 0.7 mmol, the solution turned from transparent to cloudy (solution B and C), suggesting the formation of PAA–Mn colloids.21,24 Generally, one manganese ion (Mn2+ or Mn3+) couples with two or three COO− groups on PAA, which can serve as cross-linking agents and also reduce the electrostatic repulsion between the PAA chains.24 Therefore, the aggregation of the PAA molecules is promoted by applying a higher Mn loading, thus forming the PAA–Mn colloids. However, when 0.9 mmol manganese salt is added, excess COO− groups are occupied and the PAA–Mn colloids become unstable and eventually precipitate from the solution (solution D).
 | ||
| Fig. 1 Photograph of the PAA solutions containing different amount of Mn ions (a). TEM images of the PAA–Mn-0.5 (b) and PAA–Mn-0.7 (c). | ||
We attempt to analyze the sizes and size distributions of the as-prepared colloids directly by dynamic light scattering (DLS), but no qualified results can be provided, which may be due to the high concentration of ions in the systems. Fig. 1b and c shows the TEM images of the PAA–Mn colloids with different Mn loading (0.5 and 0.7 mmol). For PAA–Mn-0.5 (Fig. 1b), the products are highly aggregated and it is hard to recognize the individual colloid particle. This indicates the PAA–Mn-0.5 are very “soft”, which are coalesced to each other upon drying. In contrast, the profiles of the PAA–Mn-0.7 are clearly observed in Fig. 1c, which are subsphaeroidal with an average size around 29 nm. Since more Mn ions are used in the later sample and they can form more cross-linking sites in the colloids, making the product more rigid.25
For coating the PAA–Mn colloid with a RF layer, resorcinol and formaldehyde were added into the system.14 After polymerization, the products were collected for TEM characterization (Fig. 2). For the PAA–Mn-RF-0.3 (Fig. 2a and d), uniform and well-dispersed spheres are observed. Because of the absence of the PAA–Mn colloids in the solution, the morphology of the product is similar to that in the case of pure RF resin.17 As the manganese concentration increased to 0.5 and 0.7 mmol, the particles in the TEM images are around 41 and 44 nm (Fig. 2b and c), respectively, smaller than the PAA–Mn-RF-0.3. Moreover, the particles are irregular in shape and interconnected to each other, similar to the structures of the PAA–Mn colloids (Fig. 1b and c). However, by careful observation, the particles in Fig. 2e and f are more clear-cut than their counterparts in Fig. 1b and c, indicating the successful coating of the RF layers.
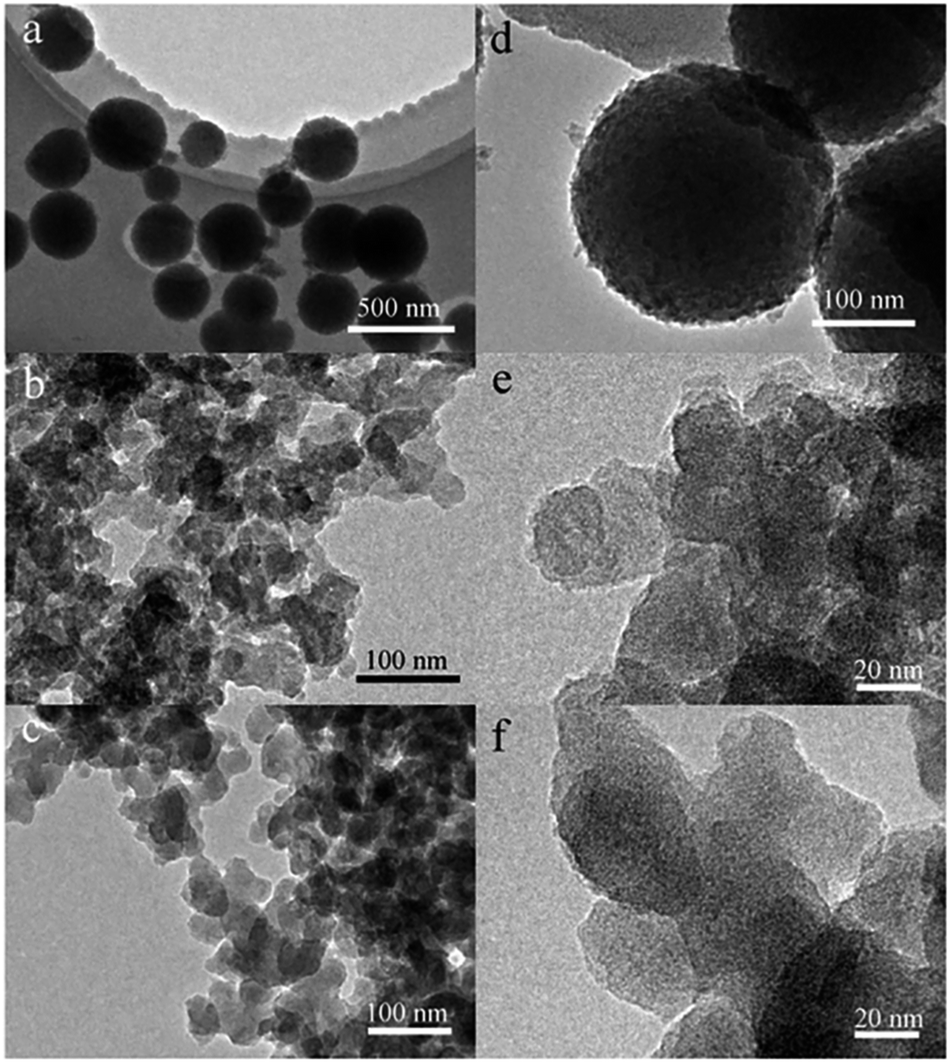 | ||
| Fig. 2 TEM images of the PAA–Mn-RF-0.3 (a and d), PAA–Mn-RF-0.5 (b and e) and PAA–Mn-RF-0.7 (c and f). | ||
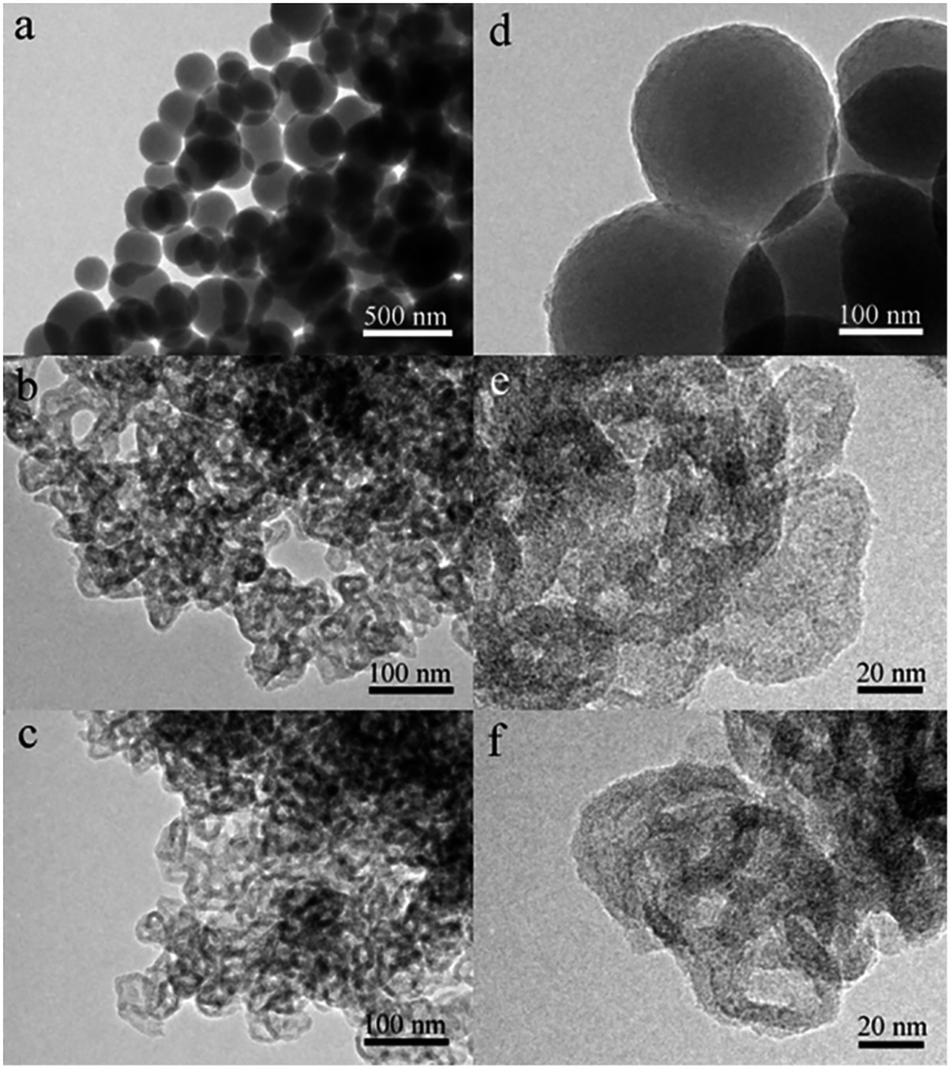
In the next step, the samples shown in Fig. 3 are washed thoroughly with deionized water. For the PAA–Mn-RF-0.3 (Fig. 3a and d), there are no apparent shape or structure changes observed, but the profile of the particles is smoother due to the dissolution of the surface impurities. Interestingly, when the PAA–Mn-RF-0.5 and PAA–Mn-RF-0.7 are washed with water, the final products present obvious hollow structures (Fig. 3b and c). This is due to the high solubility of the PAA molecules in water, which can diffuse out through the pores in the RF resin shell, leaving a cavity behind.21 The cavity sizes of the as-prepared HRF-Mn-0.5 and HRF-Mn-0.7 are 21 and 26 nm, respectively, which is basically the same as the size of colloid particles counted before.
 | ||
| Fig. 3 TEM images of the PAA–Mn-RF-0.3 (a and d), HRF-Mn-0.5 (b and e) and HRF-Mn-0.7 (c and f). | ||
To further prove that the PAA–Mn colloids inside the RF resin shells can be simply removed by water washing, FTIR spectra of the samples were also provided. In the spectrum of the PAA–Mn-RF-0.5 (Fig. 4 line A), broad peaks observed at 3140 and 3433 cm−1 are due to the –OH ended groups in RF resin and PAA.18 The band at 1604 cm−1 can be assigned to the stretches of aromatic rings, implying that RF resin is successfully coated on the sample.26 Meanwhile, the band at 1404 cm−1 is due to the C–O stretching modes of the COO– group.27 The peaks at 1172 cm−1 and 1080 cm−1 are associated with the C–O–C stretching vibrations of methylene ether bridges.26 The peaks at 625 cm−1 and 578 cm−1 are attributable to the stretching mode of Mn–O, confirming the presence of the manganese oxide or the manganese hydroxide.28 After water washing, the FTIR spectrum of the HRF-Mn-0.5 (Fig. 4 line B) is similar to that of PAA–Mn-RF-0.5. However, the relative intensities of the peaks assigned to the COO− group (1396 cm−1) and Mn–O (586 cm−1) are reduced, confirming a large amount of PAA and Mn ions are removed by the washing process. However, the above two peaks do not disappear completely, suggesting that PAA and manganese are still partially residual.18 In fact, based on the concentration of Mn ions (determined by ICP) in the supernatant after centrifugation and washing, it is concluded that about 40% of the total manganese element still exists in the HRF-Mn-0.5, which may facilitate the in situ formation of manganese oxide inside the hollow structures in the next carbonization process.
 | ||
| Fig. 4 FTIR spectra of the PAA–Mn-RF-0.5 (line A) and the HRF-Mn-0.5 (line B). | ||
Synthesis and characterization of the HC-Mn
The TGA profile of the HRF-Mn-0.5 is shown in Fig. 5a. Between 25–300 °C, the weight loss is mainly due to the evaporation of water and evolution of the unreacted oligomers.29 Pyrolytic carbonization occurs mainly in the range of 300–700 °C. And the structure of matrix carbon becomes ordered within the 700–1000 °C.29,30 In order to ensure both of the high carbon yield and good dispersion of the products, the carbonization temperature is set at 500 °C. Fig. 5b shows the FTIR spectra of HRF-Mn-0.5 (line A) and HC-Mn-0.5 (line B). After carbonization, the peaks correspond to Mn-O (632 and 578 cm−1) become more remarkable, while most of the other bands are greatly weakened, indicating the decomposition of the organic groups.18 However, there are still plenty of organic groups on the surface of the HC-Mn-0.5, which may enhance their dispersibility in water. | ||
| Fig. 5 TGA curves of the HRF-Mn-0.5 at N2 atmosphere (a), the FTIR spectra of HRF-Mn-0.5 (line A) and HC-Mn-0.5 (line B) (b), Raman spectrum of the HC-Mn-0.7 (c), and XRD patterns of the SC-Mn-0.3 (line A), HC-Mn-0.5 (line B) and HC-Mn-0.7 (line C) (d). | ||
Fig. 5c presents the Raman spectrum of the carbonized sample (HC-Mn-0.7), in which two strong peaks at around 1355 and 1584 cm−1 are observed. The former is due the characteristic D band and the latter is attributed to the G band of carbon material.31 The crystallinity of the carbon materials is usually evaluated by the peak intensity ratio between the D and G bands (ID/IG).31 Here, the ID/IG value is about 0.85, indicating the presence of large amount of graphitic carbon.27 The XRD patterns of the SC-Mn and HC-Mn are shown in Fig. 5d. For all the samples, the broad peaks around 20° are attributed to the (002) Bragg diffraction from turbostratic carbon.18 However, no visible diffraction peaks belonging to the manganese oxides are observed, which may be due to their small size and low content in the samples.18
The chemical bonding states and compositions in the HC-Mn are further investigated by the X-ray photoelectron spectroscopy (XPS). The signals of manganese, oxygen and carbon elements can be observed from the survey spectra shown in Fig. 6a. From the relative contents shown in Table 2, we can see that the HC-Mn-0.7 bears the highest Mn loading. As shown in Fig. 6b, two peaks around 653.6 and 641.8 eV are observed in the three XPS spectra, corresponding to the Mn 2p3/2 and Mn 2p1/2 spin–orbit states of Mn3O4, respectively.18 The observed separation of 11.8 eV is in consistent with earlier reports for Mn3O4.32 Furthermore, the satellites located around 646 eV indicate the probable presence of MnO phase.10 The XPS results suggest that MnO and Mn3O4 may present in the three samples, which are suitable for catalyzing the Fenton reaction.18
 | ||
| Fig. 6 XPS survey spectra (a) and the high-resolution Mn 2p spectra (b) of the samples. | ||
Fig. 7 shows the TEM images of the SC-Mn and HC-Mn. The morphologies of the three samples have no significant changes compared to those before carbonization. However, due to the shrinkage during carbonization, the cavity sizes of HC-Mn-0.5 and HC-Mn-0.7 are measured to be 14 and 21 nm, smaller than those shown in Fig. 3b and c, respectively. Interestingly, in the enlarged image of Fig. 7f, no MnOx particles are observed, maybe due to their small size or similar contrast to carbon.18 Additional element mapping images by EDS are given in Fig. 8, confirming the existence and homogeneous distribution of the Mn element.
 | ||
| Fig. 7 TEM images of the SC-Mn- 0.3 (a and d), HC-Mn-0.5 (b and e) and HC-Mn-0.7 (c and f). | ||
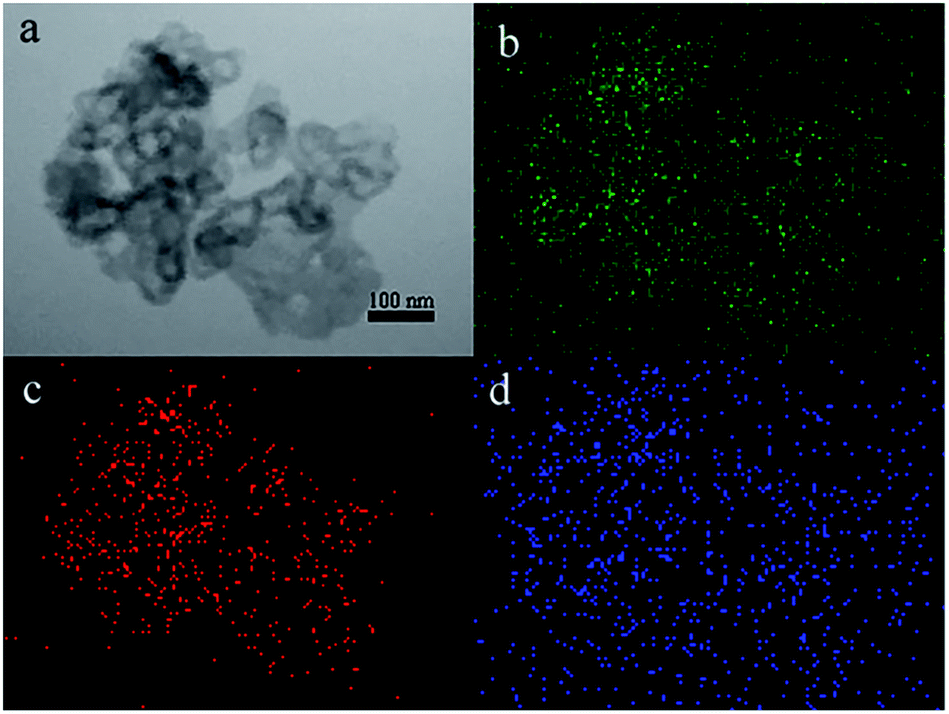 | ||
| Fig. 8 TEM image for HC-Mn-0.7 (a) and the corresponding C, Mn and O mapping images by EDS (b–d). | ||
Fig. 9a shows the N2 adsorption–desorption isotherms of the manganese oxide and carbon composite particles. According to the IUPAC classification, all the isotherms are identified as type IV with a distinct hysteresis loop at relative pressures (P/P0) from about 0.45 to 1.0, indicating the presence of mesopores.26,33 Fig. 9b shows the pore size distributions of the three samples. Since no porogen (such as CTAB) was used in the synthesis, no sharp peaks are observed in all the three curves. For the SC-Mn-0.3, most of the pores are located around 2.0 nm, which are generated by the released gas during carbonization.6 In the curves of the HC-Mn-0.5 (line B) and HC-Mn-0.7 (line C), broad peaks in the range of 12–15 nm and 18–22 nm are consistent with the cavity sizes of the HC-Mn-0.5 (14 nm) and HC-Mn-0.7 (21 nm), respectively. As listed in Table 2, benefiting from the large surface to volume ratio of the hollow structures, the BET surface areas of the HC-Mn-0.5 and HC-Mn-0.7 are all above 300 m2 g−1, much larger than that of the SC-Mn-0.3 (195.5 m2 g−1). Moreover, the HC-Mn-0.5 bears a larger BET surface area than HC-Mn-0.7, which may be attributed to the higher Mn content and more aggregation of the HC-Mn-0.7.
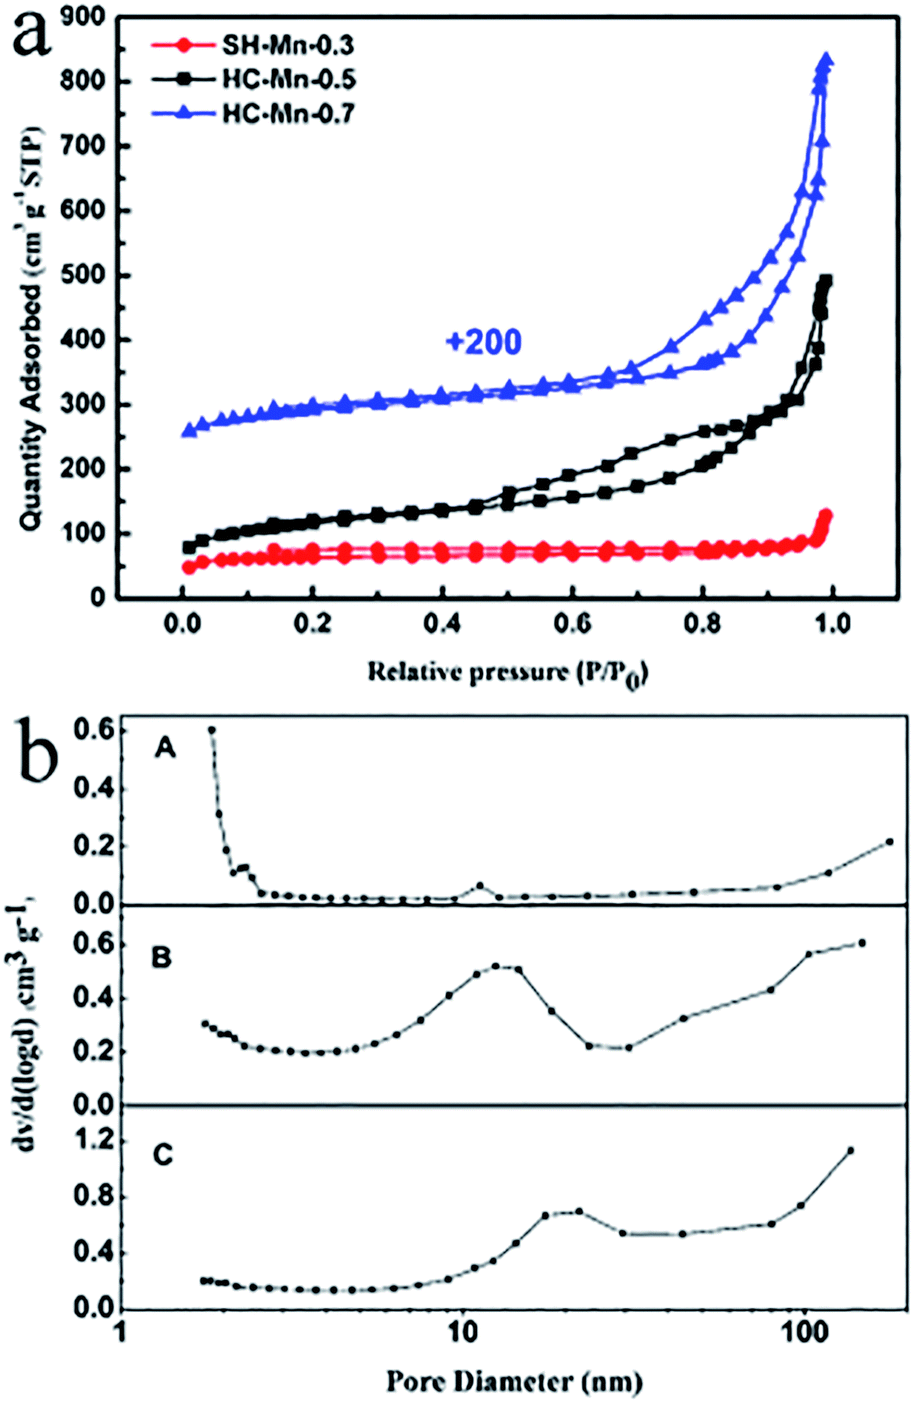 | ||
| Fig. 9 N2 adsorption–desorption isotherms of the manganese oxide and carbon composites (a) and the pore size distributions of the SC-Mn-RF-0.3 (line A), HC-Mn-0.5 (line B) and HC-Mn-0.7 (line C) (b). | ||
Formation mechanism: dual roles of the Mn ions
Based on the above results, the formation mechanisms of the HRF-Mn and HC-Mn are proposed. Due to the strong interaction between Mn ions and the COO− groups on PAA, the Mn ions serve as the cross-linking agent and charge shield, promoting the formation of the PAA–Mn colloids in water/ethanol/ammonia mixture with high water content.24 Then, the PAA–Mn colloid is coated with a RF layer via the extended Stöber method. In previous reports, PAA based colloids are frequently used to prepare hollow silica materials. Since the silica shells synthesized by the Stöber method are normally porous, the low-molecular weighted PAA can diffuse out of the silica shell and dissolve in water.21 So, it is obvious that the PAA molecules can also pass through the RF shell synthesized by the extended Stöber method to form the hollow structure. For comparison, if the RF coated colloids (using the PAA–Mn-RF-0.5 as example) were first cured by hydrothermal treatment, and then washed with deionized water, solid particles instead of HRF are produced (Fig. 10a and c). It is well known that the molecular network of the cured RF resin is more compact,34 which may prevent the PAA molecules passing through, leading to the formation of solid structure. In addition, if some H2O2 was added into the solution of the PAA–Mn colloids, transforming most of the Mn ions into solid manganese oxide particles in advance, hollow structure cannot be produced either (Fig. 10b and d).18 We guess that the solid particles may restrict the movement of the PAA molecules, making them trapped inside the RF shells. These results suggest that the trafficability of the RF shell and the motor ability of the PAA molecules are the two key parameters for preparing of the hollow RF structure. | ||
| Fig. 10 TEM images of the washed products if the colloids were first hydrothermally cured (a and c) and if H2O2 was added into the solution of the PAA–Mn colloids before RF coating (b and d). | ||
Moreover, unlike the small molecules, the PAA cannot be removed completely. This phenomenon is also observed in the Arabic gum system.35 The residual PAA can catch considerable Mn ions, which further serve as the precursor for the in situ formation of MnOx during the carbonization step. Our strategy is very feasible to synthesize the MnOx and hollow carbon composites. In addition, it also ensures the small size and well dispersion of the MnOx, both of which are very important in catalysis.17
Catalytic performance
To evaluate the catalytic activities of the as-prepared samples (SC-Mn-0.3, HC-Mn-0.5, HC-Mn-0.7) in Fenton process, an organic dye of MB is chosen as the model pollutant.36–40 Fig. 11a shows the UV-vis absorption curves recorded at different time intervals using HC-Mn-0.7 as catalyst. Before adding H2O2, the MB solution and the catalysts were stirred for 60 min to reach the absorption equilibrium. As H2O2 is added, the peak intensity of the MB solution decreases sharply in the first 10 min, and then continuously drops to nearly 0 at 50 min, indicating the gradual degradation of MB.33,41 The degree of MB degradation is calculated by the absorbance of the MB at 664 nm. As can be seen in Fig. 11b, due to their larger surface area, the MB adsorptions in HC-Mn-0.5 and HC-Mn-0.7 are 17.4% and 19.3%, respectively, higher than the SC-Mn-0.3.42,43 When H2O2 is added, 21.5%, 88.3% and 94.4% of MB dye are degraded by SC-Mn-0.3, HC-Mn-0.5 and HC-Mn-0.7 in 50 min, suggesting the superior catalytic activity of the HC-Mn-0.7.18,24 For comparison, the MB degradation is only 6.7% if only H2O2 is used but no catalyst is added, confirming that the decoloration of the MB solution is due to the catalytic effect of the catalyst. | ||
| Fig. 11 Typical UV-vis absorption spectra of the MB solution recorded at reaction different time using HC-Mn-0.7 as catalyst (a), plots of C/C0 (b) and ln(C0/C) (c) versus reaction time and the recycling performance of HC-Mn-0.7 (d). | ||
In order to investigate the degradation kinetics, the first-order kinetic model is applied to fit the degradation data and the results are shown in Fig. 11c. It is apparent that all experimental data follow the first-order kinetic model well.18 The degradation rate constants of MB for SC-Mn-0.3, HC-Mn-0.5 and HC-Mn-0.7 are 0.00335, 0.03844 and 0.05868 min−1, respectively. Obviously, the HC-Mn-0.7 exhibit the best activity. The superior catalytic activity of the HC-Mn-0.7 is attributed to the relatively high content, small size, well dispersion, and low valence states of the MnOx.18,41 In addition, the large surface area of the hollow structure can provide faster mass exchange, which is favourable for the catalytic reaction. Compared to those of the manganese oxides-based catalysts (Table S1†), the results are more remarkable, even though the Mn loading in our case is relatively low.
As shown in Fig. 11d, the HC-Mn-0.7 also shows an excellent recyclability, since the removal efficiency of MB only decreased by 3.0% after five cycles. This phenomenon may be due to the large number of functional groups on the surface of HC-Mn-0.7, which prevents the Mn ions from leaching during the catalytic reaction. In addition, Fig. S1† shows the TEM image of the HC-Mn-0.7 after the cycling tests. Compared with the samples shown in Fig. 7, no apparent structure change is observed, proving the good stability of the HC-Mn-0.7.
Conclusions
In summary, a soft template method is shown here to synthesis the HC-Mn materials, in which the hollow structures are formed by simply water washing and the incorporation of the MnOx can be simultaneously achieved during the carbonization process. The Mn ions play two key roles in the synthesis: First, they promote the formation of the PAA–Mn colloids in solutions which are suitable for RF coating. Secondly, considerable Mn ions are retained after the template removal, which are transformed into MnOx. By conducting control experiments, it has been proven that the trafficability of the RF shell and the motor ability of the PAA molecule are both important for the formation of the hollow structures. This approach is much more facile and effective than the traditional methods and the as-prepared HC-Mn-0.7 showed superior catalytic activity toward methylene blue degradation.Conflicts of interest
There are no conflicts of interest to declare.Acknowledgements
This work was supported by the National Natural Science Foundation of China (No. 51502241, 51672211, 51572217), China Postdoctoral Science Foundation (No.2015M582689), and Innovation chain of key industries in Shaanxi industrial field project (No. 2016KTZDGY09-06-02).Notes and references
- Y. M. Shao, L. C. Zhou, C. Bao and J. J. Ma, Carbon, 2015, 89, 378 CrossRef.
- Y. Hong, I. A. Choi and W. S. Seo, Sci. Rep., 2018, 8, 7469 CrossRef PubMed.
- J. Chen, M. Hong, J. F. Chen, T. Z. Hu and Q. Xu, Appl. Surf. Sci., 2018, 443, 367 CrossRef.
- S. J. Li, A. Pasc, V. Fierro and A. Celzard, J. Mater. Chem. A, 2016, 4, 12686 RSC.
- R. Atchudan, S. Perumal, T. N. J. I. Edison and Y. R. Lee, Mater. Lett., 2016, 166, 145 CrossRef.
- H. Y. Zhao, F. Zhang, S. M. Zhang, S. N. He, F. Shen, X. G. Han, Y. D. Yin and C. B. Gao, Nano Res., 2018, 11, 1822 CrossRef.
- F. L. Wang, L. L. Pang, Y. Y. Jiang, B. Chen, D. Lin, N. Lun, H. L. Zhu, R. Liu, X. L. Meng, Y. Wang, Y. J. Bai and L. W. Yin, Mater. Lett., 2009, 63, 2564 CrossRef.
- C. Zhang, G. Bhargava, M. D. Elwell, S. Parasher, B. Zhou, D. Yates, I. Knoke, I. Neitzel and Y. Gogotsi, J. Mater. Sci., 2014, 49, 1947 CrossRef.
- R. J. White, K. Tauer, M. Antonietti and M. M. Titirici, J. Am. Chem. Soc., 2010, 132, 17360 CrossRef PubMed.
- W. Zeng, Y. P. Huang, Y. Xiong, N. Wang, C. Xu and L. S. Huang, J. Alloys Compd., 2018, 731, 210 CrossRef.
- H. P. Su, A. A. Barragan, L. X. Geng, D. H. Long, L. C. Ling, K. N. Bozhilov, L. Mangolini and J. C. Guo, Angew. Chem., Int. Ed., 2017, 56, 10780 CrossRef PubMed.
- Y. Q. Li, H. B. Tan, R. R. Salunkhe, J. Tang, L. K. Shrestha, B. P. Bastakoti, H. P. Rong, T. Takei, J. Henzie, Y. Yamauchi and K. Ariga, Chem. Commun., 2017, 53, 236 RSC.
- C. H. Chen, H. Y. Wang, C. L. Han, J. Deng, J. Wang, M. M. Li, M. H. Tang, H. Y. Jin and Y. Wang, J. Am. Chem. Soc., 2017, 139, 2657 CrossRef PubMed.
- A. B. Chen, Y. Q. Li, L. Liu, Y. F. Yu, K. C. Xia, Y. Y. Wang and S. H. Li, Appl. Surf. Sci., 2017, 393, 151 CrossRef.
- M. C. Carlos, Adv. Colloid Interface Sci., 2016, 236, 113 CrossRef PubMed.
- M. P. I. Medizin, J. Colloid Interface Sci., 1968, 26, 62 CrossRef.
- J. Liu, S. Z. Qiao, H. Liu, J. Chen, A. Orpe, D. Y. Zhao and G. Q. Lu, Angew. Chem., Int. Ed., 2011, 50, 5947 CrossRef PubMed.
- Q. N. Meng, L. L. Du, J. Yang, Y. F. Tang, Z. H. Han, K. Zhao and G. J. Zhang, Colloids Surf., A, 2018, 548, 142 CrossRef.
- X. L. Fang, J. Zang, X. L. Wang, M. S. Zhengv and N. F. Zheng, J. Mater. Chem. A, 2014, 2, 6191 RSC.
- C. Liu, J. Wang, J. S. Li, M. L. Zeng, R. Luo, J. Y. Shen, X. Y. Sun, W. Q. Han and L. J. Wang, ACS Appl. Mater. Interfaces, 2016, 8, 7194 CrossRef PubMed.
- Y. Wan and S. H. Yu, J. Phys. Chem. C, 2008, 112, 3641 CrossRef.
- T. Y. Chika, I. Hiroshi and F. Masayoshi, Colloids Surf., A, 2015, 483, 81 CrossRef.
- C. Y. Tao, H. W. Yan, X. D. Yuan, C. Z. Yao, Q. Yin, J. Y. Zhu, W. Ni, L. H. Yan and L. Zhang, Colloids Surf., A, 2016, 501, 17 CrossRef.
- Q. N. Meng, S. Y. Xiang, W. Cheng, Q. N. Chen, P. F. Xue, K. Zhang, H. C. Sun and B. Yang, J. Colloid Interface Sci., 2013, 405, 28 CrossRef PubMed.
- F. Peng, G. Z Li, X. X. Liu, S. Z. Wu and Z. Tong, J. Am. Chem. Soc., 2008, 130, 16166 CrossRef PubMed.
- J. Yi, X. P. Li, S. J. Hu, W. S. Li, L. Zhou, M. Q. Xu, J. F. Lei and L. S. Hao, J. Power Sources, 2011, 196, 6670 CrossRef.
- Q. N. Meng, F. F. Zhang, L. M. Wang, S. Y. Xiang, S. J. Zhu, G. Y. Zhang, K. Zhang and B. Yang, RSC Adv., 2014, 4, 713 RSC.
- J. W. Wen, D. W. Zhang, Y. Zang, X. Sun, B. Cheng, C. X. Ding, Y. Yu and C. H. Chen, Electrochim. Acta, 2014, 133, 515 CrossRef.
- L. Costa, L. R. Montelera, G. Camino, E. D. Weil and E. M. Pearce, Polym. Degrad. Stab., 1997, 56, 23 CrossRef.
- C. Q. Liu, K. Z. Li, H. J. Li, S. Y. Zhang and Y. L. Zhang, Polym. Degrad. Stab., 2014, 102, 180 CrossRef.
- R. Atchudan, S. Perumal, T. N. J. I. Edison and Y. R. Lee, Mater. Lett., 2016, 166, 145 (RSC Adv., 2015, 5, 93364) CrossRef.
- Y. Zhao, C. G. Li, F. F. Li, Z. H. Shi and S. H. Feng, Dalton Trans., 2011, 40, 583 RSC.
- Z. C. Bai, B. Sun, N. Fan, Z. C. Ju, M. H. Li, L. Q. Xu and Y. T. Qian, Chem. - Eur. J., 2012, 18, 5319 CrossRef PubMed.
- J. M. Wang, X. W. Huang, P. Zhao, X. Y. Wang, Y. Tian, C. M. Chen, J. C. Wang, Y. Li, W. Wan, H. M. Tian, M. Xu, C. Y. Wang and L. Q. Wang, Micromachines, 2018, 9, 24 CrossRef.
- Q. N. Meng, K. Wang, Y. F. Tang, K. Zhao, S. Y. Xiang, K. Zhang and L. Zhao, Chem. J. Chin. Univ., 2017, 38, 503 Search PubMed.
- L. Peng, J. L. Zhang, Z. M. Xue, B. X. Han, J. S. Li and G. Y. Yang, Chem. Commun., 2013, 49, 11695 RSC.
- P. Q. Zhang, Y. G. Zhan, B. X. Cai, C. C. Hao, J. Wang, C. X. Liu, Z. J. Meng, Z. L. Yin and Q. Y. Chen, Nano Res., 2010, 3, 235 CrossRef.
- R. Atchudan, T. N. J. I. Edison, S. Perumal, D. Karthikeyan and Y. R. Lee, J. Photochem. Photobiol., A, 2017, 333, 92 CrossRef.
- R. Atchudan, T. N. J. I. Edison, S. Perumal, D. Karthikeyan and Y. R. Lee, J. Photochem. Photobiol., B, 2016, 162, 500 CrossRef PubMed.
- R. Atchudan, T. N. J. I. Edison, S. Perumal, N. Karthik, D. Karthikeyan and Y. R. Lee, J. Photochem. Photobiol., A, 2018, 350, 75 CrossRef.
- B. Debnath, A. S. Roy, S. Kapri and S. Bhattacharyya, Chemistry Select, 2016, 1, 4265 Search PubMed.
- A. A. Amer, S. M. Reda, M. A. Mousa and M. M. Mohamed, RSC Adv., 2017, 7, 826 RSC.
- R. C. Yang, T. X. Tao, Y. M. Dai, Z. M. Chen, X. Zhang and Q. W. Song, Catal. Commun., 2015, 60, 96 CrossRef.
Footnote |
| † Electronic supplementary information (ESI) available: Table S1 comparison of the catalytic performance for MB degradation by different manganese oxide based catalysts under similar reaction conditions. Fig. S1 TEM image of the HC-Mn-0.7 after the catalysis reaction. See DOI: 10.1039/c8ra04960b |
| This journal is © The Royal Society of Chemistry 2018 |