
 Open Access Article
 This Open Access Article is licensed under a Creative Commons Attribution-Non Commercial 3.0 Unported Licence
Deposition of methylammonium iodide via evaporation – combined kinetic and mass spectrometric study†
Martin J. Bækbo a,
Ole Hansenb,
Ib Chorkendorffa and
Peter C. K. Vesborg*a
a,
Ole Hansenb,
Ib Chorkendorffa and
Peter C. K. Vesborg*a
aSurfcat, Technical University of Denmark, Fysikvej, Building 312, 2800 Kgs. Lyngby, Denmark. E-mail: Peter.Vesborg@fysik.dtu.dk
bDepartment of Micro- and Nanotechnology, Technical University of Denmark, 2800 Kgs. Lyngby, Denmark
First published on 23rd August 2018
Abstract
Methylammonium lead halide perovskites have recently emerged as a very attractive and versatile material for solar cell production. Several different perovskite fabrication methods can be used though most of them involve either spin coating, evaporation under high vacuum or a combination hereof. In this study we focus on thermal evaporation of methylammonium iodide (MAI), or more specifically, why this process, in terms of a physical vapour deposition, requires such a high deposition pressure to be successful. We use quartz crystal micro balance (QCM) measurements as well as mass spectrometry. The results indicate that MAI has a very low sticking especially if the substrate is held at elevated temperatures and is furthermore observed to evaporate with disproportionation into primarily CH3NH2 and HI. Even when PbCl2 is deposited on the QCM crystal, so that CH3NH3PbI(3−x)Clx perovskite can form, the MAI sticking remains low, possibly due to the requirement that both species be present on the film surface at the same time to form the perovskite. The results provide guidelines for designing a perovskite deposition chamber and additionally fundamental information about MAI evaporation.
1 Introduction
Methylammonium lead halide perovskites (CH3NH3PbX3, X = I, Br, Cl) have received a massive amount of attention in recent years due to their very attractive material properties which make them highly efficient as the absorber in a solar cell.1 These properties include good carrier mobility, a high defect tolerance, high absorbance in the visible range and, additionally, band gap tunability depending on the halides included. Furthermore a wellspring of different fabrication methods have been demonstrated in literature thus making the perovskites very flexible materials to work with.2–8 Though the most common fabrication methods involve spin coating several groups have reported using high- or low vacuum deposition to fabricate devices. The advantage of using vacuum systems is the ability to control the fabrication environment to a much higher degree which normally results in a better reproducibility and a superior film quality. In spite of this, the reported power conversion efficiencies (PCEs) from studies using co-evaporation under high vacuum conditions are often inferior to those obtained using either spin coating or sequential deposition though examples of high efficiency cells have been reported in literature.2,7,9–12 As noted by Ono et al.9 this shortcoming is often attributed to the difficulties controlling the rate of evaporation of methylammonium iodide (MAI), but the nature of these difficulties are not detailed.The challenge posed has given rise to some clever deposition schemes which all rely on controlling the partial vapour pressure of the MAI rather than its rate.2,10,13,14 Ono et al.13 use a high vacuum system in which the perovskite is formed by co-evaporating PbCl2 and MAI while controlling the pressure of the later using the effusion cell temperature and a gate valve. Li et al.10 demonstrates a sequential deposition method where the Pb-containing film is deposited by spin coating after which it is transferred to a test tube containing MAI. The tube is subsequently evacuated using a roughing pump and then heated by submerging it into an oil bath. In both cases the deposition pressure is much higher than what is usual for PVD processes (0.31 Pa and 40.0 Pa, respectively) which usually run at pressures below 5 × 10⁻⁴ Pa. At a pressure of 5 × 10⁻⁴ Pa one would expect that the (nearly) ballistic transport from the source to the target would give rise to a high incident flux density and good films. It is therefore peculiar that such high deposition pressures are needed for successful perovskite deposition.
In this study we combine quartz crystal microbalance (QCM) measurements of MAI deposition and evaporation with mass spectrometry to examine what transpires during MAI evaporation under vacuum conditions (<5 × 10⁻³ Pa). The QCM experiments give information about MAI sticking to surfaces as a function of temperature and by depositing at layer of PbCl2 on the crystal before initiating the experiment insight into the reaction kinetics of the perovskite layer is gained. Mass spectrometry complements the kinetics by elucidating which compounds evaporate when MAI is heated in a vacuum. The knowledge that may be gained from mass spectrometry, is the reason why it has been used in several previous studies.15,16 The emphasis of these recent studies was mostly CH3NH3PbI3 degradation and thus the applied temperature window is much wider than the 85–150 °C, which is usually used when evaporating MAI.5,10,11,13,17,18 In both papers the authors report that MAI appears to thermally decompose into its constituents upon evaporation. Nenon et al.16 measure peaks associated with CH3NH2 at a temperature of around 110 °C but observe a shift in the cracking pattern towards NH3 and CH3 at elevated temperatures. The fact that the mass range in their experiments does not extend above 100 AMU e−1 does, however, mean that they are not able to directly observe any species containing I. They are thus not able to give the full picture of MAI decomposition. Juarez-Perez et al.15 show measurements with an extended mass range (up to 200 AMU e−1) and report that MAI decomposes into CH3I and NH3 but do not observe any volatiles below 300 °C in contrast to Nenon et al.16 Though it is certainly interesting to know what MAI decomposes into at 300 °C it is, as mentioned, a much too high temperature for MAI deposition. In this work we therefore present mass spectrometry measurements of MAI in the relevant 100–130 °C deposition temperature range supported by high temperature (up to 380 °C) experiments for completeness. By using a sector magnet mass spectrometer a highly increased mass resolution is obtained while the mass-range is, importantly, extended up to 380 AMU e−1 which allows us to detect I containing compounds. By changing the ionization energy we can, additionally, infer the effects of ionization fragmentation. This allows us elucidate if the MAI decomposition happens thermally or in the ionization process. By combining the results of both methods we suggest an explanation of the peculiar behaviour of evaporative deposition of MAI, which anyone designing an MAI evaporation system for perovskites or otherwise should take into consideration.
2 Experimental
2.1 Quartz crystal microbalance experiments
QCMs are routinely used in physical vapour deposition systems as they allow one to gauge the thickness of the layers being deposited by measuring the change of the resonance frequency of a piezoelectric quartz crystal as the film grows on it. The correlation between the frequency change Δf and the change in deposited mass per unit area Δm is given by Sauerbrey equation| Δf = −CfΔm, | (1) |
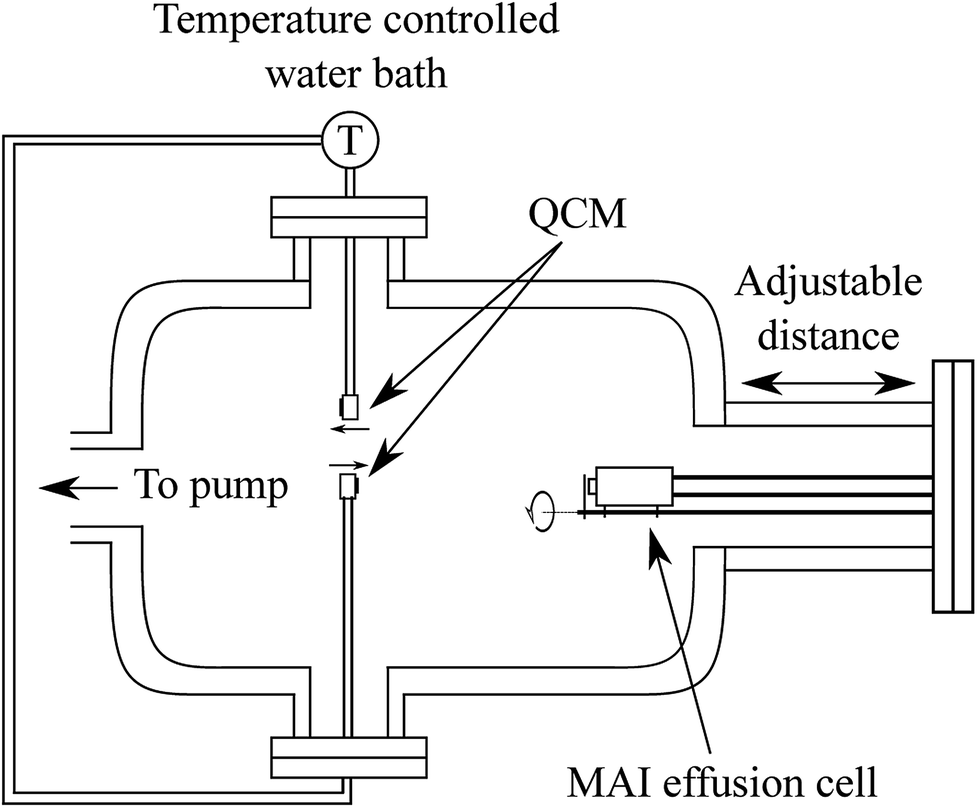 | ||
| Fig. 1 Schematic drawing of the QCM set up which includes two QCMs, which can be cooled or heated using a water circulation bath, and an MAI effusion cell which can be closed with a shutter. The distance from the effusion cell to the QCM sensor can be varied by inserting a spacer on the chamber flange. The two QCMs sit with equal distance to the center line of the effusion cell at a 180° angle with respect to each other (see Fig. S1†) and with one facing the MAI source while the other faces away from it. | ||
In the system two QCMs, connected to an Inficon SQM-160 control box, were installed with one facing the effusion cell and one rotated by 180° facing away from it. Both sensors were connected to a circulating water bath equipped with a thermostat to control the temperature of the crystal during the experiments. The effusion cell was an almost closed cell machined from copper with a small “chimney” in the top which could be closed off by a mechanical shutter. Using this system we measured the deposition rate of MAI with the forward-facing QCM either cooled to ca. 20 °C or held at 65 °C, 75 °C or 85 °C via the circulating water. For each experiment a fresh 6 MHz QCM crystal was used either as delivered or with various layers of PbCl2 (Sigma Aldrich 98%) deposited onto it prior to the experiment using thermal evaporation in a high vacuum chamber.
As the resonance frequency of the QCM changes with temperature a heating and thermalization procedure was employed to ensure that the sensor was stable before beginning the experiment. The water bath was run for 20 min to stabilize at the desired temperature after which the sensor was given an hour to stabilize with the water flowing. This procedure lead to a frequency change of roughly −125 Hz when heating to 85 °C (see Fig. S2† for details). Following the heating of the QCM, the MAI source was given 30 min to heat to 130 °C and to stabilize. In order to gauge the background rate of the system (i.e. the deposition rate when the MAI source shutter is closed) the MAI deposition was chopped by opening and closing the shutter every 10 minutes (see Fig. 2). The final two types of experiments were to (1) change the distance from the source to the QCM and (2) to measure the indirect (non ballistic) deposition by using the reverse-facing QCM. The MAI used in the QCM experiments was bought from Solaronix (lot number 24115).
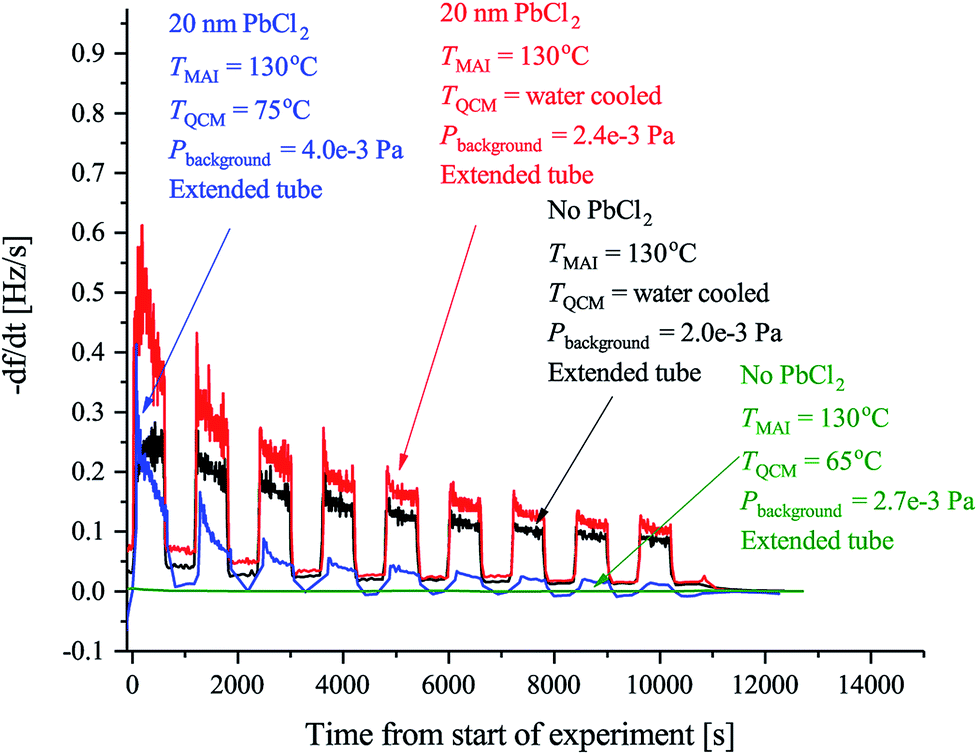 | ||
| Fig. 2 The observed rates of the MAI sticking experiments using the forward facing QCM where TMAI is the MAI source temperature, TQCM is the QCM temperature, Pbackgroud is the background pressure. Extended tube means that the distance from the source to the sensor was 19.5 cm as compared to the 9.5 cm used in Fig. 3. The black curve shows the rate measured when the QCM crystal is water cooled and blank. The red curve shows the rate when the QCM crystal is water cooled and has 20 nm of PbCl2 deposited on it. Finally the blue curve shows the rate when the QCM crystal is heated to 75 °C and has 20 nm of PbCl2 while the green curve shows the rate when a blank crystal heated to 65 °C, is used. In all cases the signal was chopped using 10 min intervals. | ||
2.2 Mass spectrometry experiments
The mass spectrometry experiments were carried out using a Waters VG AutoSpec sector magnet mass spectrometer, which ran at a background pressure below 5 × 10⁻⁵ Pa. To estimate the effects of ionization fragmentation two different ionization energies, namely 35 eV and 14 eV, were used. When comparing spectra captured at the two energies it is important to emphasize that count rate of any given compound depends on the lens and slit settings of the instrument and thus the intensities observed in the two experiments cannot be compared directly. Conversely, the relative heights in spectra taken at the same settings as well as peak occurrences may be compared. To calibrate the mass/charge axis the reference chemical perfluorokerosene (PFK) was injected through a septum and let into the analyser were a calibration scan could be recorded. By comparing the analyte scan with a PFK reference, as well as one for atmospheric air, the appropriate shift in the mass/charge axis could be identified and applied in subsequent data treatment. Following the calibration run the system was evacuated for approximately 50 min to remove any leftover PFK.The MAI was introduced in solid form using a source in which a small Al cylinder carrying the powder could be inserted inside a heating stage located immediately adjacent to the ionization zone. To estimate the background signal of the system the source with the (empty) Al cylinder was inserted and heated to 130 °C before a spectrum was recorded using either 14 eV or 35 eV as ionization energy. Then the source was allowed to cool before the MAI was loaded and the source reinserted. The source was then heated to 100 °C and subsequently to 110 °C where measurements using an ionization energy of 14 eV were performed at each temperature. Finally the source was heated to 130 °C where measurements using both 14 eV and 35 eV as ionization energies, were conducted. For the high temperature experiments the equipment was initially calibrated in a similar manner as before. Following the calibration 1–2 mg of MAI was introduced and using an ionization energy of 14 eV a mass spectrum was recorded at 100 °C. The temperature was then increased in steps of 10 °C until reaching 140 °C where mass spectra were recorded at each temperature. After 140 °C the step size was increased to 20 °C until a final temperature of 380 °C was reached. Each temperature increase and measurement step took approximately 12 min. The MAI used in the mass spectrometry experiments was synthesised in a similar manner as reported by Li et al.10 In short, methylamine (Sigma Aldrich 33% in ethanol) was mixed with pure ethanol kept at 0 °C using an ice bath. Afterwards HI (Sigma Aldrich 57% in water) was added drop-wise while the solution was stirred vigorously using a stir bar and left to stir for 2 h. The MAI powder was then reclaimed using a rotary evaporator before being recrystallized from pure ethanol and dried at 70 °C in a tube furnace under an Ar flow.
3 Results and discussion
3.1 QCM experiments
Previous work has observed that MAI “seems to go everywhere” in the vacuum chamber during deposition suggesting that line of sight between the MAI source and the target is not needed.13 The obvious implication is that MAI has very low sticking and bounces around in the chamber despite the chamber walls being at room temperature. We see a rather dramatic demonstration of this with the experiment using the reversed QCM where a substantial rate is observed even though there is no direct path from the source to the QCM surface. The same phenomenon explains that there is no apparent change in the deposition rate upon moving the source further away from the QCM (see Fig. S3 and S4†). It is important to underscore that under the experimental conditions used (i.e. a deposition pressure of 6.67 × 10⁻³ Pa) the mean free path is larger than the chamber dimensions and one would thus ordinarily expect that no rate would be observed when the QCM is reversed and cannot “see” the source directly. The inference is that MAI has a very low sticking coefficient, which also explains why high deposition pressures are needed to obtain proper perovskite deposition. To study this in more detail we performed a series of experiments to gain further insight into the kinetics of MAI deposition. In the first experiment a blank QCM crystal was used and the sensor was kept at cooling water temperature. Then a measurement using a water cooled sensor along with a crystal with a PbCl2 layer was performed and finally a sensor held at 75 °C also with a PbCl2 layer was used. The first configuration mimics the situation where one controls the deposition by controlling the rate of MAI and thus serves as a reference for the rest of the experiments. The following two experiments are equivalent to the sequential deposition scheme performed at either room temperature or at an elevated temperature, which has been reported to be optimal for perovskite conversion.18The results of the measurements are shown in Fig. 2 along with the result of a running similar experiment but using a blank crystal. The black trace shows that the rate appears to decrease over time towards some steady state. The reason for the dropoff is not fully understood, but we speculate that it is caused by the topmost layers of the deposit being heated slightly over time due to infrared irradiance from the source. This lowers the sticking of the MAI and subsequently the observed rate. Comparing the red and the black traces it is clear that the addition of PbCl2 initially increases the sticking of the MAI. This makes sense as the PbCl2 should be reactive towards MAI, forming CH3NH3I(3−x)Clx, which means that it is energetically more favourable to stick to the PbCl2 surface as compared to the bare crystal or a pre-existing MAI layer. When the temperature of the QCM is increased the rate is seen to drop off much faster suggesting that all the PbCl2 is converted which due to the increased diffusion of reactant species would happen faster. However, an estimation of the amount of PbCl2 which has been converted into CH3NH3I(3−x)Clx from the amount of MAI that has been deposited, shows that a substantial amount of PbCl2 should still be left unconverted (see the ESI†). The more likely explanation therefore seems to be that the sticking of the MAI is much diminished by the hotter surface. This is supported by the fact that no rate can be observed when running the same experiment using a blank crystal without a PbCl2 layer (see Fig. 2 and S5†). Supporting this further is the fact that the cooled crystal with PbCl2 has a higher initial rate than when it is heated even though the starting surfaces are the same (compare red trace with the blue trace). In all the measurements it is evident that the rate does not go completely to zero when the shutter is closed. This is especially apparent in the experiments with the cooled QCM and during the first period with the shutter closed. The presence of a substantial background rate is likely caused by continuous evaporation of MAI from the walls of the chamber. The initially higher background rate, seen in the first shutter cycle, could be due to MAI sitting on the external surfaces of the source itself, which evaporates much faster than the MAI sitting on the chamber walls due to the higher temperature of the MAI source. This serves to “clean” the source of MAI causing the background rate to drop to what is delivered by the chamber.
To further examine the effect of substrate temperature we performed additional depositions with the QCM heated to 65 °C and 85 °C yielding the results shown in Fig. 3. The initial rates are observed to be more or less the same in all cases but the 85 °C rate is seen to drop of more rapidly while the 65 °C rate drops off marginally slower when comparing to the 75 °C rate. This supports the hypothesis that a too high substrate temperature is disadvantageous when considering MAI deposition isolated, as the rate is seen to drop off faster with increased temperature. Even post annealing a stack of PbCl2 and MAI might prove problematic as a significant part of the MAI is likely to reevaporate especially if the annealing is done under vacuum. An elevated sample temperature has, however, been reported to be paramount for ensuring good perovskite crystallization and one therefore needs a very high deposition flux to compensate for the fast desorption.10,18 In addition, the data in Fig. 3 (see also Fig. S6†) also supports that the samples are not “running out” of PbCl2 since if this were the case the total amount of deposited MAI, and thus the total frequency change, should be the same regardless of temperature. Instead a substantial difference in the terminal frequency is observed (Δf = −250 Hz, −360 Hz and −405 Hz for the 85 °C, 75 °C and 65 °C cases, respectively). From these measurements one can additionally make an estimation of the sticking coefficient, Sc, of the MAI by comparing the incoming flux suggested by the chamber pressure to the amount of material observed to stick. The calculations in the SI yield the results that Sc,85°C = 2.1 × 10⁻⁴, Sc,75°C = 3.0 × 10⁻⁴ and Sc,65°C = 3.4 × 10⁻⁴ which means that one can expect to loose a substantial amount of the evaporated MAI to pumping.
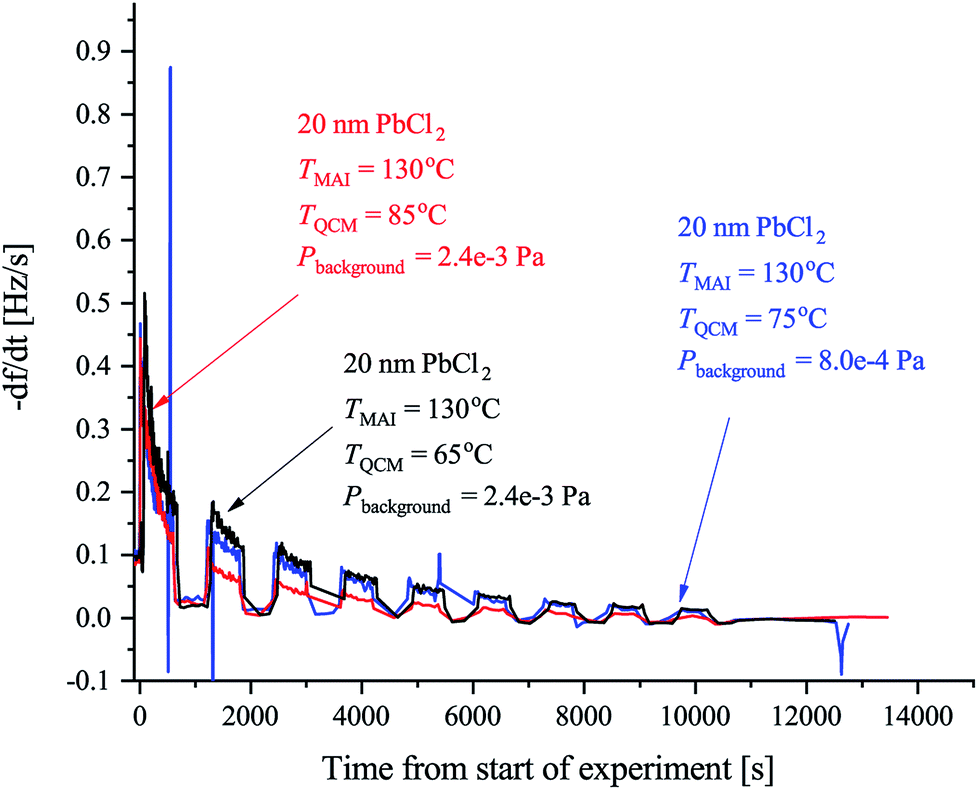 | ||
| Fig. 3 QCM experiments using the forward facing QCM in which the sensor was heated to 65 °C (black), 75 °C (blue) or 85 °C (red) where TMAI is the MAI source temperature, TQCM is the QCM temperature, Pbackgroud is the background pressure. In all cases the crystal had 20 nm of PbCl2 deposited on them and the signal was again chopped in 10 min intervals using the shutter on the MAI source. | ||
The final batch of experiments was conducted to elucidate the possible effect of the thickness of the PbCl2 layer on the deposition rate. To do so we performed the same type of measurements as before, but using a crystal with either 150 nm or 40 nm PbCl2 while keeping the QCM at 75 °C in both cases. The results are displayed in Fig. 4. It is evident that the initial rate is the same in all cases which is expected since the MAI being deposited sees the same surface. As the deposition progresses it, however, becomes clear that the rate saturates faster when a thinner PbCl2 film is used. The reason for this is not clear but a plausible explanation could be that the diffusion rate of MAI depends on the concentration of PbCl2 that is available for the MAI to react with. As reported by Chen et al.18 MAI is able to completely convert a 150 nm film of PbCl2 into perovskite which suggests that the MAI diffusion through the film is fast. This would mean that the MAI reacts throughout the PbCl2 film and consequently that the PbCl2 concentration in the thicker films will be higher for the same amount of deposited MAI. Supporting this hypotheses is the observation that the rate in the 40 nm PbCl2 experiment reaches that of the 20 nm PbCl2 experiment after twice as long deposition time.
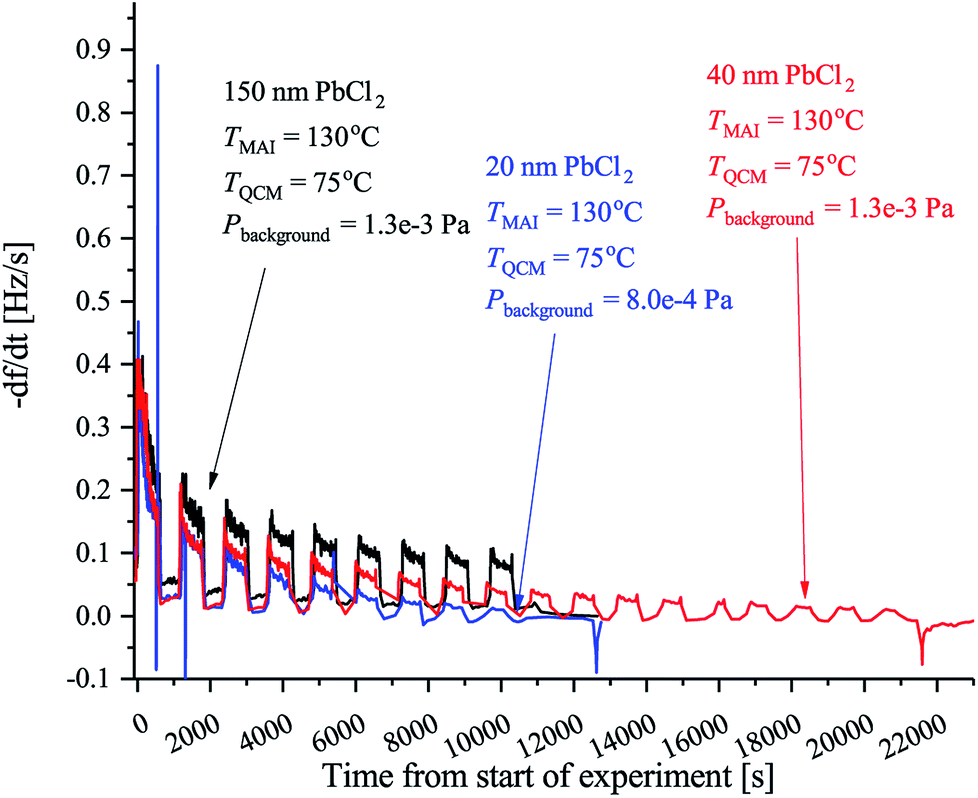 | ||
| Fig. 4 QCM experiments using the forward facing QCM in which the crystal was covered with either 20 nm (blue), 40 nm (red) or 150 nm of PbCl2 (black). Like previous TMAI is the MAI source temperature, TQCM is the QCM temperature, Pbackgroud is the background pressure. In all cases the rate was again chopped in 10 min intervals using the shutter on the MAI source. | ||
3.2 Mass spectrometry experiments
Having established that the sticking of MAI is generally very low and that depositing the compound on a substrate held at elevated temperatures as a result is difficult we turn to mass spectrometry on pure MAI to explain what is causing this phenomenon. In Fig. 5 the mass scans from 0–200 AMU e−1 with an MAI source temperature of 130 °C and ionization energies of either 35 eV or 14 eV are shown. Comparing the 35 eV plot with its background it is clear that many new peaks appear while some pre-existing peaks grow substantially. The most important peaks are summarised in Table 1 along with the most likely compounds they are associated with. The strong presence of CH3, CH3N, CH3NH, CH3NH2, I and HI suggest that the MAI thermally decomposes into its components upon evaporation in vacuum which is further supported by the fact that no signal is detected at m/z = 159 where the parent compound should be. From the data it is not immediately clear whether or not NH3 or CH3NH3 is produced as their m/z signal coincide with those of OH− (coming from H2O) and O2, respectively. Closer examination of the peaks reveals that 4 peaks rather than 2 are observed, namely, at m/z = 16.98 (OH−), 17.00 (NH3), 31.97 (O2) and 32.04 (CH3NH3) which suggests that all four compounds are present (see Fig. S7 and S8† for details). Comparing the peak locations to the expected ones (m/z = 17.01, 17.03, 32.00 and 32.07 for OH+, NH3, O2 and CH3NH3, respectively) it is clear that the m/z axis is shifted slightly but also that the spacing between the peaks are as expected. The slight shift can be explained by drift in the m/z axis which happens over time and since the MAI spectrum was recorded after the calibration file such a shift is reasonable. Though NH3 is observed the N2 signal is seen to drastically increase when evaporating MAI which suggests that a large part of the N from the MAI forms molecular nitrogen rather than NH3 at the used temperatures. In addition to the intense peaks mentioned above several other substantial peaks are observed at m/z = 63.4, 64, 129, 142 and 150. The first two of these are most likely double charged I and HI which should be located at 63.5 AMU e−1 and 64 AMU e−1, respectively. The peak at m/z = 142 most likely originates from CH3I while the last two are believed to be some compound containing C, N and H and potentially I as well. The peaks that are present in the background spectrum but not in the MAI measurements are believed to be species that are pumped away between the recording of the background spectrum and the MAI spectrum as the later was recorded after the former. As always, when one is doing mass spectrometry, cracking of the analyte into fragments due to the ionization process is an important consideration and comparing the plots for 35 eV ionization with those for 14 eV ionization (which is very gentle and should suppress the cracking process) there are indeed some differences worthy of attention. | ||
| Fig. 5 Semi-log mass scans for MAI evaporated at 130 °C recorded using an ionization energy, Ei, of 35 eV or 14 eV. (a) Shows the m/z = 0–100 spectra while m/z = 100–200 spectra are shown in (b). The counts axis starts from 10 counts as everything below that is designated as noise. | ||
| m/z | Compound | Likely parent molecule |
|---|---|---|
| 15 | CH3+ | CH3NH2 fragment |
| 16 | O+, CH4+ | O2 fragment, CH3NH2 fragment |
| 17 | NH3+, OH+ | CH3NH2fragment, H2O fragment |
| 18 | H2O+ | H2O parent peak |
| 27 | CHN+ | CH3NH2 fragment |
| 28 | N2+ | CH3NH2 fragment |
| 29 | CH3N+ | CH3NH2 fragment |
| 30 | CH3NH+ | CH3NH2 fragment |
| 31 | CH3NH2+ | CH3NH2 parent peak |
| 32 | O2+, CH3NH3+ | O2 parent peak, CH3NH3I fragment |
| 127 | I+ | HI fragment |
| 128 | HI+ | HI parent peak |
| 159 | CH3NH3I+ | CH3NH3I parent peak |
The 14 eV spectrum features substantially fewer peaks, which can partially be explained by the fact that the ionization cross sections of many of the compounds are very low at this gentle ionization energy.20 This is clearly exemplified by the fact that the background spectrum measured at 14 eV only shows 3 peaks at m/z = 18, 28 and 32. In the green spectrum in Fig. 5a, which shows the 14 eV ionization data, only three major peaks appear, namely, at m/z = 30, 31 and 32, along with a very small peak at m/z = 28. No peak at m/z = 18 is, however, observed and comparing to the background the peak at 28 AMU e−1 is seen to be drastically less intense. The explanation for this is again most likely that the background scan was done some time before the MAI scan which means that the H2O and the N2 has been evacuated. The fact that the peak at m/z = 32 is amplified substantially as compared to the background spectrum recorded under identical instrument settings strongly suggests that at least some of the peak at m/z = 32 should be attributed to CH3NH3 rather than O2. This is supported by the fact that only one peak, coinciding with the one attributed to CH3NH3, is observed upon closer inspection (see Fig. S8†). The indication from the experiments is thus that MAI is thermally decomposed into CH3NH3, CH3NH2, CH3NH and N2 fragments. Comparing the ratio of the peaks at m/z = 30 and 31 for the 14 eV and 35 eV spectra it is seen that the dominating peak shifts from CH3NH2 to CH3NH as the ionization energy is increased. This increasing loss of hydrogen from the fragment with increasing ionization energy is expected and shows some ionization fracturing is indeed taking place – something which can also be concluded when examining Fig. 5b. Here the peaks at m/z = 127 and 128 corresponding to I and HI and once more the dominating peak is seen to switch from the heavier compound to the dehydrogenated compound as the ionization energy is increased.
In order to minimize ionization cracking an ionization energy of 14 eV was used to study the effects of MAI evaporation temperature. From Fig. 6a and b it is clear that up until 130 °C temperature has no other apparent effect than to control the magnitude of the peak height. This is of course expected as a higher evaporation rate is obtained by increasing the source temperature, but it is important to note that the degree of thermal decomposition is not dependent on temperature in the 100–130 °C range. MAI appears to simply evaporate dissociatively as fragments as there is still no signal at m/z = 159 where the parent compound should be. In the m/z = 200–300 range only tiny peaks located at m/z = 275 and m/z = 254 are present in the 100 °C and 130 °C spectra as shown in Fig. 6c. By consulting the NIST database21 the m/z = 275 can be associated with C8H20IO2− which appears to be thermally decomposing before 110 °C as it does not show up in either of the elevated temperature spectra. The peak at 254 AMU e−1 can be attributed to I2 and the explanation for why it is lacking in the two remaining spectra is most likely that the rates are not high enough for the peaks to emerge from the noise floor. In the final subfigure of Fig. 6 another interesting feature appears in the 100 °C spectrum, namely the presence of a, albeit tiny, peak at 317.72 AMU e−1. This is very close to the expected location of the MAI dimer, (CH3NH3I)2, which should be located at 317.94 AMU e−1 and the discrepancy of 0.2 AMU e−1 can again be explained with drift in the magnet calibration. The lack of the dimer in the 110 °C and 130 °C spectra suggests that it is not very thermally stable something which is supported by the fact that its observed intensity is minuscule compared to those of CH3NH2 and HI. The minor peaks of Fig. 5 and 6 are summarized in Table 2 while the full m/z = 200–300 and 300–400 range plots are shown in Fig. S9 and S10.†
 | ||
| Fig. 6 Semi-log or linear plots showing the mass spectrometry data obtained using an ionization energy of 14 eV at an MAI source temperature of either 100 °C, 110 °C or 130 °C. (a) Shows the data in the 0–100 m/z range, (b) in the 100–200 m/z range, (c) in the 250–280 m/z range and (d) in the 317.6–318 m/z range. The counts axis again starts from 10 which defines the noise floor. | ||
| m/z | Compound | Likely parent molecule |
|---|---|---|
| 44 | C2H6N+ | CH3NH3I fragment |
| 45 | C2H7N+ | CH3NH3I fragment |
| 63.4 | I2+ | HI fragment |
| 64 | HI2+ | HI parent peak |
| 129 | C, H, N, I compound | CH3NH3I fragment |
| 142 | CH3I+ | CH3I parent peak |
| 150 | C, H, N, I compound | CH3NH3I fragment |
| 254 | I2+ | I2 parent peak |
| 317.7 | (CH3NH3I)2+ | (CH3NH3I)2 parent peak |
To further study the effects of the evaporation temperature mass scans were measured using temperatures of up to 380 °C while again employing an ionization energy of 14 eV. The significant peaks (>500 counts) of the resultant intensity plots are shown in Fig. 7a and b. No significant peaks were found outside the m/z ranges indicated in the plots (m/z = 14–48 and 125–145) as seen in Fig. S11 and S12† where the full m/z = 0–100 and 100–200 range spectra are shown. Initially peaks at m/z = 28, 29, 30, 31, 127 and 128 are clearly observed which is in good agreement with what was found previously. As temperature increases these peaks become more intense and especially the peak at m/z = 127 is seen to be drastically elevated. This suggests that HI thermally decomposes into I and H at 160 °C as the signals are seen to be equally strong. Due to detector saturation at 65![[thin space (1/6-em)]](https://www.rsc.org/images/entities/char_2009.gif) 000 counts it is not clear whether or not HI or I is the dominant species at these temperatures. At around 160 °C several additional peaks located at m/z = 15, 32, 129, 142 as well as very faint peaks at m/z = 17, 18, 44 and 45, appear. The explanation for the appearance of the new peaks is to some degree the increased evaporation rate that one expect with increased temperatures. This is most likely the case with the m/z = 32 peak which also appear in the more zoomed plots in Fig. 6a and b. In case of the remaining peaks another factor might, however, come in to play, namely thermal fracturing of the CH3NH2. As previously found when comparing the 14 eV and the 35 eV spectra m/z = 142 and 15 are observed in the later case which suggests that CH3NH2 suffers from increased ionization decomposition when using the higher ionization energy. Considering this observation, together with what was observed in literature, it thus seem likely that CH3 and CH3I are predominately formed from CH3NH2 and HI decomposition products originating from either thermal or ionization fracturing.15,16 This could also be the explanation for the peaks at m/z = 44 and 45 which are attributed to C2H6N and C2H7N, respectively. Increased thermal decomposition is, however, less likely to be the cause for the increase in m/z = 32 as CH3NH3 fractures into CH3NH2 and one would thus expect a decreasing presence of CH3NH3 as the temperature increases. At 240 °C all the peaks are seen to be severely diminished which strongly suggests that the supply of MAI ran out. This hypotheses is supported by the fact that the chamber pressure was observed to drop from 2.0 × 10⁻⁴ Pa to 5.0 × 10⁻⁵ Pa. In addition the Al sample container appeared empty when it was visually inspected after the experiment. Finally the fact that the MAI ran out agrees well with our experience from CH3NH3PbI(3−x)Clx fabrication in a PVD set up where several grams of MAI was found to be expended in an hour at this evaporation temperature. The additional peaks observed in the experiment are again shown in Table 2.
000 counts it is not clear whether or not HI or I is the dominant species at these temperatures. At around 160 °C several additional peaks located at m/z = 15, 32, 129, 142 as well as very faint peaks at m/z = 17, 18, 44 and 45, appear. The explanation for the appearance of the new peaks is to some degree the increased evaporation rate that one expect with increased temperatures. This is most likely the case with the m/z = 32 peak which also appear in the more zoomed plots in Fig. 6a and b. In case of the remaining peaks another factor might, however, come in to play, namely thermal fracturing of the CH3NH2. As previously found when comparing the 14 eV and the 35 eV spectra m/z = 142 and 15 are observed in the later case which suggests that CH3NH2 suffers from increased ionization decomposition when using the higher ionization energy. Considering this observation, together with what was observed in literature, it thus seem likely that CH3 and CH3I are predominately formed from CH3NH2 and HI decomposition products originating from either thermal or ionization fracturing.15,16 This could also be the explanation for the peaks at m/z = 44 and 45 which are attributed to C2H6N and C2H7N, respectively. Increased thermal decomposition is, however, less likely to be the cause for the increase in m/z = 32 as CH3NH3 fractures into CH3NH2 and one would thus expect a decreasing presence of CH3NH3 as the temperature increases. At 240 °C all the peaks are seen to be severely diminished which strongly suggests that the supply of MAI ran out. This hypotheses is supported by the fact that the chamber pressure was observed to drop from 2.0 × 10⁻⁴ Pa to 5.0 × 10⁻⁵ Pa. In addition the Al sample container appeared empty when it was visually inspected after the experiment. Finally the fact that the MAI ran out agrees well with our experience from CH3NH3PbI(3−x)Clx fabrication in a PVD set up where several grams of MAI was found to be expended in an hour at this evaporation temperature. The additional peaks observed in the experiment are again shown in Table 2.
 | ||
| Fig. 7 Intensity plots showing the significant peaks (>500 counts) of the mass scans of MAI as a function of temperature. The measurements were done using an ionization energy of 14 eV. (a) Shows the m/z = 14–48 spectra while m/z = 125–145 is shown in (b). The full m/z = 0–100 and 100–200 spectra are shown in Fig. S11 and S12,† respectively. | ||
From the mass spectrometry data we can conclude that MAI does not actually evaporate as a compound, but dissociatively as mainly CH3NH2 and HI when using a source temperature of 130 °C. The only “MAI-like” compound which is observed is a very small amount of the MAI-dimer when using lower evaporation temperatures. Taking this into account offers an explanation as to why one needs high MAI evaporation pressures for successful perovskite deposition: no MAI arrives at the sample and therefore, both a HI and a CH3NH2 molecule need to be present at the same time and place on the surface of the PbCl2. This means that the conversion probability becomes much smaller and that the net rate is more likely to scale with the square of the chamber pressure rather than linearly with the direct flux like regular evaporative PVD. This issue naturally becomes substantially worse as one starts to heat the substrate since the vapour pressure of both compounds will increase significantly with temperature. An alternative explanation is that all the HI and CH3NH2 goes to waste and that only the MAI-dimer reacts with the PbCl2, but this scenario is also rather problematic as the amount of dimer evaporated is, first of all, very low, but also because it requires that the dimer dissociate on the surface before it reevaporates. With this in mind it is clear that one needs to think carefully when designing an MAI evaporation chamber as the high deposition pressure needed is contradictory to common PVD design guidelines. Rather than having a big chamber which is pumped at a high pumping speed it appears to be much better to reduce both pumping speed and chamber dimensions, to minimize the waste of the evaporated MAI. Due to these facts MAI might be better suited for a CVD, rather than a PVD, process which has also been demonstrated to be a viable deposition strategy in literature.11 Taking this line of thought a bit further one could imagine using HI and CH3NH2 as precursors rather than MAI which has the benefit that one avoids synthesis and storage of the notoriously moisture sensitive MAI. Whether or not this is feasible is, however, unclear and a study would need to be performed to provide clarification on the matter.
3.3 Discussion
As mentioned in the introduction other groups have performed mass spectrometry on MAI and upon comparing the results obtained here with these some similarities, but also some discrepancies, emerge. Nenon et al.16 use thermogravimetric analysis coupled with temperature programmed XRD and mass spectrometry to gauge the stability of various perovskite species and their precursors. At a temperature of 110 °C they observe small amounts of m/z = 15, 17, 18, 26, 27, 28, 29 and 31 which are indicative of CH3NH2 evaporation and agrees well with what was observed here. Additionally they observe peaks in the 42–48 AMU e−1 range some of which are present in our experiments but not in large quantities before 200 °C. As the temperature increases they observe an increase in peak intensity which is in good agreement with what one would expect, namely, that the evaporation rate is increased. At temperatures above 170 °C the intensity of the peaks related to CH3 and NH3 increase strongly in magnitude while that of CH3NH2 is observed to disappear. This suggests that CH3NH2 fractures completely above this temperature. The increased amount of observed CH3 fits well with our measurements though we never observe the disappearance of the parent peak, CH3NH2. From their collective results they additionally conclude that MAI begins to evaporate from CH3NH3PbI(3−x)Clx at around 100 °C which again agrees well whith what we have observed. Juarez-Perez et al.15 likewise perform thermogravimetric analysis coupled with mass spectrometry and additionally show first principle calculation to analyse the exhaust gas of thermally decomposing CH3NH3PbI3. Like Nenon et al.16 they go from room temperature up to 400 °C but use a mass spectrometer with a wider mass range enabling them to measure up to 200 AMU e−1. This allows them to observe both I, CH3I, NH3 and CH3 evaporating off MAI at around 300 °C. They conclude that MAI is thermally cracked primarily into CH3I and NH3 which agrees with what was observed by Nenon et al.16 at temperatures above 170 °C given that Nenon et al.16 did not measure masses above 100 AMU e−1. Considering this information together with the results obtained here, it suggests that MAI evaporates mainly as CH3NH3I and HI at lower temperatures but shifts cracking pattern towards CH3I and NH3 at temperatures above 170 °C. In contrast to what was observed here and by Nenon et al.16 Juarez-Perez et al.15 do not measure any significant peaks at lower temperatures which means that they do not observe this shift in their experiments. They do, however, mix their sample with an alumina powder for their TGA experiments and use a carrier gas (He) to transport the evaporants to their mass spectrometer. Both the alumina matrix and the He will likely slow the diffusion of the decomposition gasses away from their sample holder. Their experimental approach is thus different from ours and the one employed by Nenon et al.16 which is likely the cause for the discrepancies. The high temperature regime is not immediately relevant for MAI deposition as the frequently used evaporation temperatures are, as mentioned earlier, somewhat lower than 170 °C in most cases. It is, however, very useful in the case of perovskite degradation as it provide insight into what one could expect from a high temperature annealing which is routinely used when depositing protection layers like TiO2.224 Conclusion
We can conclude that MAI suffers from a very low sticking coefficient which results in low deposition rates under typical PVD chamber pressures. Furthermore the majority of the observed deposition rate is indirect which has the consequence that MAI goes everywhere in the deposition chamber. This means that a direct line of sight from the source to the target is not needed – something which is otherwise paramount in PVD chambers. The initial MAI sticking can be improved by providing a film of PbCl2 for it to land on and subsequently react with. When heating the target containing the PbCl2 film to regular substrate temperatures the observed rate is, however, much diminished as the vapour pressure of the MAI is increased. By varying the PbCl2 film thickness we can conclude that the rate saturates faster the thinner the film. This phenomenon can be explained by the diffusion rate being PbCl2 concentration dependent with the result that the diffusion rate of the thicker films is higher. From the QCM results we can conclude that high MAI pressures are needed for the diffusion rate of the MAI, through the forming perovskite film, to outweigh its desorption rate especially if the target is held at elevated temperatures. The mass spectrometry explains the underlying cause for this behaviour as the MAI is observed not to evaporate as a compound but rather dissociatively (primarily as HI and CH3NH2) or in small amounts as an MAI-dimer ((CH3NH3I)2). When making perovskite films, this has the consequence that both CH3NH2 and HI need to be present at the same time in order for PbCl2 to be converted into perovskite which lowers the reaction probability. One therefore needs relatively high pressures of the two species in order for the incoming flux to surpass the simultaneous re-desorption and allow for proper conversion to the perovskite. These results provide fundamental insight into the nature of MAI evaporation and should be taken into account when designing an MAI vacuum deposition chamber since parameters such as pumping speed and chamber dimensions needs to be more like those of a CVD system as opposed to those of a typical PVD system.Conflicts of interest
There are no conflicts of interest to declare.Acknowledgements
This work was supported by a research grant (DFF-4005-00463) from Danmarks Frie Forskningsfond and by a research grant (9455) from VILLUM FONDEN.References
- J.-P. Correa-Baena, A. Abate, M. Saliba, W. Tress, T. Jesper Jacobsson, M. Grätzel and A. Hagfeldt, Energy Environ. Sci., 2017, 10, 710–727 RSC.
- S. Y. Hsiao, H. L. Lin, W. H. Lee, W. L. Tsai, K. M. Chiang, W. Y. Liao, C. Z. Ren-Wu, C. Y. Chen and H. W. Lin, Adv. Mater., 2016, 28, 7013–7019 CrossRef PubMed.
- H. Chen, F. Ye, W. Tang, J. He, M. Yin, Y. Wang, F. Xie, E. Bi, X. Yang, M. Grätzel and L. Han, Nature, 2017, 550, 92–95 Search PubMed.
- X. Li, D. Bi, C. Yi, J. Luo, S. M. Zakeeruddin and A. Hagfeldt, Science, 2016, 353, 58–62 CrossRef PubMed.
- D. Yang, Z. Yang, W. Qin, Y. Zhang, S. F. Liu and C. Li, J. Mater. Chem. A, 2015, 3, 9401–9405 RSC.
- Q. Lin, A. Armin, R. C. R. Nagiri, P. L. Burn and P. Meredith, Nat. Photonics, 2015, 9, 106–112 CrossRef.
- C. Momblona, L. Gil-Escrig, E. Bandiello, E. M. Hutter, M. Sessolo, K. Lederer, J. Blochwitz-Nimoth and H. J. Bolink, Energy Environ. Sci., 2016, 9, 3456–3463 RSC.
- S. Olthof and K. Meerholz, Sci. Rep., 2017, 7, 1–10 CrossRef PubMed.
- L. K. Ono, M. R. Leyden, S. Wang and Y. Qi, J. Mater. Chem. A, 2016, 4, 6693–6713 RSC.
- Y. Li, J. K. Cooper, R. Buonsanti, C. Giannini, Y. Liu, F. M. Toma and I. D. Sharp, J. Phys. Chem. Lett., 2015, 6, 493–499 CrossRef PubMed.
- J. Yin, H. Qu, J. Cao, H. Tai, J. Li and N. Zheng, J. Mater. Chem. A, 2016, 4, 13203–13210 RSC.
- D. Pérez-del Rey, P. P. Boix, M. Sessolo, A. Hadipour and H. J. Bolink, J. Phys. Chem. Lett., 2018, 9, 1041–1046 CrossRef PubMed.
- L. K. Ono, S. Wang, Y. Kato, S. R. Raga and Y. Qi, Energy Environ. Sci., 2014, 7, 3989–3993 RSC.
- J. Teuscher, A. Ulianov, O. Müntener, M. Grätzel and N. Tétreault, ChemSusChem, 2015, 8, 3847–3852 CrossRef PubMed.
- E. J. Juarez-Perez, Z. Hawash, S. R. Raga, L. K. Ono and Y. Qi, Energy Environ. Sci., 2016, 9, 3406–3410 RSC.
- D. P. Nenon, J. A. Christians, L. M. Wheeler, J. L. Blackburn, E. M. Sanehira, B. Dou, M. L. Olsen, K. Zhu, J. J. Berry and J. M. Luther, Energy Environ. Sci., 2016, 9, 2072–2082 RSC.
- M. Liu, M. B. Johnston and H. J. Snaith, Nature, 2013, 501, 395–398 CrossRef PubMed.
- C. W. Chen, H. W. Kang, S. Y. Hsiao, P. F. Yang, K. M. Chiang and H. W. Lin, Adv. Mater., 2014, 26, 6647–6652 CrossRef PubMed.
- G. Sauerbrey, Z. Phys., 1959, 155, 206–222 CrossRef.
- Y.-K. Kim, K. Irikura, M. Rudd, M. Ali, P. Stone, J. Chang, J. Coursey, R. Dragoset, A. Kishore, K. Olsen, A. Sansonetti, G. Wiersma, D. Zucker and M. Zucker, Electron-Impact Cross Sections for Ionization and Excitation Database, 2017, https://physics.nist.gov/PhysRefData/Ionization/molTable.html Search PubMed.
- NIST Mass Spec Data Center and S. Stein, Mass Spectra in NIST Chemistry WebBook, NIST Standard Reference Database Number 69, ed. P. J.Linstrom and W. G.Mallard, National Institute of Standards and Technology, Gaithersburg MD, 2017, p. 20899, DOI:10.18434/T4D303, http://webbook.nist.gov/chemistry/.
- B. Seger, T. Pedersen, A. B. Laursen, P. C. K. Vesborg, O. Hansen and I. Chorkendorff, J. Am. Chem. Soc., 2013, 135, 1057–1064 CrossRef PubMed.
Footnote |
| † Electronic supplementary information (ESI) available. See DOI: 10.1039/c8ra04851g |
| This journal is © The Royal Society of Chemistry 2018 |