
 Open Access Article
 This Open Access Article is licensed under a Creative Commons Attribution-Non Commercial 3.0 Unported Licence
Critical conditions for the formation of p-type ZnO with Li doping
Mingge Jin ab,
Zhibing Lia,
Feng Huangb,
Yu Xiaa,
Xu Jib and
Weiliang Wang*a
ab,
Zhibing Lia,
Feng Huangb,
Yu Xiaa,
Xu Jib and
Weiliang Wang*a
aState Key Laboratory of Optoelectronic Materials and Technologies, School of Physics, Guangdong Province Key Laboratory of Display Material and Technology, Sun Yat-sen University, Guangzhou 510275, People's Republic of China. E-mail: wangwl2@mail.sysu.edu.cn
bState Key Laboratory of Optoelectronic Materials and Technologies, School of Materials, Sun Yat-sen University, Guangzhou, 510275, People's Republic of China
First published on 3rd September 2018
Abstract
The stability of Li dopants in ZnO is studied via first-principles calculations with electric dipole correction. The formation energies of substitutional Li (LiZn), interstitial Li (Lii) and the LiZn + Lii complex are calculated in large supercells and the results are extrapolated to the limit of an infinite-sized supercell. The stabilities of 2LiZn and the LiZn + Lii complex are found to depend on the temperature and absolute oxygen partial pressure. At normal experimental temperature (900 K), an extremely high absolute oxygen partial pressure (194 bar) is needed to break the coupling between LiZn and Lii and thus form p-type ZnO. The reaction barrier and the absorbance spectra are also discussed.
1 Introduction
ZnO is considered as a promising candidate for high-efficiency UV electroluminescence at room temperature due to its large exciton binding energy (60 meV) and wide band gap (3.37 eV).1,2 The well-known bottleneck for the electroluminescence of ZnO is obtaining stable p-type ZnO with a high carrier concentration (HCC).3Since 2000, in order to obtain the desired p-type ZnO, via creating shallow acceptors, with a concentration higher than that of the total donors, doping Li has become one of the major efforts. It was demonstrated that Li substituting Zn (LiZn) could work as a shallow acceptor with an activation energy of 0.09 eV.4,5 Theoretically, if LiZn possessed sufficiently large-concentration shallow acceptors (larger than the total donors created by other uncontrollable factors), the desired p-type ZnO stable at room temperature would be achieved. However, in experiment, Li doped p-type HCC-ZnO is still far from success.6–9 It was found that interstitial Li (Lii) is always formed with a concentration commensurate to that of LiZn during the doping process. As we know, Lii, acting as a shallow donor, will compensate acceptor LiZn and finally form I-type ZnO.10,11 Actually, the simultaneous concentration increase of two defects (LiZn and Lii) with different formation energies is an abnormal thermodynamic phenomenon, which implies that LiZn and Lii may be correlated and act as an integrated defect in ZnO. In awareness of the above fact, researchers11–13 had begun to study the stability of LiZn, Lii and the LiZn + Lii defect complex under different thermodynamic conditions using first-principles calculations. The common agreement was, in most normal thermodynamic conditions, that the Lii + LiZn defect complex was more stable than the single defects LiZn and Lii. The argument was whether the relative stability of the LiZn + Lii defect complex and LiZn would change with the variation of oxygen chemical potential. According to R. Vidya et al.,12 the oxygen chemical potential is dependent on the percentage of the oxygen partial pressure. They showed that LiZn + Lii transformed into 2LiZn when the oxygen partial pressure is 80% of the total pressure, leading to p-type ZnO. However, their result is inconsistent with the experiments. In fact, the chemical potential of oxygen in thermodynamic equilibrium is not dependent on the percentage of the partial pressure, but on the absolute partial pressure as well as temperature. The dependence on pressure and temperature has never been studied in previous researches. To study this, we focus on the absolute partial pressure, instead of the percentage.
In this work, based on the density functional theory (DFT) calculations, the formation energies of LiZn, Lii and LiZn + Lii defect complex at different temperature and absolute oxygen partial pressure are calculated in large supercells. The electric dipole correction and the limit of infinite-sized supercell are considered. The results show that the stability of 2LiZn and LiZn + Lii defect complex depends on the temperature and absolute oxygen partial pressure. Furthermore, it is indicated that at normal experimental temperature (900 K), an extremely high absolute oxygen partial pressure (194 bar) is needed to break the coupling between LiZn and Lii, for the formation of p-type ZnO. Our conclusion is much consistent with experiments,14 suggesting that Li-doped p-type ZnO might be realized by annealing samples under positive oxygen partial pressure. Our study also reveals that long-range electrostatic interactions between different dopants will decisively influence the thermodynamically stable conditions of Li defects in ZnO, which implies that the supercell size effect should be fully considered in the future theoretical work.
2 Theory and computational details
The DFT calculations are performed by Vienna Ab initio Simulation Package (VASP)15–17 using the projector augmented-wave (PAW) method.18 Periodic boundary condition is applied. Different Li dopants in wurtzite ZnO (w-ZnO) are considered: Li atoms substitute Zn atoms (LiZn), Li atoms occupy octahedral interstitial sites (Liocti) or tetrahedral site (Liteti), LiZn + Liocti and LiZn + Liteti (Fig. 1). All atoms are fully relaxed until all forces acting on atoms are smaller than 0.01 eV Å−1. The Perdew–Burke–Ernzerhof (PBE)19 generalized gradient approximation (GGA) functional is used for the exchange correlation potential. The cut-off energy for the plane-wave expansion is 400 eV. For the Brillouin zone integration, we use a 3 × 3 × 3 k-point Monkhorst–Pack mesh for 3 × 3 × 2, 4 × 4 × 2 and 4 × 4 × 3 supercells, and a Γ-point calculation for 4 × 4 × 4 and 6 × 6 × 4 supercells. We have calculated the energies for denser k-points mesh and find that the energy differences are less than 0.001 eV, which indicates the meshes are dense enough.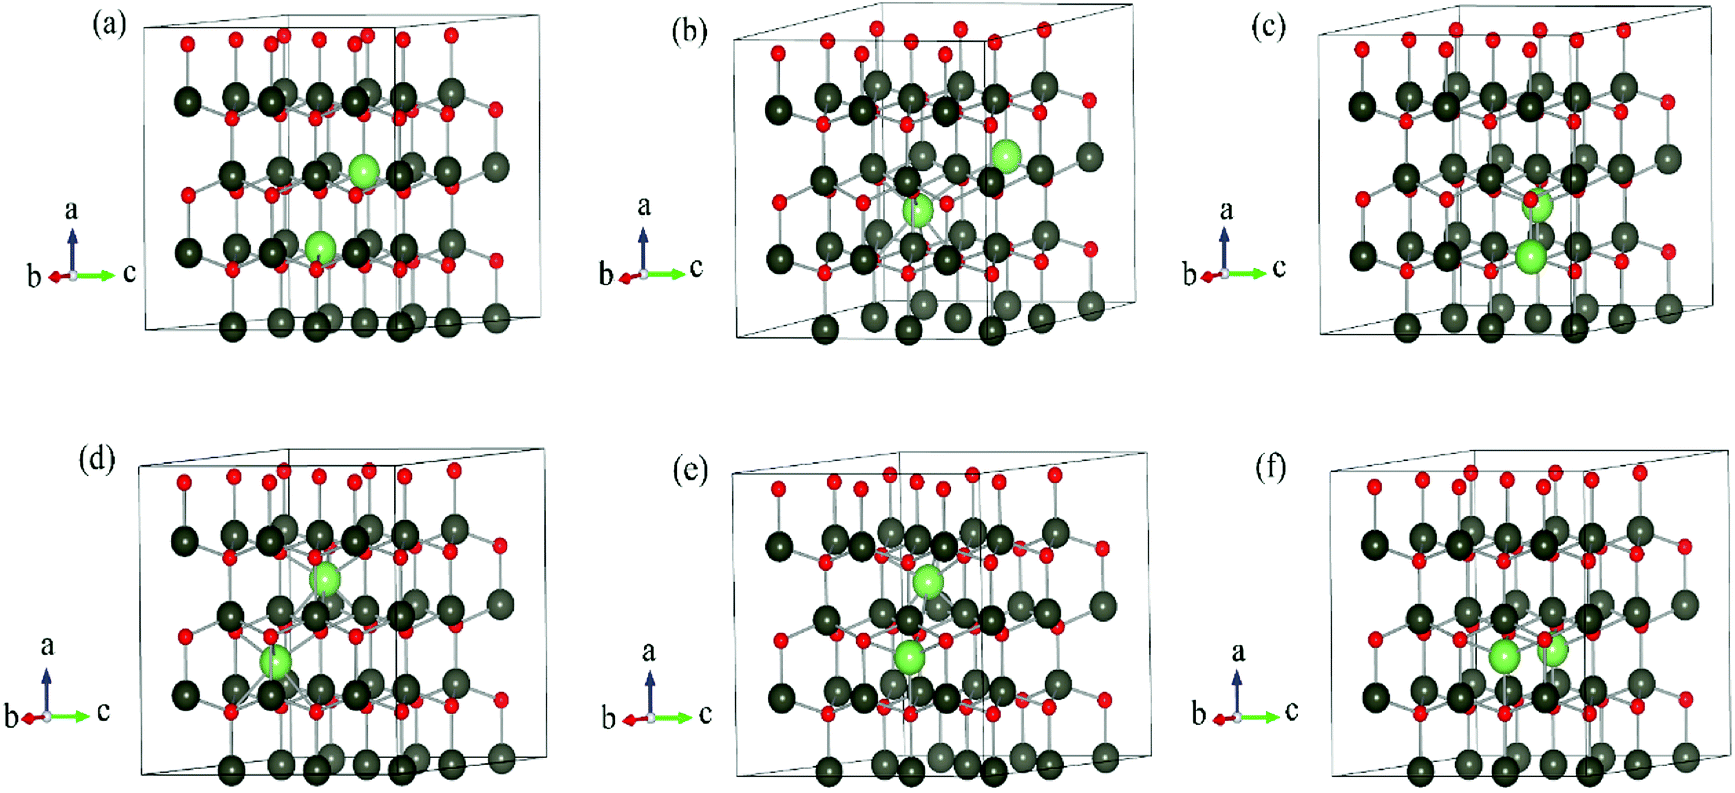 | ||
| Fig. 1 Schematic illustration of 3 × 3 × 2 supercells of w-ZnO: (a) 2LiZn, (b) LiZn + Liocti, (c) LiZn + Liteti, (d) 2Liocti, (e) Liocti + Liteti and (f) 2Liteti. The grey, red and green balls represent Zn, O and Li atoms, respectively. | ||
The transition state calculation is done by Nudged Elastic Band (NEB) method20 in 3 × 3 × 2 supercell. The climbing method is applied.21 The absorbance spectra are also calculated with 3 × 3 × 2 supercell.
2.1 Dopant formation energy
The formation energy of LiZn or Lii is:22| Ef = Edt − Ept + nZn[EZn + μZn(T,p)] − nLi[ELi + μLi(T,p)], | (1) |
Chemical potential of Zn is determined by that of O2 and ZnO
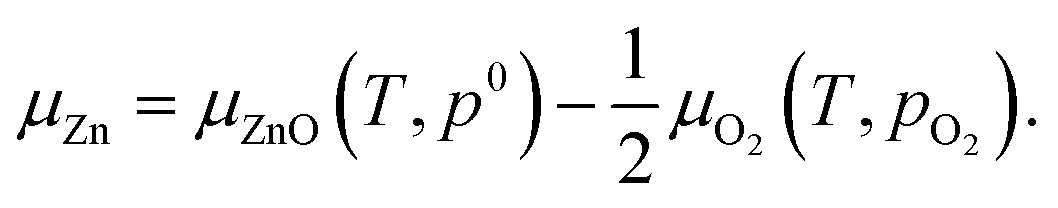 | (2) |
The chemical potentials of gaseous O2 is given by
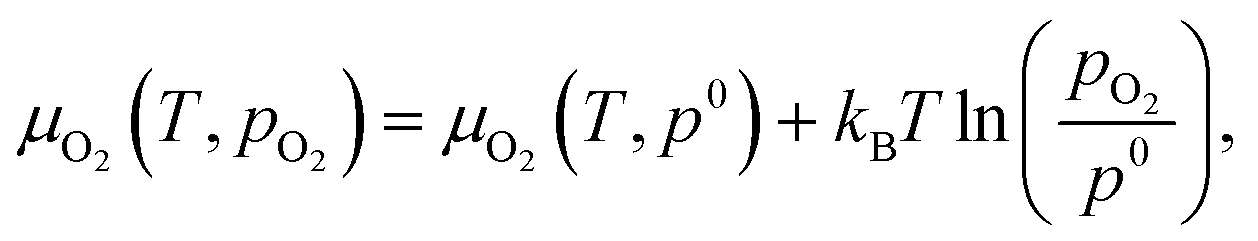 | (3) |
There is a charge-state term qEf in eqn (1) according to some literatures (e.g. ref. 12 and 26). It is wrong to include the charge-state term in calculation of bulk ZnO. The reasons are shown below.
(1) The Fermi level is not a tunable parameter in ZnO growth experiments, as determined by the density of states and total number of electrons, unless when studying chemical reactions on electrode (e.g. ref. 27). It is not a common practice to put an electrode into the reaction chamber when doping ZnO at high oxygen pressure and high temperature. Therefore, experimentalists are actually not able to tune the Fermi level during the growth of ZnO.
(2) It is not wise to simulate charge-state in crystal in periodic boundary condition, as the total charge in the supercell should be zero in such situation. VASP (the software ref. 12 and 26 and our work used) assumes a homogeneous positive background-charge when an extra electron is put into the supercell. This would introduce artificial error.
(3) The extra electron in the supercell may not be bound near the impurity to form “charge-state”, when an extra electron is put into the supercell and vice versa.
2.2 Electric dipole correction
Since the total energies are calculated with periodic boundary condition, artificial long-range electrostatic interactions between the periodic defect images should be subtracted. By introducing the electric dipole correction,28,29 the artificial effect can be mostly eliminated. The interaction energy between two electric dipole moments is given by
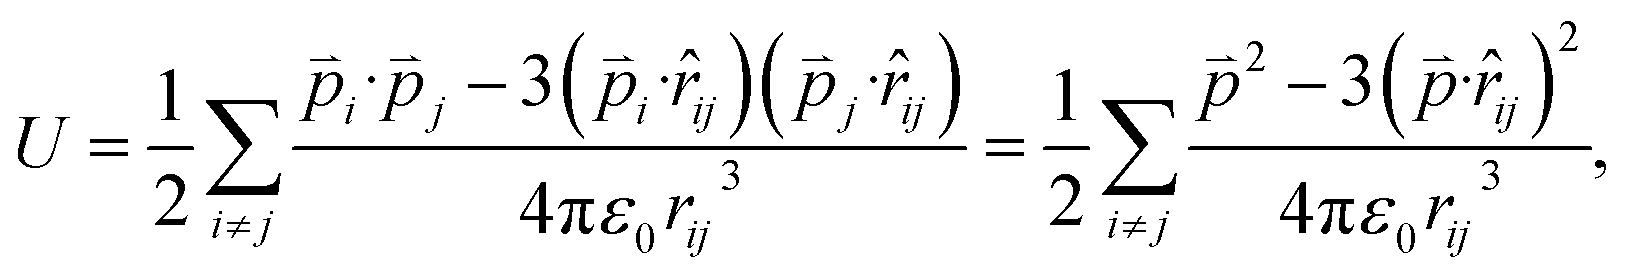 | (4) |
![[r with combining circumflex]](https://www.rsc.org/images/entities/i_char_0072_0302.gif) ij =
ij = ![[r with combining right harpoon above (vector)]](https://www.rsc.org/images/entities/i_char_0072_20d1.gif) /r is the unit vector pointing from dipole i to dipole j, ε0 is the dielectric constant of vacuum, and
/r is the unit vector pointing from dipole i to dipole j, ε0 is the dielectric constant of vacuum, and ![[p with combining right harpoon above (vector)]](https://www.rsc.org/images/entities/i_char_0070_20d1.gif) i is the electric dipole moment in the i-th supercell. The electric dipoles in each supercell are the same (periodic boundary condition), denoted by .
i is the electric dipole moment in the i-th supercell. The electric dipoles in each supercell are the same (periodic boundary condition), denoted by .
3 Results and discussion
3.1 Formation energy vs. supercell size
We have calculated the energy of each dopant with 3 × 3 × 2, 4 × 4 × 2, 4 × 4 × 3, 4 × 4 × 4 and 6 × 6 × 4 supercells. The corresponding atom numbers for undoped ZnO in these supercells are 72, 128, 192, 256 and 576 respectively. The dopant concentrations for two Li atoms doping in these supercells are 2.78 at%, 1.55 at%, 1.04 at%, 0.78 at% and 0.35 at% respectively.Among those interstitial sites shown in Fig. 1d–f, Li prefers to occupy the octahedral interstitial site (Liocti) at which it forms six bonds with neighboring atoms. Four different cases of Li doping configurations: (i) 2LiZn, (ii) LiZn + Liocti, (iii) LiZn + Liteti and (iv) 2Liocti are considered. Two dopants locating at the nearest (N) sites and separating from each other (S) are considered for each of these configurations. The formation energies of these configurations are shown in Fig. 2 as functions of Li doping concentration at 0 K (i.e. μZn = μLi = 0).
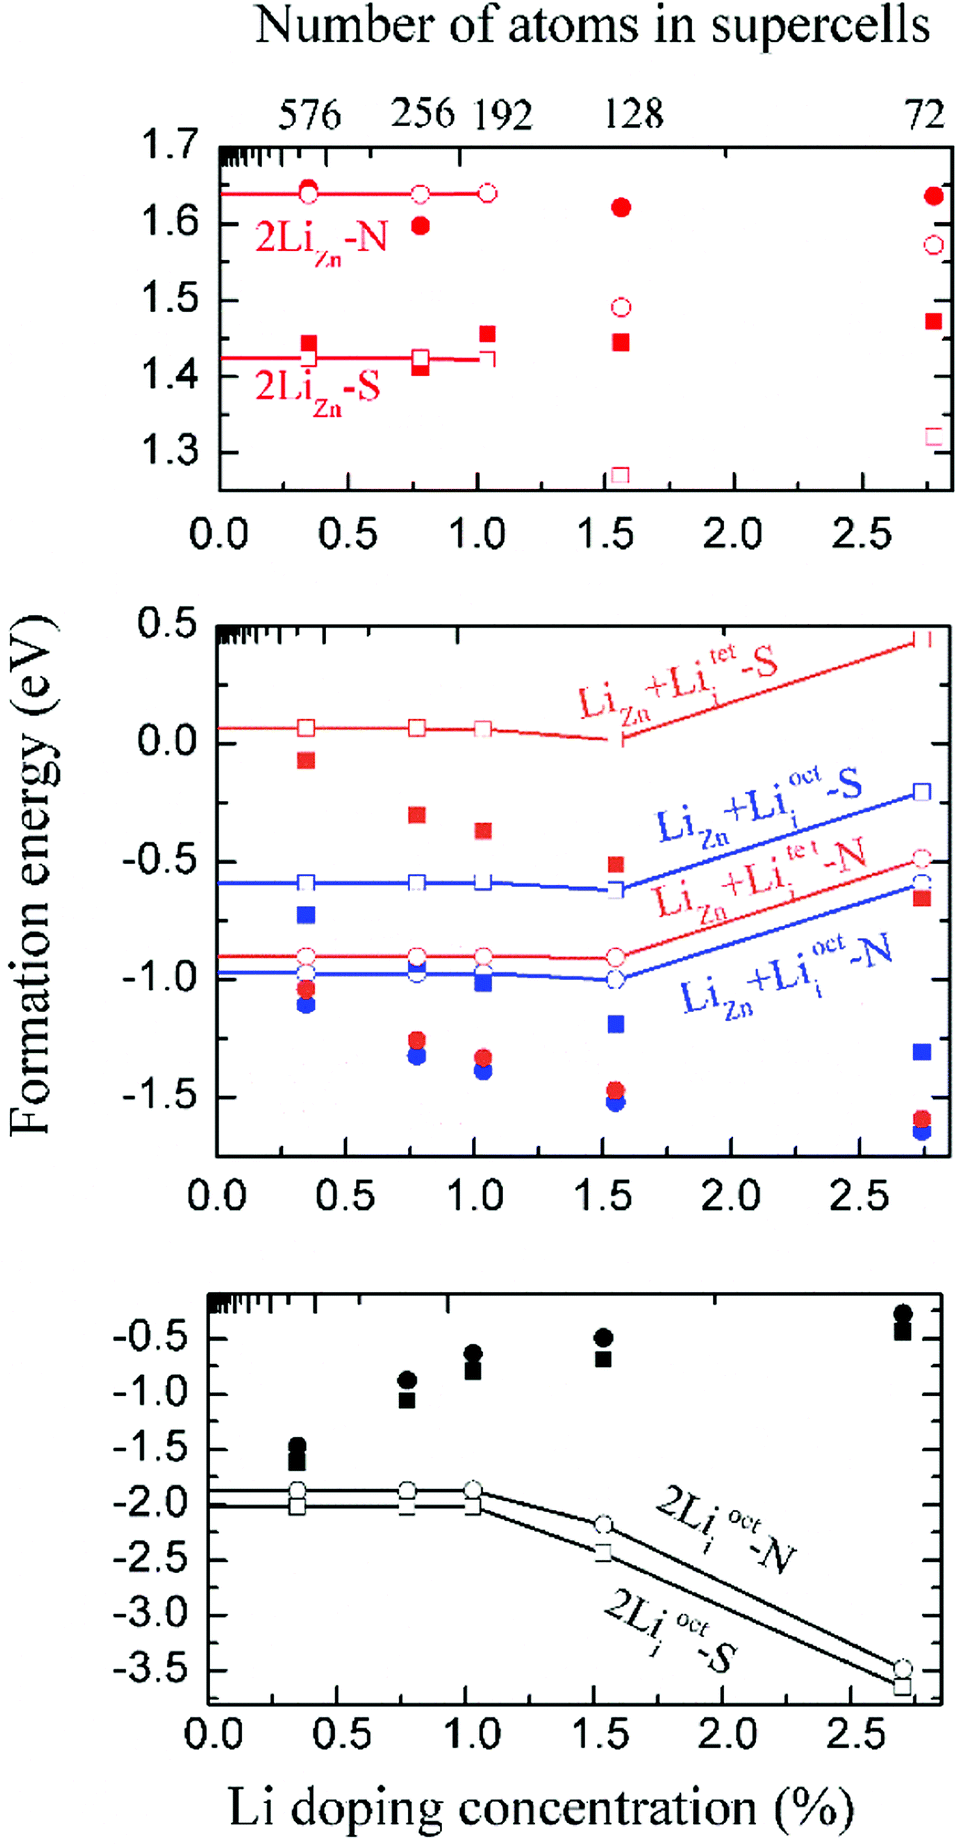 | ||
| Fig. 2 Formation energies without (filled) and with (open) dipole correction of (i) 2LiZn (red), (ii) LiZn + Liocti (blue), (iii) LiZn + Liteti (orange) and (iv) 2Liocti (black) in ZnO when the temperature is 0 K (i.e. μZn = μLi = 0). N and S indicate two dopants locating at the nearest sites and separating from each other, respectively. | ||
The formation energies converge very slowly in regard to decreasing Li doping concentration (increasing supercell size) due to the large electric dipole moments induced by the dopants. Therefore, we apply the dipole correction to remove the artificial long-range electrostatic interactions between different dopants. The formation energies with dipole correction converge to constant in low Li concentration (open symbols in Fig. 2). As shown in Fig. 2, Li atoms in 2LiZn and 2Liocti prefer S configuration, while the Li atoms in LiZn + Lii pair prefer N configuration.
3.2 Formation energy vs. absolute oxygen partial pressure (with dipole correction)
As 2LiZn is the only case of p-type doping among our investigated various dopants, it is essential to find out the chemical environment for 2LiZn to be the most stable one. The relative stability of different Li doping configurations is determined by the growth temperature and absolute oxygen partial pressure. This is illustrated in Fig. 3, where we show the formation energies of the three most stable configurations.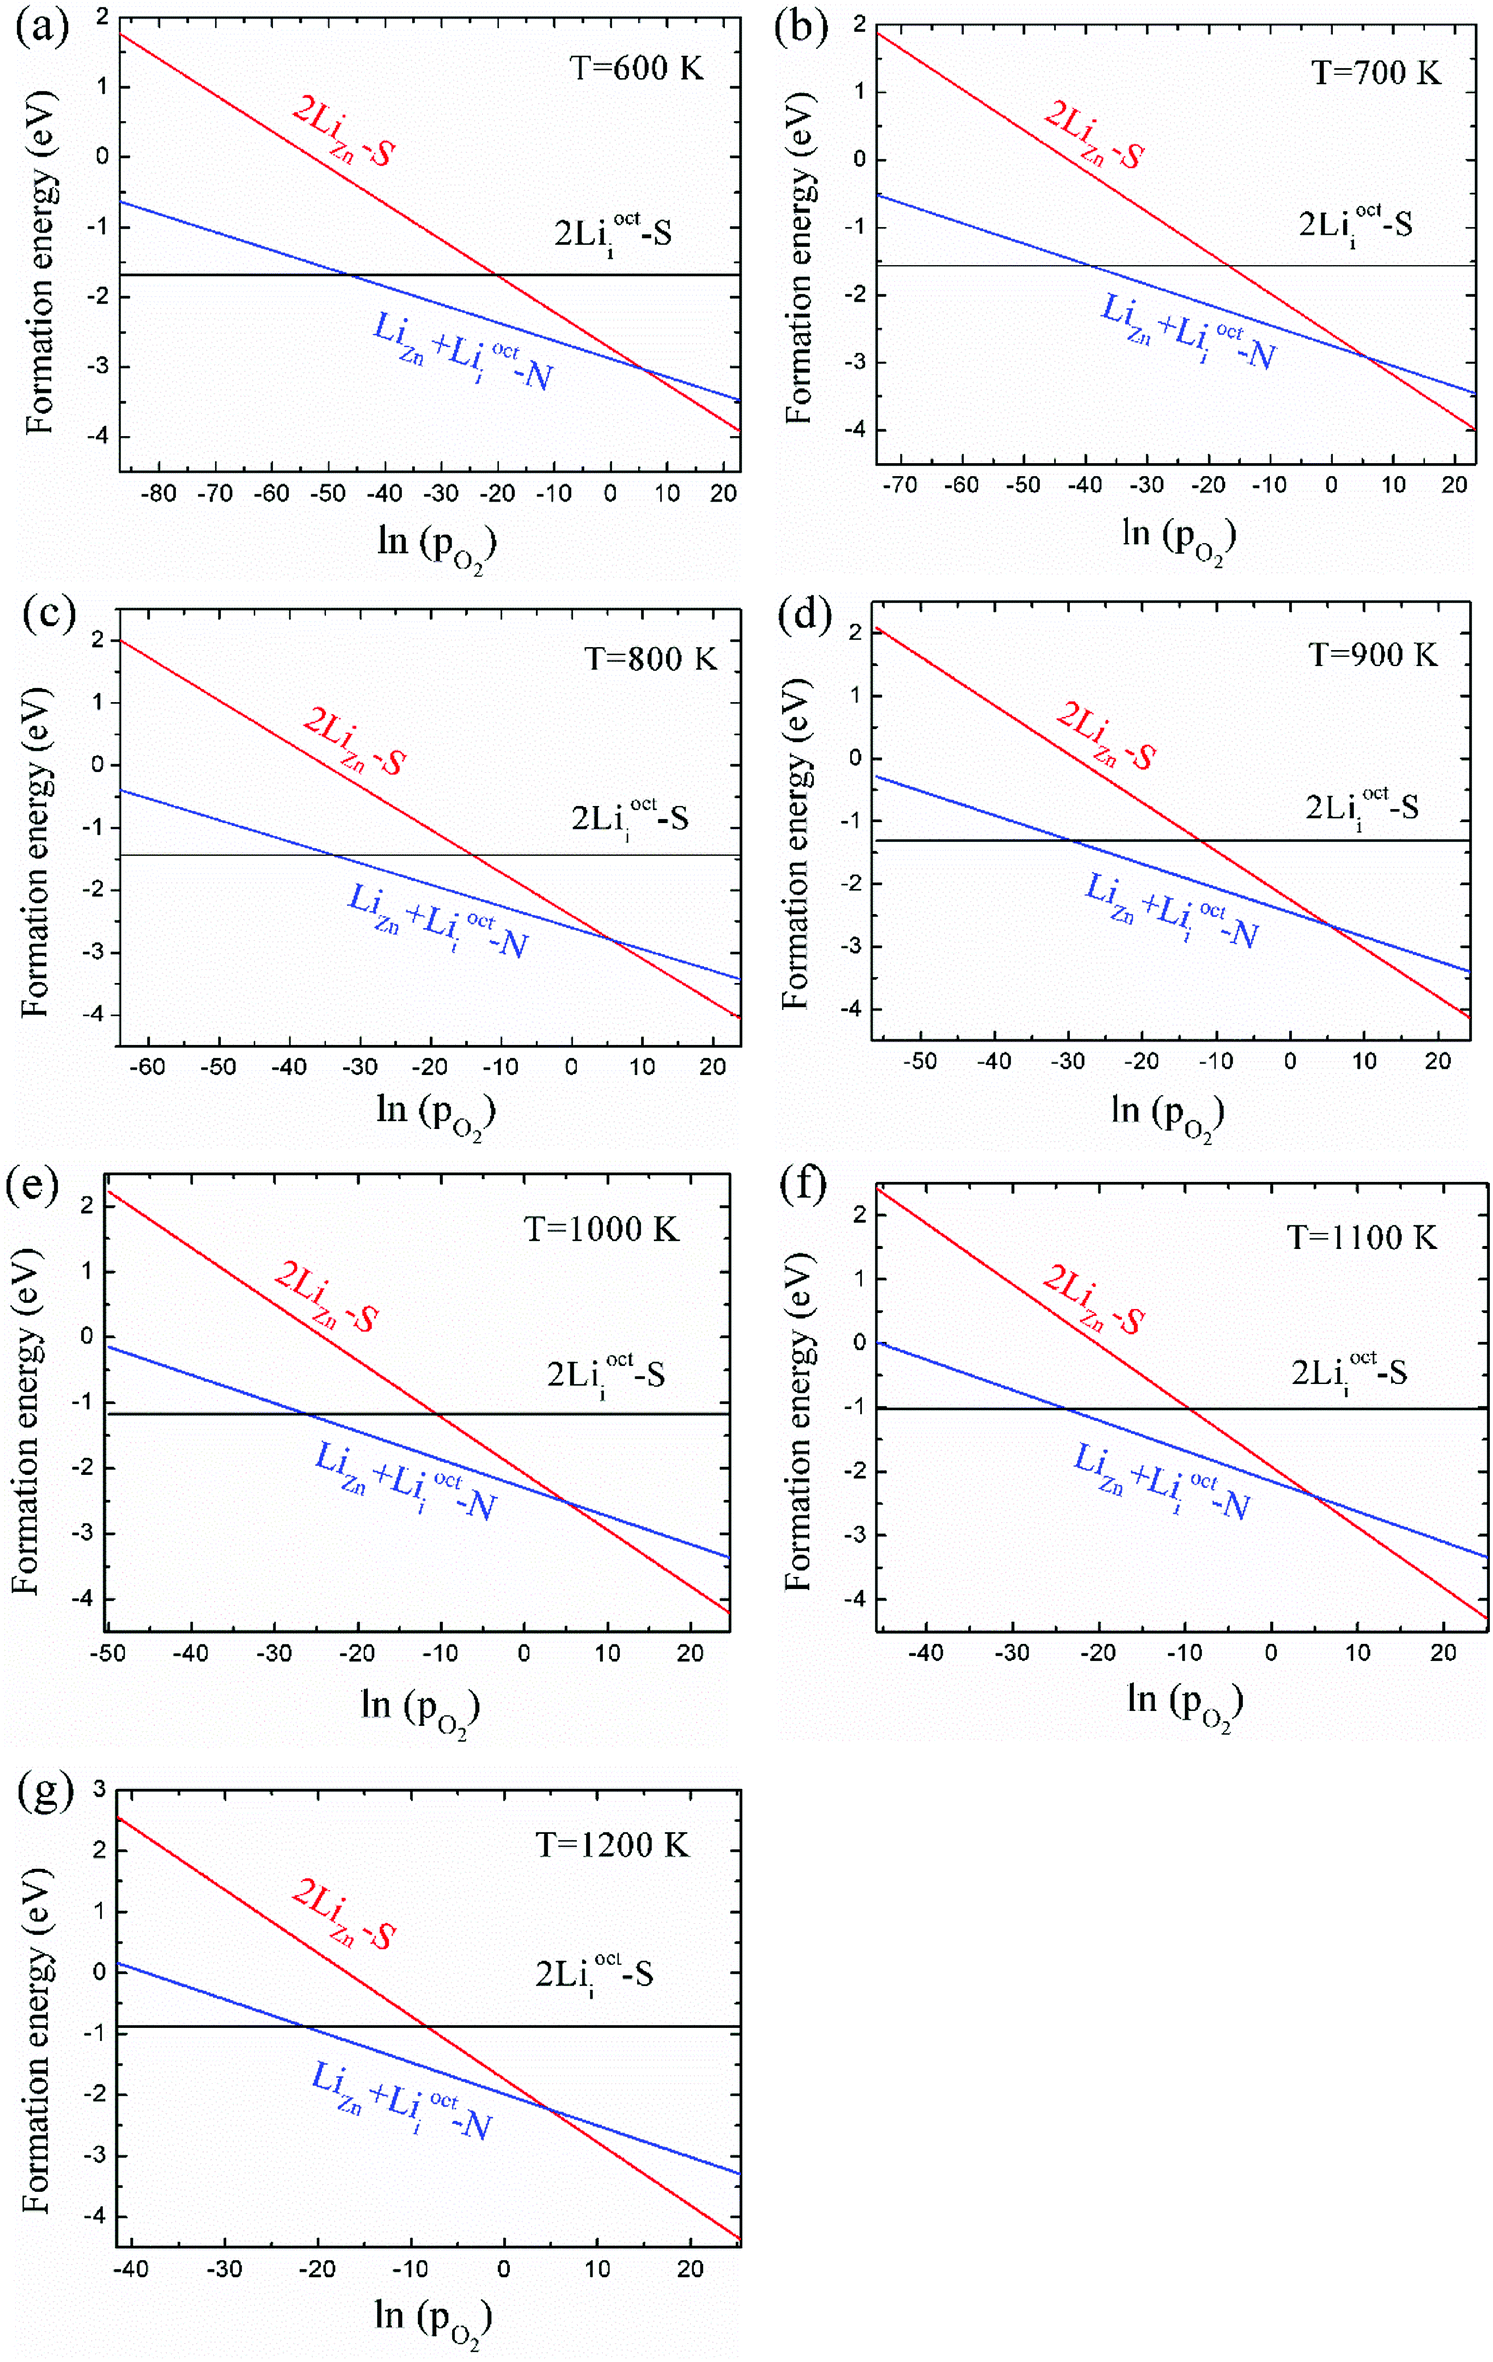 | ||
| Fig. 3 Formation energies of the three most stable configurations as the function of absolute oxygen partial pressure pO2 (unit: bar) at different temperatures. The dependence on oxygen chemical potential has been converted into the absolute oxygen partial pressure dependence at given temperature. | ||
As shown in Fig. 3, Li dopant will be mainly in interstitial form at low absolute oxygen partial pressure. The compensating LiZn + Lii pair is always the most stable configuration near the standard pressure (pO2 = 1 bar), which implies that LiZn + Lii is stable for most of the growth condition (at a moderate pO2). The configuration 2LiZn forms at high pO2.
Critical absolute oxygen partial pressure pO2(1) and pO2(2) for alternating the stability of the three configurations are listed in Table 1. pO2(1) (pO2(2)) corresponds to the crossover points of the black lines and blue lines (blue lines and red lines) in Fig. 3. It can be seen that the minimum of oxygen partial pressure (pO2(2)) required for 2LiZn being the most stable defect decreases with increasing temperature. On the other hand, the maximum of oxygen partial pressure (pO2(1)) allowed for 2Lii being the most stable defect increases with increasing temperature. Phase diagram of the three configurations is shown in Fig. 4.
| T (K) | μZnO (eV) | μO2(T,p0) (eV) | pO2(1) (bar) | pO2(2) (bar) |
|---|---|---|---|---|
| 600 | −0.245 | −1.296 | 6.25 × 10⁻²¹ | 319.402 |
| 700 | −0.324 | −1.492 | 8.95 × 10⁻¹⁸ | 260.962 |
| 800 | −0.411 | −1.711 | 2.37 × 10⁻¹⁵ | 254.947 |
| 900 | −0.503 | −1.923 | 1.41 × 10⁻¹³ | 194.368 |
| 1000 | −0.602 | −2.152 | 3.95 × 10⁻¹² | 166.831 |
| 1100 | −0.705 | −2.376 | 5.12 × 10⁻¹¹ | 124.633 |
| 1200 | −0.814 | −2.625 | 5.05 × 10⁻¹⁰ | 114.18 |
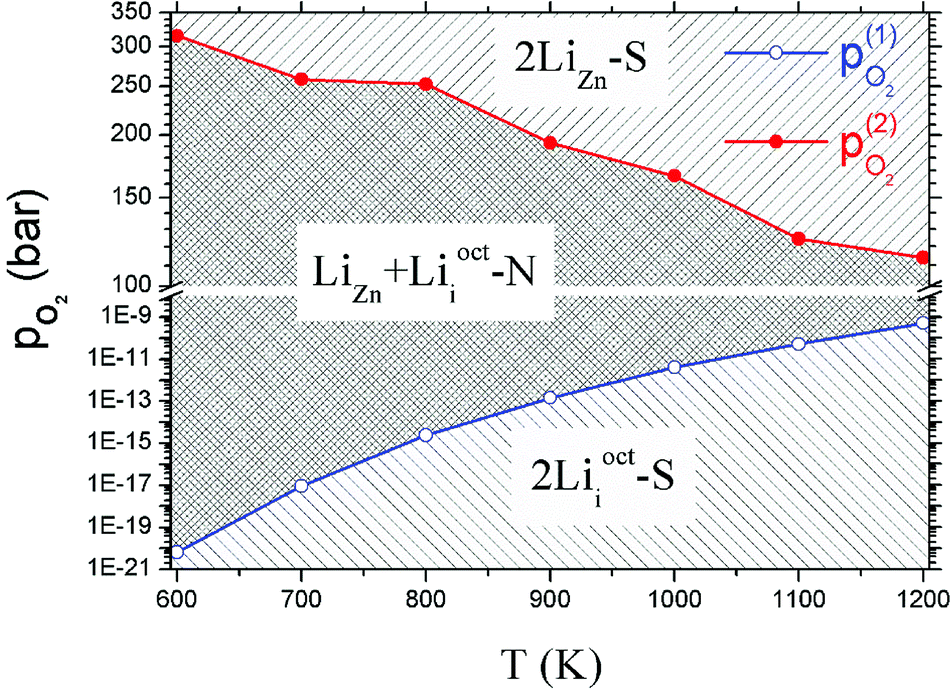 | ||
| Fig. 4 Phase diagram of Li doped ZnO. The blue dots and red dots indicate the values of pO2(1) and pO2(2) at different temperatures. The most stable defect in the region above the red line is 2LiZn-S, between the red line and blue line is LiZn + Liocti-N, and below the blue line is 2Liocti-S. | ||
3.3 Formation energy vs. absolute oxygen partial pressure (without dipole correction)
In this section, we show the results without dipole correction for comparison with Table 2 and Fig. 5. It can be seen that the critical absolute oxygen partial pressure pO2(1) and pO2(2) for alternating the stability of the three configurations are changed one to three orders of magnitude by the dipole correction. Therefore, it is essential to apply the dipole correction.| T (K) | pO2(1) (bar) | pO2(2) (bar) |
|---|---|---|
| 600 | 7.20 × 10⁻³⁰ | 1.05 × 10⁵ |
| 700 | 1.95 × 10⁻²⁵ | 3.74 × 10⁴ |
| 800 | 4.69 × 10⁻²² | 1.97 × 10⁴ |
| 900 | 1.55 × 10⁻¹⁹ | 9.25 × 10³ |
| 1000 | 1.71 × 10⁻¹⁷ | 5.40 × 10³ |
| 1100 | 6.82 × 10⁻¹⁶ | 2.94 × 10³ |
| 1200 | 1.71 × 10⁻¹⁴ | 2.07 × 10³ |
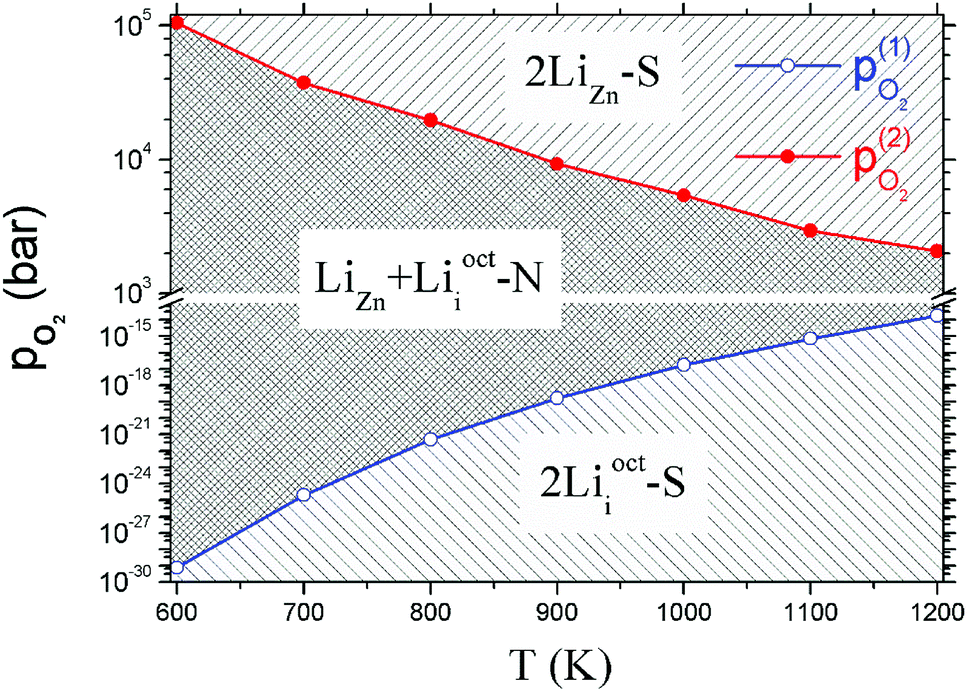 | ||
| Fig. 5 The same as Fig. 4 but without dipole correction. | ||
3.4 Reaction barrier
The reaction barrier of LiZn + Lii → 2LiZn + Zn is 2.5 eV (Fig. 6). Therefore LiZn + Lii is easy to transform into 2LiZn + Zn when the temperature is 900 K. Although the reaction barrier of the reverse reaction 2LiZn + Zn → LiZn + Lii is even lower (1.1 eV), this reverse reaction will be blocked after the sample is annealed in high oxygen which eliminates the extra Zn.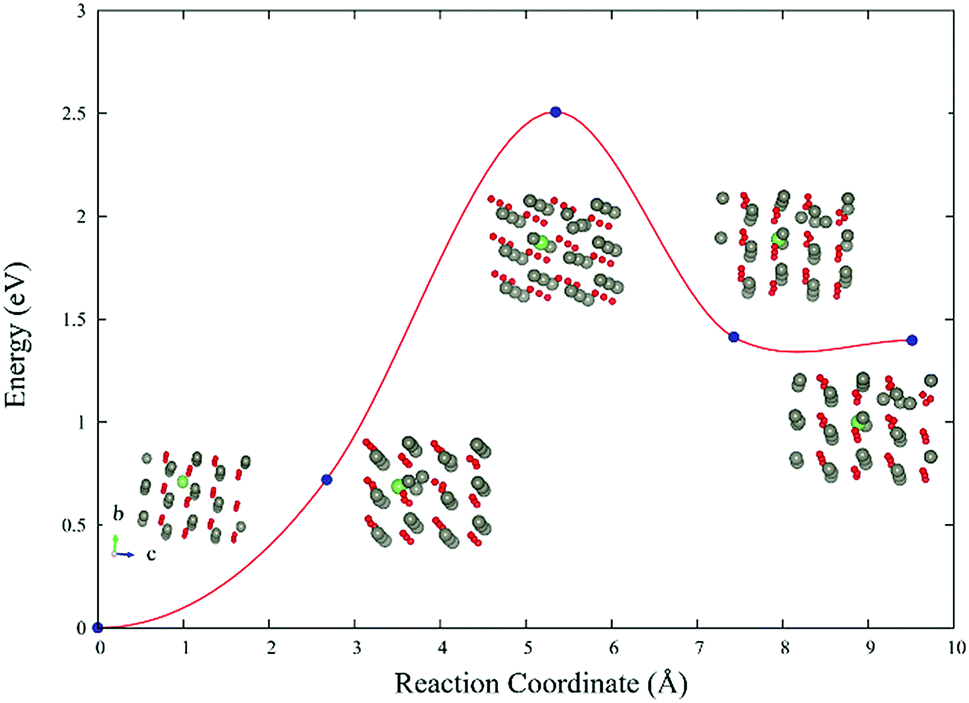 | ||
| Fig. 6 Reaction barrier of LiZn + Lii → 2LiZn + Zn. | ||
3.5 Spectroscopic properties
We calculated the absorbance spectra of Li-doped ZnO. The bottom of conduction band is filled with electrons in Li-doped ZnO with Lii configuration (n-type) (Fig. 7e). The electrons can not hop to the bottom of conduction band and have to hop to higher energy levels instead. Therefore, there is blue shift in absorbance spectrum (Fig. 7b) of n-type ZnO due to the band-filling effect. The top of valence band is empty in Li-doped ZnO with LiZn configuration (p-type) (Fig. 7f). There is red shift in absorbance spectrum (Fig. 7c) of p-type ZnO due to the internal hopping in the valence band. Our calculation results can not explain the blue shift in the absorbance spectra of N-doped ZnO if it is p-type.30 The experimental results in ref. 30 demands more detailed theoretical investigation.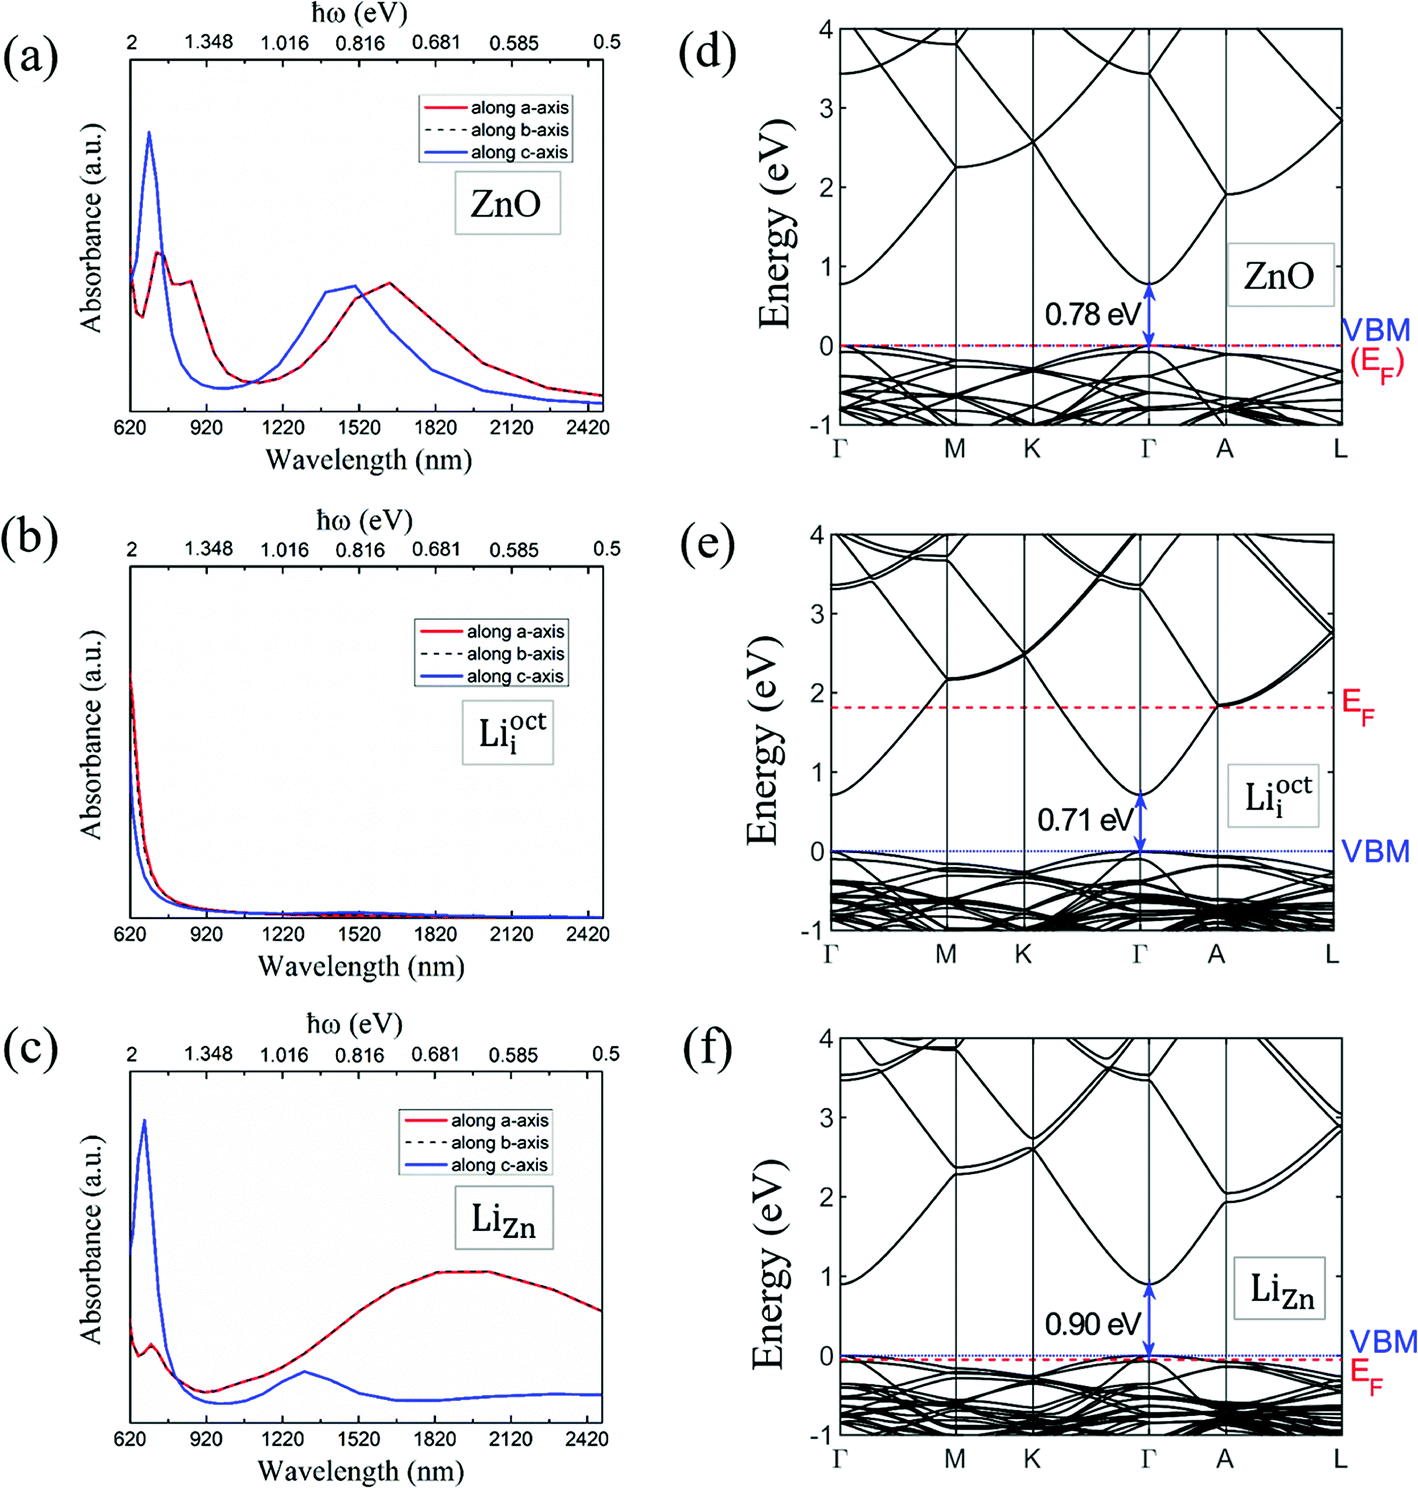 | ||
| Fig. 7 Absorbance spectrum of (a) pure ZnO and Li-doped ZnO with (b) Lii configuration and (c) LiZn configuration. The polarizations of light in a, b and c directions are considered. Band structure of (d) pure ZnO and Li-doped ZnO with (e) Lii configuration and (f) LiZn configuration. | ||
4 Conclusions
First-principles calculations have been performed to study the formation energies of Li dopants in ZnO at different temperature and absolute oxygen partial pressure. Four different Li dopant configurations have been investigated in large supercell containing up to 576 atoms with electric dipole correction. It is found that the formation energy for defect complexes (LiZn + Liocti N-pair and LiZn + Liocti S-pair) is not converged until the supercell is larger than 4 × 4 × 3.The stability of 2LiZn and LiZn + Lii complex depends on the temperature and absolute oxygen partial pressure. At low temperature, we find that Li dopant will be mainly in the compensating LiZn + Lii form. At the normal experimental temperature (900 K), an extremely high absolute oxygen partial pressure (194 bar) is needed to break the coupling between LiZn and Lii and form the p-type 2LiZn. This result is in very good agreement with recent experiments,14 suggesting that Li-doped p-type ZnO might be realized by annealing samples under positive oxygen partial pressure, which can not be achieved in MOCVD and MBE with negative pressure. This explains why good p-type ZnO can not be synthesized before.
Our study also reveal that long-range electrostatic interactions between different dopants will decisively influence the thermodynamical stability of Li dopants in ZnO, which implies that the supercell size effect should be fully considered in the future theoretical work.
The reaction barrier of LiZn + Lii → 2LiZn + Zn is 2.5 eV, which is easy for LiZn + Lii to transform into 2LiZn + Zn when the temperature is 900 K. There is blue shift in absorbance spectrum of n-type ZnO due to the band-filling effect; there is red shift in absorbance spectrum of p-type ZnO due to the internal hopping in the valence band.
Author contributions
M. J. performed all the first-principles calculations with the help from Y. X. and W. W., while Z. L. provided the idea of dipole correction. F. H. and X. J. proposed the topic of Li doped ZnO. M. J., F. H. and W. W. wrote the introduction. M. J. and W. W. analyzed the results and wrote the other part of the paper. Y. X. and X. J. participated in final correction of the manuscript. All authors read and approved the final manuscript.Conflicts of interest
There are no conflicts to declare.Acknowledgements
The project was supported by the National Basic Research Program of China (Grant No. 2013CB933601), the National R&D Key Plan Project of China (2016YFA0202000), National Natural Science Foundation of China (Grant No. 11604391), Special Program for Applied Research on Super Computation of the NSFC-Guangdong Joint Fund (the second phase) and the high-performance grid computing platform of Sun Yat-sen University.References
- Ü. Özgür, Y. I. Alivov, C. Liu, A. Teke, M. Reshchikov, S. Doğan, V. Avrutin, S.-J. Cho and H. Morkoc, J. Appl. Phys., 2005, 98, 11 CrossRef.
- J. C. Fan, K. Sreekanth, Z. Xie, S. Chang and K. V. Rao, Prog. Mater. Sci., 2013, 58, 874–985 CrossRef.
- V. Avrutin, D. J. Silversmith and H. Morkoç, Proc. IEEE, 2010, 98, 1269–1280 Search PubMed.
- C. Park, S. Zhang and S.-H. Wei, Phys. Rev. B: Condens. Matter Mater. Phys., 2002, 66, 073202 CrossRef.
- E.-C. Lee and K. Chang, Phys. Rev. B: Condens. Matter Mater. Phys., 2004, 70, 115210 CrossRef.
- J. Lu, Y. Zhang, Z. Ye, Y. Zeng, H. He, L. Zhu, J. Huang, L. Wang, J. Yuan and B. Zhao, Appl. Phys. Lett., 2006, 89, 112113 CrossRef.
- Y. Zeng, Z. Ye, W. Xu, D. Li, J. Lu, L. Zhu and B. Zhao, Appl. Phys. Lett., 2006, 88, 062107 CrossRef.
- J. Lee, S. Cha, J. Kim, H. Nam, S. Lee, W. Ko, K. L. Wang, J. Park and J. Hong, Adv. Mater., 2011, 23, 4183–4187 CrossRef PubMed.
- S. Chawla, K. Jayanthi and R. Kotnala, Phys. Rev. B: Condens. Matter Mater. Phys., 2009, 79, 125204 CrossRef.
- A. Carvalho, A. Alkauskas, A. Pasquarello, A. Tagantsev and N. Setter, Phys. Rev. B: Condens. Matter Mater. Phys., 2009, 80, 195205 CrossRef.
- M. Wardle, J. Goss and P. Briddon, Phys. Rev. B: Condens. Matter Mater. Phys., 2005, 71, 155205 CrossRef.
- R. Vidya, P. Ravindran and H. Fjellvåg, J. Appl. Phys., 2012, 111, 123713 CrossRef.
- J. Yi, C. Lim, G. Xing, H. Fan, L. Van, S. Huang, K. Yang, X. Huang, X. Qin and B. Wang, Phys. Rev. Lett., 2010, 104, 137201 CrossRef PubMed.
- X. Ji, L. Chen, M. Xu, M. Dong, K. Yan, S. Cheng, X. Kong, T. Wang, J. Liu and B. Gu, Adv. Electron. Mater., 2018, 4, 1700307 CrossRef.
- G. Kresse and J. Hafner, Phys. Rev. B: Condens. Matter Mater. Phys., 1993, 48, 13115 CrossRef.
- G. Kresse and J. Furthmüller, Phys. Rev. B: Condens. Matter Mater. Phys., 1996, 54, 11169 CrossRef.
- G. Kresse and D. Joubert, Phys. Rev. B: Condens. Matter Mater. Phys., 1999, 59, 1758 CrossRef.
- P. E. Blöchl, Phys. Rev. B: Condens. Matter Mater. Phys., 1994, 50, 17953 CrossRef.
- J. P. Perdew, K. Burke and M. Ernzerhof, Phys. Rev. Lett., 1996, 77, 3865 CrossRef PubMed.
- H. Jónsson, G. Mills and K. W. Jacobsen, Nudged elastic band method for finding minimum energy paths of transitions, 1998 Search PubMed.
- G. Henkelman, B. P. Uberuaga and H. Jónsson, J. Chem. Phys., 2000, 113, 9901–9904 CrossRef.
- S. Horzum, D. Çakır, J. Suh, S. Tongay, Y.-S. Huang, C.-H. Ho, J. Wu, H. Sahin and F. Peeters, Phys. Rev. B: Condens. Matter Mater. Phys., 2014, 89, 155433 CrossRef.
- I. Barin and G. Platzki, Thermochemical data of pure substances, Wiley Online Library, 1989 Search PubMed.
- W. M. Haynes, CRC handbook of chemistry and physics, CRC press, 2014 Search PubMed.
- J. Phys. Chem. Ref. Data 14, ed. M. Chase Jr, 1985 Search PubMed.
- S. Chen, J.-H. Yang, X.-G. Gong, A. Walsh and S.-H. Wei, Phys. Rev. B: Condens. Matter Mater. Phys., 2010, 81, 245204 CrossRef.
- S. Zhou, N. Liu, Z. Wang and J. Zhao, ACS Appl. Mater. Interfaces, 2017, 9, 22578–22587 CrossRef PubMed.
- S. Giovanazzi, A. Görlitz and T. Pfau, Phys. Rev. Lett., 2002, 89, 130401 CrossRef PubMed.
- J. H. Wesenberg and K. Mølmer, Phys. Rev. Lett., 2004, 93, 143903 CrossRef PubMed.
- N. P. Herring, L. S. Panchakarla and M. S. Elshall, Langmuir, 2014, 30, 2230 CrossRef PubMed.
| This journal is © The Royal Society of Chemistry 2018 |