 Open Access Article
How critical is geometrical confinement? Analysis of spatially and temporally resolved particulate matter removal with an electrostatic precipitator†
Ching-Yu Wang and
Cheng-Che Hsu *
*
Department of Chemical Engineering, National Taiwan University, No. 1, Sec. 4, Roosevelt Road, Taipei, Taiwan. E-mail: chsu@ntu.edu.tw
First published on 3rd September 2018
Abstract
This study investigates the spatial and temporal dispersion of particulate matter (PM) when using a needle-type electrostatic precipitator (ESP). The ESP is installed in tubes of 3 and 10 cm diameter. A simple light scattering setup integrated with image processing is built to evaluate and quantify the spatial and temporal dispersion of PM. The ESP is operated under stationary and continuous flowing modes to test its PM removal capability. Under the stationary mode, PM is removed efficiently in 10 and 45 seconds when using a 3 and 10 cm tube, respectively. In a more geometrically confined system, a large spatial particulate concentration gradient is seen from 18 to 24 cm, indicating that the cleaning capability can be controlled within a localized space. By modulating the applied voltage from direct current (DC) to a low-frequency pulse with 50% duty, the ozone concentration can be reduced by nearly 50% while maintaining the cleaning efficiency. The analysis with spatially and temporally resolved particulate dispersion provides a novel strategy for testing the performance of an ESP. Furthermore, physical confinement enhances both the spatial and temporal removal efficiency, which is crucial for indoor and personal air cleaning devices. These results will contribute to air purification and environmental monitoring.
Introduction
In recent decades, pollution caused by suspended particulate matter (PM) has become an important issue because of its adverse impact on human health.1–4 PM is classified as PM10 (2.5 to 10 μm in diameter), PM2.5 (1 to 2.5 μm in diameter) and PM1 (smaller than 1 μm in diameter) according to its size. PM is generated from various sources such as power plants, industrial processes, and transportation.5,6 PM has a small size and large specific area, and may contain potentially toxic materials on the surface. Upon being inhaled, PM may penetrate lung tissue and lodge in bronchioles and alveoli permanently.7,8 Exposure to PM can directly lead to airway obstruction, decreased gas exchange, asthma, or damage to the respiratory system.9,10 In addition, PM is considered risky for the cardiovascular system and may increase the risk of heart attacks, strokes, or heart rhythm disturbances.11 Owing to the great concern on the health risks of PM, developing PM control technologies is crucial and urgent.12Several techniques including filtering,13,14 centrifugal cyclone separation,15 and the use of an electrostatic precipitator (ESP)16,17 have been widely used for PM removal under ambient conditions. ESP can precipitate PM in the air by using an electrical field with very little pressure drop.18,19 ESP devices consist of an electrode with a small radius of curvature and collecting plates.20 These devices are typically designed in the wire-plate (parallel-plate ESP),21 needle-plate,22 or wire-duct (tubular ESP)23 geometries. To generate corona discharges around the sharp edge, a high voltage with either positive or negative polarity is applied to the electrode. The generated electrons are accelerated to collide with and charge gaseous molecules and suspended PM.24,25 Once PM is charged, they may migrate, by gas convective flow, electric field induced flow (i.e., ionic wind), and/or Coulomb's force,26–28 to collecting plates, following which they can be removed. Compared to other air cleaning devices such as cyclones, fabric filters, and ceramic filters,29–32 ESP devices afford the advantages of high PM removal efficiency and relatively low pressure drop. The removal of 99% of PM without external force has been reported.33 More recently, some new types of implements such as hybrid electrostatic filter precipitator34 and wet ESPs35 are also developed. Although PM removal has been studied in detail,36 few studies have focused on the removal of spatially resolved PM.
With the recent increase in awareness of health risks of PM and stricter air quality regulations, the demand for ESP devices for personal daily use has increased.37 Such devices need to be compact, portable, and operable at low temperature, unlike industrial ESP devices.38 In addition, such devices should be capable of cleaning air in the localized area around humans.39,40 For indoor devices, real-time removal of PM as they enter from the outside is an efficient approach.41,42 For personal devices, PM removal within a few centimeters' distances of humans is an efficient approach to ensure breathable air quality.43 Therefore, the temporally and spatially resolved behavior of PM using ESP is critical for fundamental studies and device development.44 Temporally resolved PM monitoring has already been reported.45–47 However, few, if any, studies have reported on temporally and spatially resolved PM removal characteristics using ESP devices.
This study investigates the use of needle-plate ESP devices in a tubular system for personal and indoor use. The spatial and temporal dispersion of PM during the operating of the ESP device is studied using a home-made laser light scattering system. The removal efficiency when space is confined or not confined under stationary or flowing ambient air is studied to demonstrate the efficient use of a personal and indoor ESP device. The study results provide a novel strategy for developing personal and indoor ESP devices.
Material and methods
Needle-plate ESP device
Fig. 1a shows a schematic of the needle-plate ESP device setup. This device consists of a high-voltage dc power source, a needle-type electrode, and a planar electrode. DC power sources that generate high voltage up to positive 40 kV (UM8 40*4, Spellman High Voltage Electronics Crop., Hauppauge, NY) or negative 20 kV (You-Shang Technical Crop., Kaohsiung) are used. A function generator is used to modulate the dc power sources to generate low-frequency high-voltage pulses. Positive- and negative-DC and a positive 1 Hz pulse with 50% duty are used to drive the ESP. A stainless-steel needle of 0.35 mm diameter is used to generate a corona discharge at its tip. Copper is used as the planar grounding electrode; this electrode is set 10 cm away from the high-voltage needle electrode. 60 cm-long transparent acrylic tubes with 3 and 10 cm diameter are used to examine the ESP performance temporally and spatially.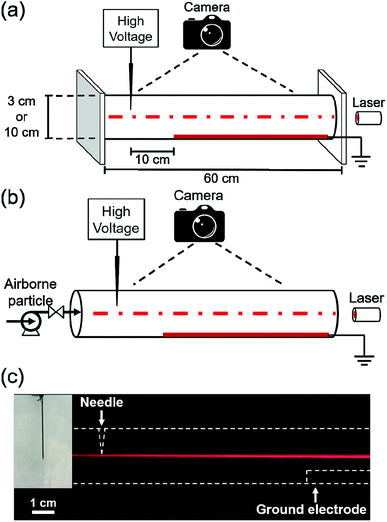 | ||
| Fig. 1 Schematic of the experimental setup under (a) stationary mode and (b) continuous flowing mode. (c) Photograph of the system with suspended PM. The inset shows the needle. | ||
Generation of PM and operating mode
PM is generated by burning incense in the ambient air. The ESP performance for PM removal is tested under two operating modes: stationary (Fig. 1a) and continuous flowing (Fig. 1b). For the stationary mode, the test tube is first filled with PM. Both sides of the tube are blocked during the ESP performance test. For the continuous flowing mode, PM flows continuously through the tube during the ESP performance test. A constant 10 cm s−1 air flow is chosen because it is a typical condition chosen in the literatures.23,48,49 For both modes, the spatial and temporal dispersions of PM are monitored using a home-made laser light scattering setup, as described below.Quantification of temporal and spatial removal of PM
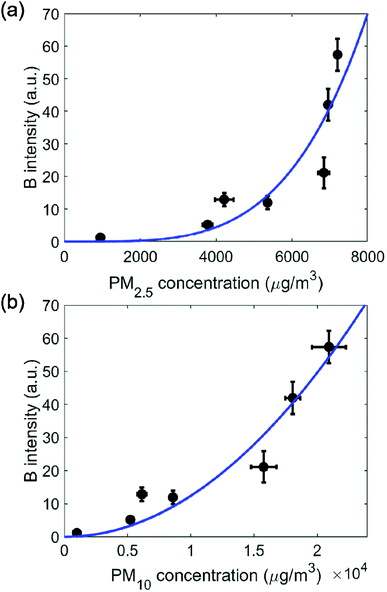
Light scattering has been widely used to quantify PM in the gas phase.50 A home-made laser light scattering setup is used to semi-quantitatively monitor PM removal using the ESP. The laser light is generated using a laser diode (650 nm, D6505, US-Lasers Inc., Baldwin Park, CA) driven by a constant power laser driver (model EK1101, Thorlabs Inc., Newton, New Jersey). A collimated 3 mm laser beam is used. A cellphone camera (iPhone 6S, Apple Inc.) is used to record the temporally and spatially resolved scattering light during PM removal. Fig. 1c shows light beam when the PM was suspended in the test tube. The temporal and spatial evolution of the PM concentration is semi-quantified by examining the scattering light intensities in the camera images. We note that no observable surface contamination on the tube surface was seen during the measurement. Each image is deconvoluted into red (R), green (G), and blue (B) components. These components are calibrated to the absolute concentration by using a commercial PM sensor (PMS3003, Plantower). The PM2.5 and PM10 calibration lines for the B component are shown as Fig. 2a and b. Those for the R component are shown in Fig. S1(a) and (b).† It shows positive correlations between absolute concentrations and intensities of R and B components of the scattering light. Because a 650 nm laser diode is used as the light source, R and G components are frequently saturated. Therefore, the B component is used to quantify the scattering light intensity. The background light intensity, IB,blank, is taken without PM at the needle tip. The light intensities are normalized as follows:where IB is the B component intensity and IB,t=0, the absolute B component intensity at power on.
Results and discussion
Spatial and temporal dispersion of PM under stationary mode
The temporal and spatial evolution of the PM concentration upon ESP treatment under the stationary mode for 3 and 10 cm testing tubes are examined; Fig. 3 shows the results. Before treatment, the PM distribution in the tubular system is nearly uniform, and the absolute intensities of each position are normalized as unity. Fig. 3(a) and (b) show three-dimensional plots of the spatial and temporal evolution of PM in the 10 and 3 cm tubular systems, representing less and more geometrically confined systems, respectively. When +13 kV DC is applied to the needle electrode, the scattered light intensity reduced spatially and temporally. The 10 cm system takes 45 s for the relative intensities to reduce to 0.2. A rather flat spatial profile is observed across this system. By contrast, in the 3 cm system, the transient time is relatively short (∼10 s). Within this transient period (0–10 s), the relative intensities decrease significantly in the region close to the high-voltage needle electrode (at 0 cm); however, the relative intensities remain high far away from the needle electrode (at 25 cm). A low relative intensity from 0 to 15 cm at a time greater than 10 s and a large spatial gradient from 15 to 25 cm away from the needle electrode are observed. It clearly demonstrates that by the physical confinement of the 3 cm tube, the region close to the high voltage electrode shows a more efficient PM removal. Such an effect of confinement has been reported in the literature, known as narrow ESPs.51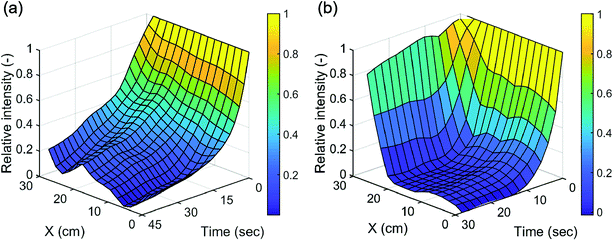 | ||
| Fig. 3 Spatial and temporal dispersion of PM under stationary mode with a voltage of +13 kV DC in a tubular system with diameter of (a) 10 cm and (b) 3 cm. | ||
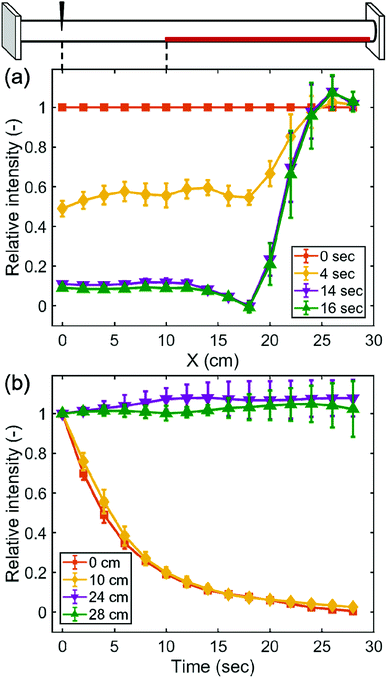
The PM removal behavior in the 3 cm system is analyzed in further detail. Fig. 4a shows the spatial profile of the relative intensity of scattered light at different times: initial normalized profile (0th second), and profiles at the 4th, 14th, and 16th second upon the application of the high voltage. At each position from 0 to 18 cm, PM is removed efficiently, and the relative intensities decrease simultaneously with final values lower than 0.2. A relatively large spatial gradient is observed from 18 to 24 cm. This represents the transition region from “clean” to “unclean.” A clear boundary at ∼18 cm is observed. At locations beyond 24 cm, the relative intensities remain in unity, suggesting inefficient PM removal. Fig. 4b shows the temporal dispersion. The locations 0 and 10 cm represent the area adjacent to the electrodes, that is, the region inside the confined clean area; the locations 24 and 28 cm represents areas further away from the electrodes. Effective PM removal is seen at 0 and 10 cm, whereas nearly no removal is seen at 24 and 28 cm. This spatial and temporal dispersion results from the flow induced by the electrostatic force. In the area close to the high-voltage electrode, the flow is more influenced by the induced flow, in turn leading to a mixing effect; therefore, the PM can be removed simultaneously. For locations farther from the electrode, nearly no induced flow is seen as it is suppressed by the geometric confinement. It is noted that the visual appearances of the light beam during the process clearly show the existence of the induced flow. In addition to the effect of the induced flow, other factors could potentially influence the PM removal behavior such as particle densities,28 particle size distribution,35 composition of particle,34 distance between discharge and ground electrode,26 and the electrode geometry.23
The existence of a confined area within which PM is removed effectively provides a new route for developing personal and wearable cleaning devices to purify air. With the geometry confinement, ESP devices can more efficiently remove PM in the localized region defined by the electrode and the geometric design. It is therefore possible to design ESP devices that are able to effectively remove PM in the air close to the breathing region, rather than cleaning an entirely open space such as a room. Such a design is beneficial to the development of portable and personal air cleaning device.
Effects of applied voltage
The influence of the applied voltage on the ESP device performance under the stationary mode in a 3 cm tubular system is studied. The ESP device is operated with voltages of 4–16 kV using the following three modes: DC with positive polarity, 1 Hz pulsed DC with 50% duty and positive polarity, and DC with negative polarity. In addition to analyzing the PM removal performance, the ozone concentration during the removal process is also measured.To analyze the PM removal performance, the relative intensities under different modes as a function of applied voltage of 4–16 kV at the 15th second and at locations of 6 and 26 cm are measured. The 15th second is chosen as the final state because the PM removal processes show little difference after 15 s in most cases. Fig. 5a shows the relative scattering light intensities at 6 cm. It clearly shows that at least 7 kV is required to effectively remove PM under DC with positive polarity and pulsed DC modes. For DC with negative polarity mode, 10 kV is required. Fig. 5b shows the relative scattering light intensities at 26 cm. Under each operating mode, the PM is not removed and the relative intensities remain close to unity because the system is geometrically confined and only locations close to the electrode can be cleaned. Exact cleaned distance with different electrical modes and voltage is shown in Fig. S2.†
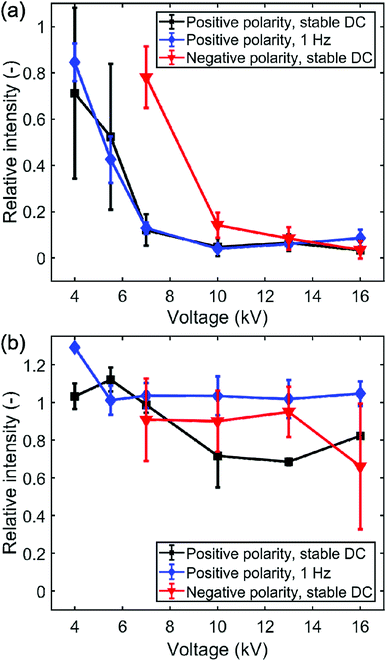 | ||
| Fig. 5 Relative intensity with different electrical modes and voltage of 4–16 kV at 15th second and at (a) 6 cm and (b) 26 cm under stationary mode in tubular system with diameter of 3 cm. | ||
The ozone concentration is also measured as ozone formation has become a critical issue for ESP devices. This is because corona discharge can induce chemical reactions to generate ozone in air, and ozone is toxic to humans. The ozone concentration is monitored in a 300 cm3 chamber under three electrical modes at 16 kV to maximize the possible ozone formation for more precise measurement. The background emission of ozone is ∼0.05 ppm. For 3 min ESP operation, the ozone concentrations are 0.70 ± 0.03 ppm for DC with positive polarity mode, 0.36 ± 0.04 ppm for DC pulsed mode, and 0.36 ± 0.03 ppm for DC with negative polarity mode. It clearly shows that the pulsed mode greatly reduces ozone formation by nearly 50%. This observation clearly demonstrates that the voltage mode can be varied to achieve low ozone concentration while retaining the removal performance.
Spatial dispersion of PM under continuous flowing mode
In this section, PM removal performance using ESP processing under a continuous flowing mode in the 3 cm tubular system is examined. In this mode, the PM is formed continuously, and an air pump is integrated at the inlet of the tubular system. This arrangement generates a PM flow of ∼10 cm s−1 through the tube. The spatial dispersion of PM under steady-state operation with voltages of +7 to +16 kV DC is analyzed; Fig. 6 shows the results. It shows very different behavior from that in the stationary mode. It shows a clear spatial gradient along the tube, suggesting efficient PM removal. Compared with the observations obtained in the stationary mode, in which the PM concentration remained high at 24 and 28 cm, this mode shows high PM removal toward the end of the tube. The requirement of applied voltage of 10–16 kV for effective PM removal is observed. The light scattering intensity gradient along the tubular system clearly results from the flow pattern. The convective flow guides the air flow along the tube and superimposes it on the field-induced flow described above. This is critical for testing and designing indoor and personal use air devices because the goal is to achieve real-time precipitation of PM from flowing air.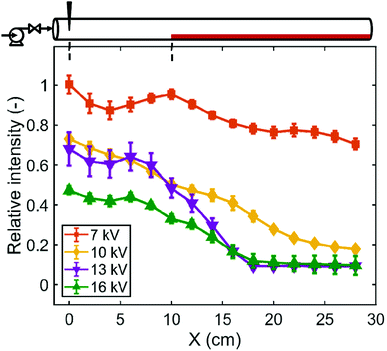 | ||
| Fig. 6 Spatially resolved PM with voltages of 7, 10, 13 and 16 kV DC under continuous flowing mode in tubular system with diameter of 3 cm. | ||
Conclusion
In summary, an ESP device is developed for removing PM, and it is tested through spatial and temporal analysis of PM under the stationary and continuous flowing modes. Under the stationary mode, a limited clean boundary is seen and a high purification rate is provided in the system with geometry confinement. With a decrease in the tube diameter from 10 to 3 cm, the time required to purify the location at the distance of 10 cm from the discharge electrode can be reduced from 45 to 10 s. By modulating the electrical input from stable to pulsed, the device can produce less ozone without sacrificing the PM removal efficiency. Under the continuous flowing mode, a higher voltage provides higher removal efficiency. These results can be further used for testing and designing personal and indoor air cleaning devices.Conflicts of interest
The author declares no competing financial interest.Acknowledgements
This work is supported by the Ministry of Science and Technology, Taiwan (106-2221-E-002-170-MY3).References
- M. Brauer, G. Freedman, J. Frostad, A. van Donkelaar, R. V. Martin, F. Dentener, R. van Dingenen, K. Estep, H. Amini, J. S. Apte, K. Balakrishnan, L. Barregard, D. Broday, V. Feigin, S. Ghosh, P. K. Hopke, L. D. Knibbs, Y. Kokubo, Y. Liu, S. F. Ma, L. Morawska, J. L. T. Sangrador, G. Shaddick, H. R. Anderson, T. Vos, M. H. Forouzanfar, R. T. Burnett and A. Cohen, Environ. Sci. Technol., 2016, 50, 79–88 CrossRef PubMed.
- K. H. Kim, E. Kabir and S. Kabir, Environ. Int., 2015, 74, 136–143 CrossRef PubMed.
- J. J. West, A. Cohen, F. Dentener, B. Brunekreef, T. Zhu, B. Armstrong, M. L. Bell, M. Brauer, G. Carmichael, D. L. Costa, D. W. Dockery, M. Kleeman, M. Krzyzanowski, N. Kunzli, C. Liousse, S. C. C. Lung, R. V. Martin, U. Poschl, C. A. Pope, J. M. Roberts, A. G. Russell and C. Wiedinmyer, Environ. Sci. Technol., 2016, 50, 4895–4904 CrossRef PubMed.
- V. C. Srivastava, RSC Adv., 2012, 2, 759–783 RSC.
- L. Morawska, A. Afshari, G. N. Bae, G. Buonanno, C. Y. H. Chao, O. Hanninen, W. Hofmann, C. Isaxon, E. R. Jayaratne, P. Pasanen, T. Salthammer, M. Waring and A. Wierzbicka, Indoor Air, 2013, 23, 462–487 CrossRef PubMed.
- S. H. L. Yim and S. R. H. Barrett, Environ. Sci. Technol., 2012, 46, 4291–4296 CrossRef PubMed.
- M. Semmler-Behnke, W. G. Kreyling, H. Schulz, S. Takenaka, J. P. Butler, F. S. Henry and A. Tsuda, Proc. Natl. Acad. Sci. U. S. A., 2012, 109, 5092–5097 CrossRef PubMed.
- A. Nel, Science, 2005, 308, 804–806 CrossRef PubMed.
- J. H. Sung, J. H. Ji, J. U. Yoon, D. S. Kim, M. Y. Song, J. Jeong, B. S. Han, J. H. Han, Y. H. Chung, J. Kim, T. S. Kim, H. K. Chang, E. J. Lee, J. H. Lee and I. J. Yu, Inhalation Toxicol., 2008, 20, 567–574 CrossRef PubMed.
- S. Weichenthal, A. Dufresne and C. Infante-Rivard, Indoor Air, 2007, 17, 81–91 CrossRef PubMed.
- R. D. Brook, S. Rajagopalan, C. A. Pope, J. R. Brook, A. Bhatnagar, A. V. Diez-Roux, F. Holguin, Y. L. Hong, R. V. Luepker, M. A. Mittleman, A. Peters, D. Siscovick, S. C. Smith, L. Whitsel, J. D. Kaufman, E. Amer Heart Assoc Council, D. Council Kidney Cardiovasc and M. Council Nutr Phys Activity, Circulation, 2010, 121, 2331–2378 CrossRef PubMed.
- P. Sheehan, E. J. Cheng, A. English and F. H. Sun, Nat. Clim. Change, 2014, 4, 306–309 CrossRef.
- J. H. Ji, G. N. Bae, S. H. Kang and J. Hwang, J. Aerosol Sci., 2003, 34, 1493–1504 CrossRef.
- X. Mao, Y. Si, Y. C. Chen, L. P. Yang, F. Zhao, B. Ding and J. Y. Yu, RSC Adv., 2012, 2, 12216–12223 RSC.
- M. S. Shin, H. S. Kim, D. S. Jang, J. D. Chung and M. Bohnet, Appl. Therm. Eng., 2005, 25, 1821–1835 CrossRef.
- Y. Zhuang, Y. J. Kim, T. G. Lee and P. Biswas, J. Electrost., 2000, 48, 245–260 CrossRef.
- L. J. Liu, X. X. Li, H. Wang, B. Xue, X. M. Zheng and M. Chen, RSC Adv., 2015, 5, 40012–40017 RSC.
- V. Scholtz, J. Pazlarova, H. Souskova, J. Khun and J. Julak, Biotechnol. Adv., 2015, 33, 1108–1119 CrossRef PubMed.
- A. Jaworek, A. Krupa and T. Czech, J. Electrost., 2007, 65, 133–155 CrossRef.
- G. G. Kang, L. Li, W. Wang and D. Yu, RSC Adv., 2016, 6, 75038–75044 RSC.
- G.-Y. Lin, C.-J. Tsai, S.-C. Chen, T.-M. Chen and S.-N. Li, Aerosol Sci. Technol., 2010, 44, 38–45 CrossRef.
- T. C. Wang, N. Lu, J. Li and Y. Wu, Environ. Sci. Technol., 2010, 44, 3105–3110 CrossRef PubMed.
- K. Shimizu, Y. Kurokawa and M. Blajan, IEEE Trans. Ind. Appl., 2016, 52, 1823–1830 Search PubMed.
- J. H. Chen and J. H. Davidson, Plasma Chem. Plasma Process., 2002, 22, 199–224 CrossRef.
- A. Fridman, A. Chirokov and A. Gutsol, J. Phys. D: Appl. Phys., 2005, 38, R1–R24 CrossRef.
- A. M. Drews, L. Cademartiri, G. M. Whitesides and K. J. M. Bishop, J. Appl. Phys., 2013, 114, 7 CrossRef.
- E. Moreau, J. Phys. D: Appl. Phys., 2007, 40, 605–636 CrossRef.
- J. Podlinski, A. Niewulis, J. Mizeraczyk and P. Atten, J. Electrost., 2008, 66, 246–253 CrossRef.
- C. Liu, P. C. Hsu, H. W. Lee, M. Ye, G. Y. Zheng, N. A. Liu, W. Y. Li and Y. Cui, Nat. Commun., 2015, 6, 9 Search PubMed.
- B. W. Liu, S. C. Zhang, X. L. Wang, J. Y. Yu and B. Ding, J. Colloid Interface Sci., 2015, 457, 203–211 CrossRef PubMed.
- Q. Li, Y. Y. Xu, H. H. Wei and X. F. Wang, RSC Adv., 2016, 6, 65275–65281 RSC.
- P. Li, C. Y. Wang, Z. Li, Y. C. Zong, Y. Y. Zhang, X. D. Yang, S. Q. Li and F. Wei, RSC Adv., 2014, 4, 54115–54121 RSC.
- D. G. Poppendieck, D. Rim and A. K. Persily, Environ. Sci. Technol., 2014, 48, 2067–2074 CrossRef PubMed.
- X. W. Liu, Y. S. Xu, B. Fan, C. Lv, M. H. Xu, S. W. Pan, K. Zhang, L. Li and X. P. Gao, Energy Fuels, 2016, 30, 5922–5929 CrossRef.
- Y. S. Xu, X. W. Liu, J. Cui, D. Chen, M. H. Xu, S. W. Pan, K. Zhang and X. P. Gao, Energy Fuels, 2016, 30, 7465–7473 CrossRef.
- J. S. Chang, Plasma Sources Sci. Technol., 2008, 17, 6 CrossRef.
- A. Miller, G. Frey, G. King and C. Sunderman, Aerosol Sci. Technol., 2010, 44, 417–427 CrossRef.
- M. S. Waring, J. A. Siegel and R. L. Corsi, Atmos. Environ., 2008, 42, 5003–5014 CrossRef.
- A. J. Wheeler, L. A. Wallace, J. Kearney, K. Van Ryswyk, H. Y. You, R. Kulka, J. R. Brook and X. H. Xu, Aerosol Sci. Technol., 2011, 45, 1078–1089 CrossRef.
- S. A. Grinshpun, A. Adhikari, T. Honda, K. Y. Kim, M. Toivola, K. S. R. Rao and T. Reponen, Environ. Sci. Technol., 2007, 41, 606–612 CrossRef PubMed.
- L. Morawska, V. Agranovski, Z. Ristovski and M. Jamriska, Indoor Air, 2002, 12, 129–137 CrossRef PubMed.
- M. S. Waring and J. A. Siegel, Indoor Air, 2011, 21, 267–276 CrossRef PubMed.
- B. Molgaard, A. J. Koivisto, T. Hussein and K. Hameri, Aerosol Sci. Technol., 2014, 48, 409–417 CrossRef.
- J. Park, S. Ham, M. Jang, J. Lee, S. Kim, S. Kim, K. Lee, D. Park, J. Kwon, H. Kim, P. Kim, K. Choi and C. Yoon, Environ. Sci. Technol., 2017, 51, 7624–7638 CrossRef PubMed.
- J. B. Xiang, C. J. Weschler, J. H. Mo, D. Day, J. F. Zhang and Y. P. Zhang, Environ. Sci. Technol., 2016, 50, 10236–10244 CrossRef PubMed.
- H. J. Kim, B. Han, Y. J. Kim, T. Oda and H. Won, Indoor Air, 2013, 23, 369–378 CrossRef PubMed.
- R. L. Peck, S. A. Grinshpun, M. Yermakov, M. B. Rao, J. Kim and T. Reponen, Build. Environ., 2016, 98, 21–29 CrossRef.
- C. H. Zheng, Z. Y. Shen, Q. Y. Chang, Q. F. Su, X. B. Zhu and X. Gao, Energy Fuels, 2017, 31, 6266–6273 CrossRef.
- J. Podlinski, J. Dekowski, J. Mizeraczyk, D. Brocilo and J. S. Chang, J. Electrost., 2006, 64, 259–262 CrossRef.
- L. J. S. Liu, J. C. Slaughter and T. V. Larson, Environ. Sci. Technol., 2002, 36, 2977–2986 CrossRef PubMed.
- A. Niewulis, A. Berendt, J. Podlinski and J. Mizeraczyk, J. Electrost., 2013, 71, 808–814 CrossRef.
Footnote |
| † Electronic supplementary information (ESI) available: Fig. S1 showing calibration line of absolute concentration for R component; Fig. S2 showing clean distance with different electrical modes and voltage. See DOI: 10.1039/c8ra04734k |
| This journal is © The Royal Society of Chemistry 2018 |


