
 Open Access Article
 This Open Access Article is licensed under a Creative Commons Attribution-Non Commercial 3.0 Unported Licence
Becquerelite mineral phase: crystal structure and thermodynamic and mechanical stability by using periodic DFT†
Francisco Colmenero *a,
Ana María Fernándezb,
Vicente Timóna and
Joaquin Cobosb
*a,
Ana María Fernándezb,
Vicente Timóna and
Joaquin Cobosb
aInstituto de Estructura de la Materia (IEM-CSIC), C/Serrano, 123, 28006 Madrid, Spain. E-mail: francisco.colmenero@iem.cfmac.csic.es
bCentro de Investigaciones Energéticas, Medioambientales y Tecnológicas (CIEMAT), Avda/Complutense, 40, 28040, Madrid, Spain
First published on 10th July 2018
Abstract
The structure, thermodynamic and mechanical properties of becquerelite mineral, Ca(UO2)6O4(OH)6·8H2O, were studied by means of theoretical solid-state calculations based on density functional theory using plane waves and pseudopotentials. The positions of the hydrogen atoms in the unit cell of becquerelite mineral were optimized theoretically since it was not possible to determine them from X-ray diffraction data by structure refinement. The structural results, including the lattice parameters, bond lengths and X-ray powder pattern, were found to be in excellent agreement with their experimental counterparts. The fundamental thermodynamic properties of becquerelite mineral, including specific heat, entropy, enthalpy and Gibbs free energy, were then computed by performing phonon calculations at the computed optimized structure. Since the experimental values of these properties are unknown, their values were predicted. The values obtained for the isobaric specific heat and entropy of becquerelite at the temperature of 298.15 K were 148.4 and 172.3 J K−1 mol−1, respectively. The computed thermodynamic properties were combined with those of the corresponding elements in order to obtain the enthalpy and Gibbs free energy of formation as a function of temperature. The availability of these thermodynamic properties of formation allowed to determine the enthalpies and free energies and associated reaction constants of a series of reactions involving becquerelite and other uranyl containing materials. Futhermore, knowledge of these properties permitted the study of the thermodynamic stability of becquerelite with respect to a rich set of secondary phases of spent nuclear fuel, including dehydrated schoepite, schoepite, metaschoepite, studtite, metastudtite, rutherfordine and soddyite under different conditions of temperature. Becquerelite is shown to be highly stable in the presence of hydrogen peroxide. It is the second most stable phase under intermediate hydrogen peroxide concentrations (after schoepite), and the fourth most stable phase under high hydrogen peroxide concentrations (after studtite, schoepite and metaschoepite). Finally, the equation of state and elastic properties of this mineral, unknown to date, were determined. The crystal structure of becquerelite was found to be stable mechanically and dynamically. Becquerelite can be described as a brittle material exhibiting large anisotropy and large compressibility in the direction perpendicular to the sheets characterizing the structure of this layered uranyl containing material. The dependence of the elastic properties of becquerelite with respect to the strain orientation is shown to be analogous to that of schoepite mineral. The calculated bulk modulus is also very similar to that of schoepite, B ∼ 31 GPa.
1 Introduction
Becquerelite, Ca(UO2)6O4(OH)6·8H2O, is an important hydrated uranyl oxyhydroxide mineral phase which was encountered in the Kasolo mine (Katanga, Democratic Republic of the Congo) and described for the first time by Schoep in 1922.1–3 Becquerelite was named after the French physicist Antoine Henri Becquerel (1852–1908), who discovered the spontaneous radioactivity in 1896.4 Uranyl oxyhydroxides form mainly in uranium rich aqueous solutions and develop early during the oxidation and corrosion of uraninite-bearing ore deposits, commonly at or near the surface of corroded uraninite.5–11 The alteration of uranyl oxyhydroxides is very important as their long-term stability under various environmental conditions is pertinent to understanding the complex assembly of uranyl minerals found at uranium deposits.10,11 The formation and alteration of uranyl oxyhydroxides determine to a large extent the reaction paths and paragenesis of uranyl minerals at weathered uranium deposits, controlling the dispersion and fixation of uranium in many groundwaters.Becquerelite has been recognized to be a fundamental component of the paragenetic sequence of secondary phases that arises from the corrosion of spent nuclear fuel (SNF) under the final geological disposal conditions.12–14 High-level radioactive waste (HLRW) will be disposed in underground geological repositories (UGR). In UGRs placed in clay rock formations, the contact with groundwater is expected after a time period of the order of some thousands of years after closure,15 when the barriers that protect the waste will be breached.16 The reducing conditions in the deep geological disposal at this time will not be maintained, and an oxidative environment has been postulated in a layer near the fuel surface (within 50 μm of the surface).17 These oxidant conditions are consequence of the radiolysis of water due to the strong ionizing radiation associated with the spent fuel18,19 leading to the production of oxidants as hydrogen peroxide.20 The formation of uranyl peroxide and oxyhydroxide phases will follow from the contact of these oxidants with uranium dioxide.21,22 Becquerelite phase has been observed as alteration product of spent fuel in cooling basins at the Hanford, Washington site.23–26 A contaminant release model23 was developed to evaluate the release of uranium and other contaminants in the residual sludge of Hanford waste tanks based on the experimental results of water-leaching, selective extractions, empirical solubility measurements, thermodynamic modeling and solid phase characterization. These studies highlighted the importance of the availability of accurate thermodynamic data for the secondary phases of spent nuclear fuel as becquerelite.
The study of becquerelite phase is also relevant for the quantification of the uranium immobilization potential of cement matrices.27–30 This quantification is important in many applications as the immobilization of the SNF, in the treatment of uranium mine tailings, and the evaluation of the long-term performance of low level radioactive waste (LLRW) cement grouts for radionuclide encasement.31–34 Moroni and Glasser27 studied the reactions between calcium and silicon oxides, representing the principal components of cement, or calcium silicate hydrogel (CSH) with schoepite in aqueous suspensions at 85 °C to evaluate the solubility of uranium at highly alkaline conditions and to test the immobilization potential. Several solubility-limiting phases as weeksite and becquerelite were identified. The formation of crystalline phases led to the decrease of uranium solubility. Similarly, in diffusion experiments carried out in order to evaluate the performance of LLWR cement grouts,31–34 several uranium phases were identified as soddyite, becquerelite, uranophane, and autunite. Again, the lack of reliable thermochemical data for these phases was underlined.31
Uranium disequilibrium data in conjunction with petrographic analyses indicated that becquerelite phase can persist for times of the order of hundreds of thousands of years and that it is highly resistant to dissolution in uranium and calcium bearing groundwaters.35 The long-term stability of this mineral phase in the presence of calcium supports the experiments that indicate that natural becquerelite has lower solubility than synthetic becquerelite. Since the large temporal stability of this mineral phase has important implications in the long-term behavior of a deep geological disposal, its solubility has been studied in detail for both natural and synthetic samples.36–42.
The chemistry of the uranyl hydrated oxides of uranium(VI) is extremely complex and more than 25 phases have been described in the literature.10,43–73 The mineral phases of uranyl oxyhydroxide group10 can be represented by the general formula Mn(UO2)aOb(OH)c·mH2O, where the letter M represents divalent cations (commonly M = Ca2+, Pb2+, Ba2+, Sr2+, although K+ bearing phases are also known). Becquerelite has M = Ca2+ and forms part of the compreignacite–billietite series,69–70 which vary primarily by a substitution of calcium with potassium (in compreignacite) or with barium (in billietite). Uranyl oxyhydroxides are layered compounds in which the water occurs mainly as molecules located at interlayer sites together with the M cations. The positive charge of the interlayer cations is balanced by the net negative charge due to hydroxyl groups within the structural sheet. The knowledge of the structures of uranyl minerals is very important because it is a key to evaluate the possible incorporation of fission products and transuranic elements into their crystal structures,50,74–86 thus reducing their release and environmental impact. Uranyl cation in the sheets could be replaced by other non-uranyl cations, similar to cation substitution in the sheets of clay minerals, providing a mechanism for incorporation of transuranic elements into these phases. The cations may also be substituted into the interlayer space via ion exchange, providing a mechanism of incorporation of fission products as cesium or strontium. Thus, these mineral phases formed at the SNF surface may potentially act as an additional barrier to radionuclide migration to the environment via mineral sorption reactions. The incorporation mechanisms seem to be more favorable in structures with charged sheets and cations in the interlayer than in structures with electroneutral sheets, since coupled substitutions involving the interlayer may be a charge-balancing mechanism that permits the substitution.50,78,79
The knowledge of the structures of this group of minerals has improved significantly in the last decades10 due to the advent of improved analytical methods, most notably the introduction of charge-coupled device (CCD) detectors for X-ray diffraction.87 The use of CCD detectors permits accurate structure determinations of very small crystals and of minerals with large unit cells, both peculiarities being common within the uranyl mineral groups. However, for the case of uranyl minerals, the determination of the hydrogen atom positions from X-ray diffraction data by structure refinement is frequently not possible. Two important examples are schoepite51–53 and becquerelite phases.47–50 The hydrogen atom positions in the structure of schoepite were successfully determined using theoretical methods in a previous work.88 The unit cell of becquerelite mineral phase, including the hydrogen atom positions, was fully optimized in this work. The calculations were performed using theoretical solid-state methods based on density functional theory using plane waves and pseudopotentials.89
The availability of the full unit cell of this mineral allowed the computation of additional important properties as the thermodynamic and mechanic ones. The thermodynamic properties of this uranyl-containing material, including their temperature dependence, were determined by means of phonon calculations performed at the optimized geometry. Once the thermodynamic properties of these materials were known, they were used in order to derive the enthalpy and Gibbs free energy of formation of becquerelite in terms of the elements using the methods developed in recent works.90–92 These thermodynamic properties of formation were then combined with those of other important uranyl-containing materials, dehydrated schoepite (UO2(OH)2), soddyite ((UO2)2(SiO4)·2H2O), rutherfordine (UO2CO3) and gamma uranium trioxide (γ-UO3),90 to study the four reactions:
| 1/6CaO(cr) + UO3(cr) + 11/6H2O(l) → 1/6Ca(UO2)6O4(OH)6·8H2O(cr) | (A) |
| UO3·H2O(cr) + 1/6CaO(cr) + 5/6H2O(l) → 1/6Ca(UO2)6O4(OH)6·8H2O(cr) | (B) |
| UO2CO3(cr) + 1/6CaO(cr) + 11/6H2O(l) → 1/6Ca(UO2)6O4(OH)6·8H2O(cr) + CO2(g) | (C) |
| 1/2(UO2)2(SiO4)·2H2O(cr) + 1/6CaO(cr) + 5/6H2O(l) → 1/6Ca(UO2)6O4(OH)6·8H2O(cr) + 1/2SiO2(cr) | (D) |
These reactions represent the formation of becquerelite mineral in terms of the corresponding oxides and the transformations of dehydrated schoepite, rutherfordine and soddyite minerals into becquerelite, respectively. Since the experimental values of the enthalpies of these important reactions are not known, the computations reported here have permitted to predict the corresponding enthalpies and Gibbs free energies of these reactions for a wide range of temperatures. Once the thermodynamic properties of these reactions were determined, the relative stability of this mineral with respect to the uranyl peroxide hydrates, metastudtite ((UO2)O2·2H2O) and studtite ((UO2)O2·4H2O), in the presence of water and hydrogen peroxide and in the presence of high concentrations of hydrogen peroxide, respectively, was studied by considering the corresponding reactions:
| 1/6Ca(UO2)6O4(OH)6·8H2O(cr) + 1/12H2O(l) + 1/12H2O2(l) + 11/24O2(g) → (UO2)O2·2H2O(cr) + 1/6CaO(cr) | (E) |
| 1/6Ca(UO2)6O4(OH)6·8H2O(cr) + 13/6H2O2(l) → (UO2)O2·4H2O(cr) + 1/6CaO(cr) + 7/12O2(g) | (F) |
Finally, in order to study the important reaction of conversion of becquerelite into studtite93 in detail, the thermodynamic properties of the three additional reactions were also studied:
| 1/6Ca(UO2)6O4(OH)6·8H2O(cr) + 7/6H2O(l) + H2O2(l) → (UO2)O2·4H2O(cr) + 1/6CaO(cr) | (G) |
| 1/6Ca(UO2)6O4(OH)6·8H2O(cr) + 13/12H2O(l) + 13/12H2O2(l) → (UO2)O2·4H2O(cr) + 1/6CaO(cr) + 1/24O2(g) | (H) |
| 1/6Ca(UO2)6O4(OH)6·8H2O(cr) + H2O(l) + 7/6H2O2(l) → (UO2)O2·4H2O(cr) + 1/6CaO(cr) + 1/12O2(g) | (I) |
These results extend previous works91,92 in which the enthalpy and Gibbs free energy of a large series of reactions involving uranyl-containing materials were determined, since the corresponding thermodynamic data and their variation with temperature was obtained for a series of reactions including becquerelite. These temperature dependent properties are a key parameter for the performance assessment of radioactive waste repositories because the stability of the secondary phases of the spent nuclear fuel under final geological disposal conditions is shown to be highly dependent of the temperature.90,91 Furthermore, combining the thermodynamic data obtained with those achieved in previous works,90–92 the relative stability of becquerelite with respect to a subset of the most important secondary phases appearing in the surface of SNF under final geological disposal conditions (dehydrated schoepite, schoepite, metaschoepite, rutherfordine, soddyite, schoepite and metaschoepite) has been investigated.
As it is well known, the correct description of materials containing uranium atom is very complicated.83–85,94–110 The difficulties arise from the large size of the corresponding unit cells and the complex electronic structure of uranium atom, requiring the use of effective potentials for the description of internal electrons and the inclusion of relativistic effects. The complexity is even larger for materials involving uranium in the IV oxidation state, since in this case, standard density functional theory fails significantly especially for thermochemical data.95 In this case, the Hubbard correction or hybrid DFT functionals may be used to improve the description of the strongly correlated f-electrons involved.94,95,100–103 However, this is not the case for materials containing uranium in the VI oxidation state. In this case, there are no electrons in valence f orbitals and the use of the standard GGA approximation supplemented with empirical dispersion corrections has produced highly accurate results for the structural, spectroscopic, mechanic and thermodynamic properties of a large series of uranyl containing minerals as rutherfordine, soddyite, uranophane-α, studtite, metastudtite, γ-UO3, dehydrated schoepite, schoepite and metaschoepite.88,90–92,111–117,104–106 It must be emphasized that the calculated thermodynamic properties of these materials were very accurate in those cases in which experimental values of these properties were available for comparison even at very low and high temperatures.90–92,115,116 As an example, the errors in the computed enthalpies of formation of rutherfordine,90 γ-UO3,90 and metaschoepite92 at 700, 900, and 800 K were 1.6%, 1.0% and 2.0%, respectively. The methodology employed in the present description of becquerelite mineral is essentially the same as in these works and, therefore, a similar accuracy level in the calculated properties reported in this paper may be expected.
This paper is organized as follows. In Section 2, the methods used are described. Section 3 contains the main results of this work. The calculated crystal structure of becquerelite is described in Section 3.1 and the computed X-ray powder pattern is reported in Section 3.2. The thermodynamic properties of this mineral phase are given Section 3.3.1. In Section 3.3.2 the calculated enthalpy and Gibbs free energy of formation of becquerelite in terms of the elements are reported as function of temperature. The enthalpies and Gibbs free energies of reactions (A) to (I) are given in Section 3.3.3. The results allowed to determine the relative stability of becquerelite with respect to a series of the most important secondary phases of the spent nuclear fuel under different conditions91,92 and the corresponding results are provided in Section 3.3.4. The constant of the reaction of dissolution of becquerelite is determined in Section 3.3.5. Finally, the study of the mechanic properties and stability of becquerelite are presented in Section 3.4. The main conclusions are given in Section 4.
2 Methods
2.1 Crystal structure
The theoretical study of the becquerelite mineral was carried out using the CASTEP code,118 a module of the Materials Studio package.119 The DFT-D2 approach, that is the generalized gradient approximation (GGA) together with PBE functional120 and Grimme empirical dispersion corrections,121 was employed. The inclusion of dispersion corrections is required to describe correctly the dense network of hydrogen bonds present in the becquerelite structure. The pseudopotentials used for H, O and Ca atoms in the unit cell of becquerelite mineral were standard norm-conserving pseudopotentials122 given in CASTEP code. The norm-conserving pseudopotential employed for U atom was generated from first principles in previous works.111,112 This pseudopotential includes scalar relativistic effects and has been used extensively in the research of uranyl containing materials.88,90–92,111–117A single unit cell was used in the calculations. The initial guest to the unit cell of becquerelite was taken from Pagoaga et al.48 However, since the hydrogen atom positions were not determined in any of the previous experimental works,47–50 the initial unit cell was supplemented by initial values of these positions and fully optimized. Becquerelite unit cell is very large and involves 236 atoms, 88 of which are hydrogen atoms. The number of valence electrons which must be described explicitly is very large (1184). Geometry optimization was carried out by using the Broyden–Fletcher–Goldfarb–Shanno technique.123 The structure of becquerelite mineral was optimized in calculations with increasing values of the kinetic energy cut-off parameter. A cut-off parameter of 900 eV and a K mesh124 of 1 × 1 × 1 were used to obtain the final thermodynamic and mechanic properties because they gave a well converged energy and structural properties.
2.2 Thermodynamic and mechanic properties
The thermodynamic properties of becquerelite were obtained by performing phonon calculations at the optimized structure, by using the same methodology as in previous studies.90–92,115,116,125 The phonon spectra at the different points of Brillouin zone were calculated using Density Functional Perturbation Theory (DFPT), as second order derivatives of the total energy.126 Several important thermodynamic quantities, such as Gibbs free energy, enthalpy, entropy and specific heat127 can be evaluated in the quasi-harmonic approximation from the knowledge of the entire phonon spectrum and the corresponding phonon dispersion curves and density of states. The methods employed for the calculation of formation thermodynamic properties and Gibbs free energies of reaction were the same as in our previous works.91,92,125The elastic modulus and the corresponding derivatives with respect to pressure for becquerelite mineral were calculated by fitting the lattice volume and associated pressure to a fourth-order Birch–Murnahan equation of state.128 The lattice volumes near the equilibrium geometry were determined by optimizing the structure at several applied pressures with values in the range −1.0 to 12 GPa. EOSFIT 5.2 code129 was used to adjust the results to the chosen equation of state.
The elastic constants required to calculate the mechanical properties and to study the mechanical stability of the crystal structure of becquerelite were obtained from stress–strain relationships. The finite deformation technique is employed in CASTEP for this purpose. In this technique, finite programmed symmetry-adapted strains130 are used to extract the individual constants from the stress tensor obtained as response of the system to the applied strains. This stress-based method appears to be more efficient than the energy-based methods and the use of DFPT technique for the calculation of the elasticity tensor.131
3 Results and discussion
3.1 Crystal structure
The first detailed studies of the structure of becquerelite were carried out by Piret-Meunier and Piret47 in 1982 and Pagoaga et al.48 in 1985. The refined structure of Burns and Li50 confirmed the structures and connectivities proposed by these authors. The precision of the structure was substantially improved because the refinement was performed with modern data collected for a high-quality crystal using a CCD-based area detector. However, up to date, it has not been possible to determine the positions of the hydrogen atoms in the unit cell of becquerelite mineral from X-ray diffraction data by structure refinement. These positions were optimized theoretically in this work. The calculated crystal structure of becquerelite is shown in Fig. 1 and 2.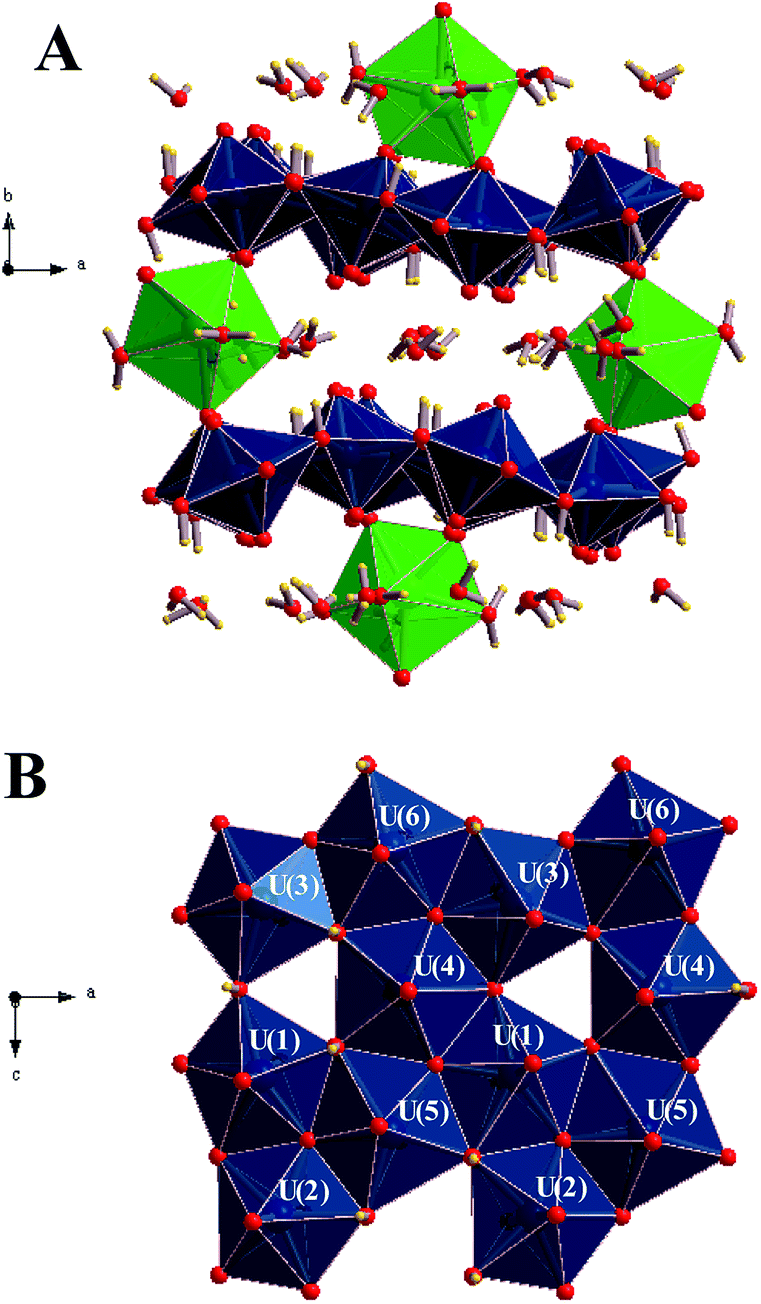 | ||
| Fig. 1 Structure of becquerelite mineral: (A) view of the full unit cell from [001] direction; (B) view of a becquerelite sheet from [010] direction. Colour code: U-Blue, Ca-Green, O-Red, H-Yellow. | ||
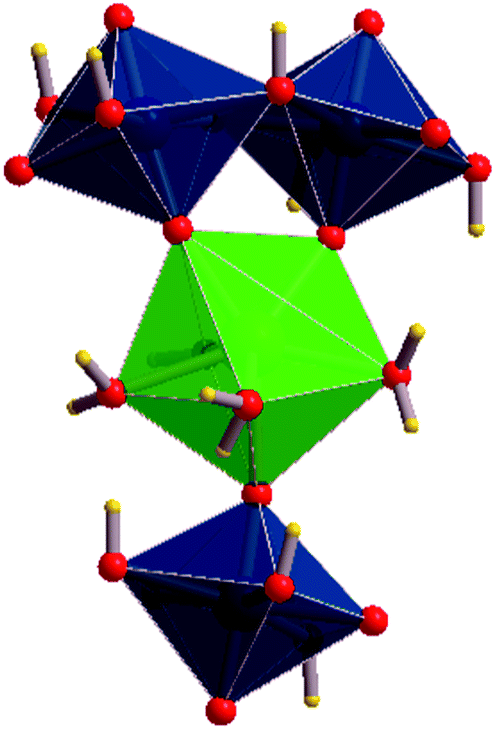 | ||
| Fig. 2 Coordination structure of a calcium atom. Each Ca atom is coordinated by four oxygen atoms from interlayer water molecules and three apical oxygen atoms belonging to uranyl polyhedra. In this case, two of the three apical oxygen atoms are from the upper layer and one is from the lower one. | ||
As it may be seen, the structure contains six symmetrically inequivalent uranium atoms (see Fig. 1B). The uranium atoms display pentagonal bipyramid coordination (see Fig. 1A). Each uranium cation is coordinated by two apical oxygen ions forming the uranyl cation, UO22+, and by five additional anions (two O2− and three OH−) arranged in the equatorial corners of the pentagonal bypiramid. The pentagonal coordination around the uranyl cations in uranyl oxide hydrates was predicted by Evans in 1963.132 The uranyl polyhedra in becquerelite share equatorial edges and vertices forming infinite sheets parallel to plane {010} as shown in Fig. 1B. The structure is based upon the α-U3O8 (protasite) anion topology.48,50,133–135 Other minerals exhibiting topologically equivalent sheets of uranyl polyhedra are compreignacite, billietite, masuyite, agrinierite, richetite and protasite.48,69–73
There are eight symmetrically inequivalent water molecules in the space between the sheets within becquerelite structure. The unit cell contains a single symmetrically equivalent interlayer Ca2+ cation which is coordinated by three uranyl oxygen ions of the upper and lower uranyl layers (see Fig. 2), and four interlayer water molecules. There is a fourth uranyl oxygen atom which is also near to the calcium ions, but the corresponding CaO distance is close to 3.0 Å, being about 0.5 Å larger than the remaining CaO distances. The four water molecules forming part of the coordination structure of the calcium cation may be described as crystallization water molecules. The remaining four water molecules are free water, which are held together to the structure by hydrogen bonding.
The lattice parameters of becquerelite, as well as the volume and density, were determined in calculations with increasing kinetic energy cutoffs. The optimizations performed with a cutoff of 900 eV gave a well converged structure and were considered sufficient to determine the final material properties. Table 1 gives the final lattice parameters, volumes and densities. The errors in the computed volume and density with respect to those of Burns and Li50 are very small, about 0.4%. It must be noted that while the structure excluding the hydrogen atoms exhibits orthorhombic space symmetry47–50 (space group Pn21a), the symmetry is lost if the hydrogen atoms are included. The final calculations were performed using triclinic symmetry (P1 space group), since no one higher symmetry was found for the optimized structure.
The calculated atomic bond lengths are given in Table 2. The atom numbering convention used in the table is that of Burns and Li.50 The uranyl oxygen atoms located at the apical positions of the bipyramids have UO bond lengths in the order of 1.77 to 1.82 Å.50 These distances are within the range 1.71 to 1.91 Å in the study of Pagoaga et al.,48 and from 1.76 to 1.93 Å in that of Piret-Meunier and Piret.47 The range for the distances calculated in this work, 1.79 to 1.84 Å, is in very good agreement with that of the study of Burns and Li.50 The experimental average equatorial UO distances are in the range50 from 2.37 to 2.42 Å, and the calculated one is from 2.39 to 2.42 Å. These values are similar to the average value of 2.37 Å for this kind of distances obtained by Burns et al.44 from a large set of well-defined structures of uranyl containing materials. The calculated values of the seven calculated CaO distances (see Table 2) lead to an average value of 2.44 Å which compares very well with the values of Burns and Li50 and Pagoaga et al.,48 2.45 and 2.46 Å, respectively.
| Bond | Exp.48 | Exp.50 | Calc. | Bond | Exp.48 | Exp.50 | Calc. |
|---|---|---|---|---|---|---|---|
| U1 | U4 | ||||||
| U1–O2 | 1.81(4) | 1.77(1) | 1.819 | U4–O8 | 1.77(3) | 1.792(9) | 1.789 |
| U–O1 | 1.91(4) | 1.80(1) | 1.835 | U4–O7 | 1.83(3) | 1.799(9) | 1.816 |
| U(1)–O13 | 2.20(6) | 2.23(1) | 2.213 | U4–O16 | 2.20(8) | 2.21(1) | 2.247 |
| U(1)–O14 | 2.31(7) | 2.23(1) | 2.229 | U4–O14 | 2.33(8) | 2.24(1) | 2.255 |
| U(1)–OH3 | 2.29(8) | 2.39(1) | 2.411 | U4–OH6 | 2.35(10) | 2.37(1) | 2.402 |
| U(1)–OH2 | 2.38(9) | 2.51(2) | 2.463 | U4–OH3 | 2.45(10) | 2.46(1) | 2.406 |
| U(1)–OH1 | 2.53(8) | 2.64(1) | 2.623 | U4–OH2 | 2.61(4) | 2.602(8) | 2.772 |
| Aver. U–Oeq. | 2.34 | 2.40 | 2.388 | Aver. U–Oeq. | 2.39 | 2.38 | 2.416 |
| U2 | U5 | ||||||
| U2–O4 | 1.80(3) | 1.786(9) | 1.803 | U5–O10 | 1.71(5) | 1.78(1) | 1.801 |
| U2–O3 | 1.86(4) | 1.79(1) | 1.825 | U5–O9 | 1.79(4) | 1.79(1) | 1.832 |
| U2–O15 | 2.28(6) | 2.23(1) | 2.250 | U5–O14 | 2.14(8) | 2.23(1) | 2.233 |
| U2–O13 | 2.39(7) | 2.24(1) | 2.262 | U5–O13 | 2.29(5) | 2.25(1) | 2.234 |
| U2–OH5 | 2.42(8) | 2.41(1) | 2.417 | U5–OH4 | 2.45(14) | 2.40(2) | 2.390 |
| U2–OH1 | 2.47(8) | 2.43(1) | 2.428 | U5–OH1 | 2.47(7) | 2.43(1) | 2.405 |
| U2–OH4 | 2.70(4) | 2.64(1) | 2.667 | U5–OH3 | 2.58(10) | 2.66(1) | 2.751 |
| Aver. U–Oeq. | 2.45 | 2.39 | 2.405 | Aver. U–Oeq. | 2.45 | 2.39 | 2.403 |
| U3 | U6 | ||||||
| U3–O6 | 1.74(4) | 1.79(1) | 1.798 | U6–O11 | 1.83(5) | 1.79(1) | 1.817 |
| U3–O5 | 1.77(4) | 1.82(1) | 1.831 | U6–O12 | 1.86(4) | 1.82(1) | 1.833 |
| U3–O16 | 2.06(6) | 2.23(1) | 2.218 | U6–O15 | 2.21(8) | 2.23(1) | 2.226 |
| U3–O15 | 2.20(6) | 2.23(1) | 2.266 | U6–O16 | 2.23(6) | 2.25(1) | 2.243 |
| U3–OH6 | 2.42(9) | 2.39(1) | 2.405 | U6–OH5 | 2.32(7) | 2.40(1) | 2.373 |
| U3–OH2 | 2.58(8) | 2.41(2) | 2.447 | U6–OH4 | 2.32(14) | 2.41(2) | 2.399 |
| U3–OH5 | 2.61(8) | 2.61(1) | 2.612 | U6–OH6 | 2.82(11) | 2.80(1) | 2.642 |
| Aver. U–Oeq. | 2.37 | 2.40 | 2.390 | Aver. U–Oeq. | 2.38 | 2.42 | 2.403 |
| Ca | |||||||
| Ca–OW3 | 2.41(11) | 2.36(2) | 2.301 | Ca–OW2 | 2.42(7) | 2.45(1) | 2.480 |
| Ca–O12 | 2.33(5) | 2.37(1) | 2.358 | Ca–OW1 | 2.51(7) | 2.47(1) | 2.519 |
| Ca–O1 | 2.45(4) | 2.44(1) | 2.423 | Ca–OW4 | 2.62(7) | 2.58(1) | 2.529 |
| Ca–O5 | 2.45(5) | 2.45(1) | 2.480 | Aver. Ca–O | 2.45 | 2.45 | 2.441 |
As it has been mentioned, it was not possible to locate the hydrogen atom positions from X-ray diffraction data by structure refinement, as usual in uranyl containing systems. However, the interlayer hydrogen bonding in becquerelite was rationalized by Burns and Li50 from the locations of the O atoms in the sheets, the O atoms of the H2O groups and crystal chemical considerations. However, some uncertainties remained concerning the hydrogen bonding of the free water molecules. The present results provide the locations for the hydrogen atoms in the full unit cell. The calculated atomic positions resulting from our calculations are given as ESI† in an independent file of CIF (Crystallographic Information File) type. The precise positions of the hydrogen atoms provide a view of the hydrogen bonding in becquerelite in accordance with the one reported by Burns and Li,50 allowing to resolve the ambiguities encountered since permit to discriminate among the hydrogen bonds proposed by these authors. The parameters associated to hydrogen bonds donated by the free water molecules (W5, W6 and W7) are reported in Table 3. The hydrogen bonding structure involving W8 is unambiguous. All the other possible hydrogen bonds from W5, W6 and W7 proposed by Burns and Li50 should not form. As it can be seen, the O atom in W5 is donor of three hydrogen bonds with the uranyl oxygens O9, O11 and O2. Similarly, the O atom in W6 is donor of two hydrogen bonds, one with the uranyl oxygen O7 and another with the O atom in W7. Finally, the O atom in W7 is donor of three hydrogen bonds with the uranyl oxygens O7, O11 and O2.
| Water molecule | Hydrogen bond (A–H⋯B) | D (A–H) | D (H⋯B) | α (A–H⋯B) |
|---|---|---|---|---|
| W5 | OW5–H5A⋯O9 | 0.974 | 2.254 | 163.3 |
| OW5–H5B⋯O11 | 0.977 | 2.215 | 136.3 | |
| OW5–H5B⋯O2 | 0.977 | 2.282 | 111.1 | |
| W6 | OW6–H6A⋯O7 | 0.978 | 1.809 | 162.7 |
| OW6–H6B···OW7 | 0.981 | 1.884 | 159.6 | |
| W7 | OW7–H7A⋯O7 | 0.982 | 1.843 | 169.1 |
| OW7–H7A⋯O11 | 0.975 | 2.127 | 146.8 | |
| OW7–H7A⋯O2 | 0.975 | 2.407 | 111.7 |
3.2 X-Ray powder pattern
The X-ray powder diffractogram of becquerelite was calculated from the computed and experimental50 structures using software REFLEX included in Materials Studio package,119 with CuKα radiation (λ = 1.540598 Å). The results are compared in Fig. 3. The agreement of the computed and experimental diffractograms is very good. A detailed comparison of the computed and experimental X-ray powder patterns of becquerelite is given in Table 4, where the positions and intensities of the lines in the patterns obtained from the computed and experimental geometries of Pagoaga48 and Burns and Li50 are given. The comparison between the patterns derived directly from the structures is free of interferences, as the experimental conditions, or possible artefacts, as the presence of impurities. The agreement in line positions and intensities is very good. Nevertheless, the use of an experimental pattern also leads to an excellent agreement. Computer program XPowder136 using the PDF-2 database137 recognizes the computed spectrum as that of becquerelite (pattern 84-1505 corresponding to a natural specimen from Shaba, Zaire). The corresponding values of the main reflections are also given in Table 4.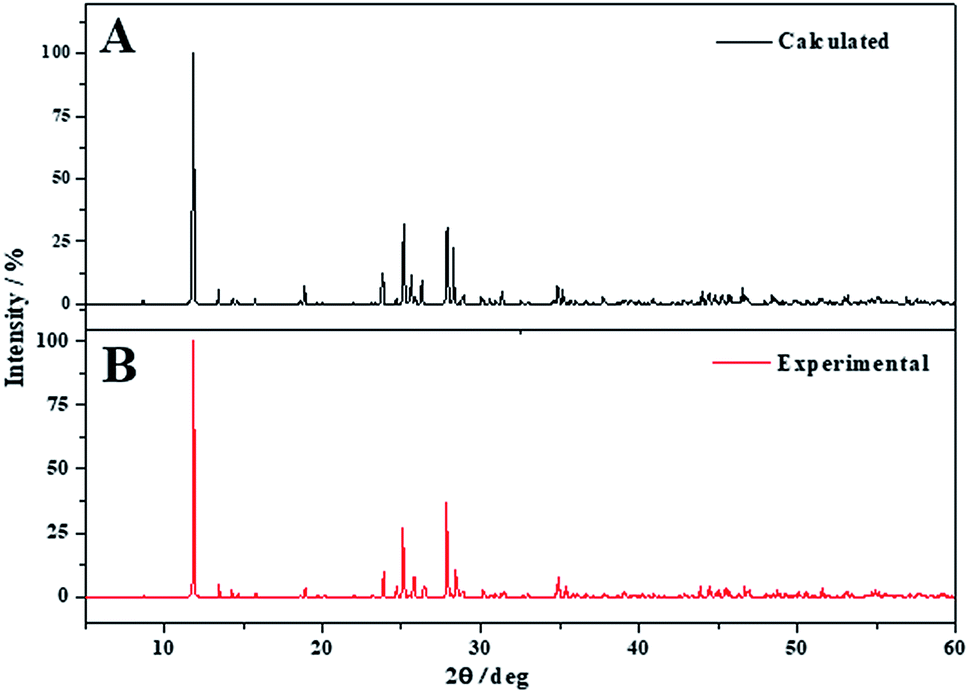 | ||
| Fig. 3 X-ray powder pattern diffractogram of becquerelite using CuKα radiation: (A) X-ray powder pattern computed from calculated geometry; (B) X-ray powder pattern computed from experimental geometry.50 | ||
| Experimental (a) | Experimental (b) | Experimental (c) | Theoretical (d) | |||||||||
|---|---|---|---|---|---|---|---|---|---|---|---|---|
| 2Θ | d (Å) | I (%) | [hkl] | 2Θ | d (Å) | I (%) | 2Θ | d (Å) | I (%) | 2Θ | d (Å) | I (%) |
| 11.85 | 7.462 | 100.0 | [002] | 11.85 | 7.462 | 100.0 | 11.85 | 7.465 | 100.0 | 11.82 | 7.480 | 100.0 |
| 13.47 | 6.568 | 6.5 | [102] | 13.47 | 6.568 | 6.598 | 13.46 | 6.571 | 6.453 | 13.43 | 6.583 | 5.262 |
| 23.83 | 3.731 | 14.1 | [004] | 23.83 | 3.731 | 17.191 | 23.82 | 3.732 | 17.126 | 23.77 | 3.740 | 18.277 |
| 24.69 | 3.603 | 4.3 | [104] | 24.69 | 3.603 | 5.017 | 24.68 | 3.604 | 4.782 | 24.63 | 3.612 | 3.450 |
| 25.11 | 3.543 | 29.0 | [230] | 25.11 | 3.544 | 35.670 | 25.08 | 3.548 | 35.936 | 25.11 | 3.544 | 40.686 |
| 25.73 | 3.459 | 11.0 | [400] | 25.73 | 3.460 | 13.086 | 25.70 | 3.463 | 12.245 | 25.57 | 3.481 | 13.968 |
| 26.43 | 3.369 | 7.4 | [401] | 26.43 | 3.370 | 8.186 | 26.40 | 3.374 | 7.965 | 26.26 | 3.391 | 7.298 |
| 27.85 | 3.201 | 35.7 | [232] | 27.85 | 3.201 | 45.579 | 27.82 | 3.204 | 45.275 | 27.84 | 3.203 | 47.816 |
| 28.41 | 3.139 | 13.6 | [402] | 28.42 | 3.139 | 17.401 | 28.39 | 3.142 | 17.517 | 28.25 | 3.156 | 20.460 |
| 30.17 | 2.960 | 4.0 | [421] | 30.17 | 2.960 | 4.940 | 30.14 | 2.963 | 4.932 | 30.04 | 2.972 | 4.596 |
| 34.89 | 2.569 | 8.6 | [234] | 34.89 | 2.569 | 11.672 | 34.86 | 2.571 | 11.792 | 34.85 | 2.573 | 12.736 |
| 35.35 | 2.537 | 4.2 | [440] | 35.36 | 2.537 | 5.447 | 35.33 | 2.539 | 5.329 | 35.19 | 2.548 | 5.700 |
| — | — | — | [060] | 43.85 | 2.063 | 5.087 | 43.79 | 2.066 | 5.206 | 43.95 | 2.058 | 5.433 |
| — | — | — | [236] | 44.47 | 2.036 | 4.945 | 44.43 | 2.037 | 4.780 | 44.39 | 2.039 | 4.460 |
| — | — | — | [631] | 45.42 | 1.995 | 6.740 | 45.37 | 1.997 | 6.650 | 45.22 | 2.004 | 6.568 |
| — | — | — | [062] | 45.59 | 1.988 | 4.800 | 45.53 | 1.991 | 4.824 | 45.66 | 1.985 | 5.516 |
| — | — | — | [632] | 46.70 | 1.944 | 6.212 | 46.64 | 1.946 | 6.211 | 46.49 | 1.951 | 8.056 |
3.3 Thermodynamic properties
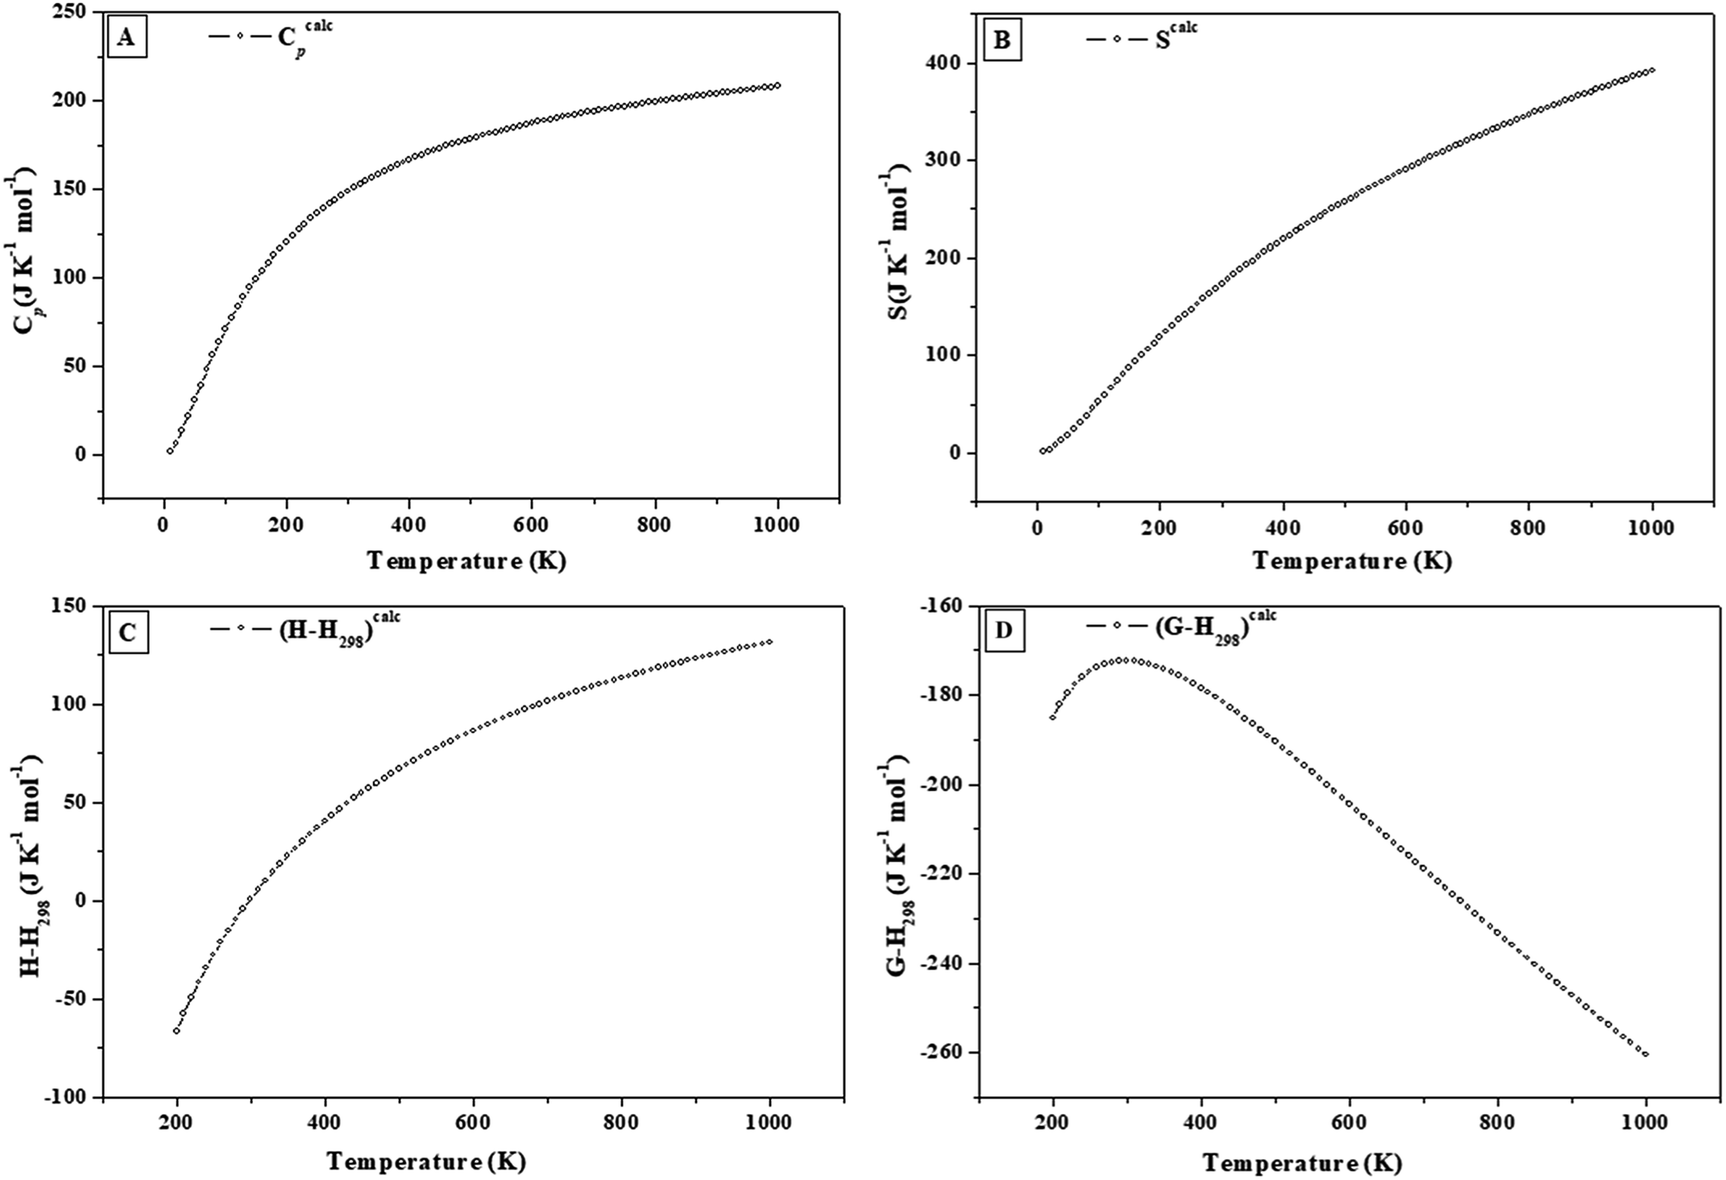 | ||
| Fig. 4 Calculated heat capacity, entropy, enthalpy and Gibbs free energy functions of becquerelite. | ||
Since most of the thermodynamic properties of becquerelite have not been determined experimentally, their values were predicted. The calculated values of the isobaric specific heat and entropy at 298.15 K are Cp = 148.40 J K−1 mol−1 and S = 172.34 J K−1 mol−1. The calculated value of the entropy is higher than the value reported by Shvareva et al.,138 S = 140.78 J K−1 mol−1, by 12.5%. However, this last value is only an estimate deduced from measured values of the enthalpy and free energy of formation. The calculated isobaric specific heat at the last temperature considered in the present work (1000 K), Cp = 208.21 J K−1 mol−1, is 15.1% below the corresponding Dulong–Petit asymptotic value (Cp = 245.27 J K−1 mol−1).
3.3.2.a Standard state. The precise value of the standard state enthalpy of formation used in our computations is the value reported by Kubatko et al.,139 ΔfH0 = −1898.2 ± 2.3 kJ mol−1. By using the calculated values of the thermodynamic properties of becquerelite, we obtained the value for the free energy of formation at 298.15 K, ΔfG0 = −1708.18 kJ mol−1, which differs from the experimental value given by Gorman-Lewis et al.,140 ΔfG0 = −1717.6 ± 4.42 kJ mol−1, by only about 0.5%. For comparison, a previous estimate of the standard state free energy of formation reported by Chen et al.141–143 is ΔfG0 = −1720.8 ± 5 kJ mol−1, which deviates from the experimental value by about 0.2%.
3.3.2.b. Enthalpy and Gibbs free energy of formation. By using the computed values of the thermodynamic properties of becquerelite, the enthalpy of formation at the standard state reported by Kubatko et al.139 and the experimental values of the experimental thermodynamic properties of the elements,144,145 we obtained the enthalpies and Gibbs free energies of formation and the associated reaction constants of becquerelite as a function of temperature, reported in Table 5 and displayed in Fig. 5.
![[thin space (1/6-em)]](https://www.rsc.org/images/entities/char_2009.gif) K) of becquerelite as a function of temperature. The values of ΔfH and ΔfG are in units of kJ mol−1
K) of becquerelite as a function of temperature. The values of ΔfH and ΔfG are in units of kJ mol−1
| T (K) | ΔfH | ΔfG | logK |
|---|---|---|---|
| 298.15 | −1898.20 | −1708.18 | 299.26 |
| 10 | −4490.74 | −4488.98 | 23447.44 |
| 50 | −2380.74 | −2356.47 | 2461.72 |
| 100 | −2104.13 | −2042.30 | 1066.76 |
| 200 | −1952.03 | −1824.12 | 476.40 |
| 300 | −1897.57 | −1706.36 | 297.10 |
| 350 | −1883.69 | −1660.30 | 247.78 |
| 400 | −1874.26 | −1619.02 | 211.42 |
| 450 | −1868.05 | −1581.24 | 183.54 |
| 500 | −1864.24 | −1546.02 | 161.51 |
| 550 | −1862.33 | −1512.88 | 143.68 |
| 600 | −1861.93 | −1481.41 | 128.97 |
| 650 | −1862.75 | −1451.27 | 116.62 |
| 700 | −1864.66 | −1422.25 | 106.13 |
| 750 | −1867.51 | −1394.15 | 97.10 |
| 800 | −1871.14 | −1366.85 | 89.24 |
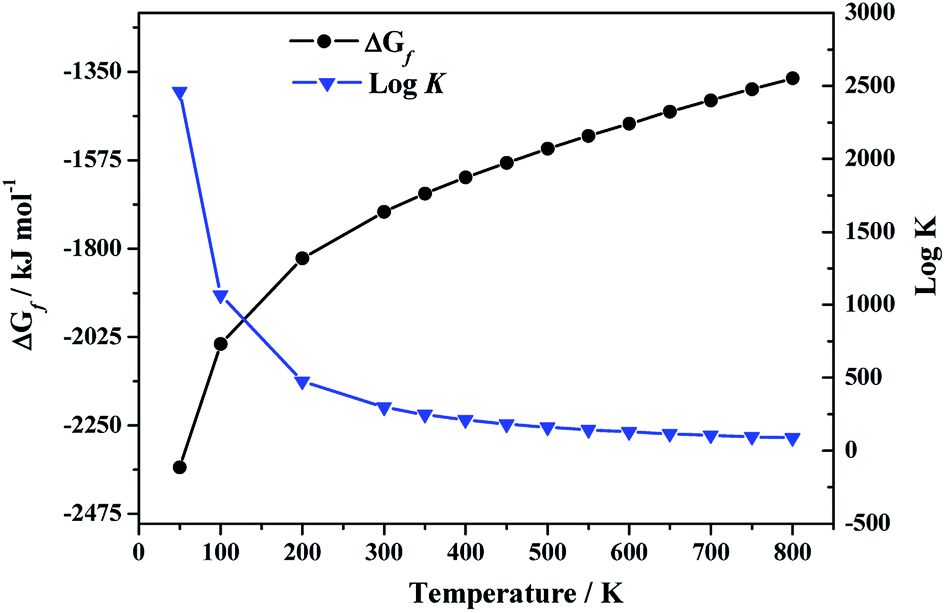 | ||
| Fig. 5 Calculated Gibbs free energies of formation and associated reaction constants of becquerelite as a function of temperature. | ||
3.3.3.a Reactions (A) to (D). The calculated thermodynamic properties of formation of becquerelite, given in the Section 3.3.2.b, were combined with those of other important uranyl-containing materials (gamma uranium trioxide, dehydrated schoepite, rutherfordine and soddyite), reported in our previous work,90 to study the reactions (A) to (D) of the Introduction section involving becquerelite and these materials. These reactions represent the formation of becquerelite in terms of the corresponding oxides and the transformations of dehydrated schoepite, rutherfordine and soddyite minerals into becquerelite, respectively. The methods used to determine the enthalpies and Gibbs free energies and associated reaction constants of these reactions were described in a previous article.91 The experimental thermodynamic data for the non-uranyl containing materials involved in these reactions were taken from JANAF tables.144 The results are given in Table 6 and displayed in Fig. 6.
K) of reactions (A) to (D). The values of ΔrH and ΔrG are in units of kJ mol−1
| T (K) | ΔrH | ΔrG | logK |
ΔrH | ΔrG | logK |
|---|---|---|---|---|---|---|
| Reaction (A) | Reaction (B) | |||||
| 298.15 | −44.50 | −28.03 | 4.91 | −19.61 | −14.39 | 2.52 |
| 280 | −46.38 | −32.25 | 6.02 | −20.90 | −16.54 | 3.09 |
| 300 | −44.33 | −27.62 | 4.81 | −19.49 | −14.19 | 2.47 |
| 320 | −42.75 | −23.43 | 3.82 | −18.42 | −12.15 | 1.98 |
| 340 | −41.57 | −19.59 | 3.01 | −17.60 | −10.34 | 1.59 |
| 360 | −40.55 | −15.85 | 2.30 | −16.92 | −8.64 | 1.25 |
| 380 | −40.19 | −12.72 | 1.75 | −16.58 | −7.24 | 1.00 |
| 400 | −39.91 | −9.63 | 1.26 | −16.31 | −5.90 | 0.77 |
| 420 | −39.87 | −6.71 | 0.83 | −16.17 | −4.65 | 0.58 |
| 440 | −40.06 | −3.96 | 0.47 | −16.17 | −3.51 | 0.42 |
| 460 | −40.47 | −1.36 | 0.15 | −16.30 | −2.45 | 0.28 |
| 480 | −41.10 | 1.11 | −0.12 | −16.54 | −1.47 | 0.16 |
| 500 | −41.94 | 3.46 | −0.36 | −16.90 | −0.56 | 0.06 |
| Reaction (C) | Reaction (D) | |||||
| 298.15 | 42.30 | 9.97 | −1.75 | 13.16 | 21.97 | −3.85 |
| 280 | 42.16 | 10.47 | −1.95 | 13.33 | 20.95 | −3.91 |
| 300 | 42.30 | 9.91 | −1.73 | 13.14 | 22.07 | −3.84 |
| 320 | 42.21 | 9.19 | −1.50 | 12.85 | 23.12 | −3.77 |
| 340 | 41.95 | 8.35 | −1.28 | 12.50 | 24.15 | −3.71 |
| 360 | 41.72 | 7.61 | −1.10 | 12.21 | 25.24 | −3.66 |
| 380 | 41.00 | 6.44 | −0.89 | 11.72 | 26.17 | −3.60 |
| 400 | 40.33 | 5.40 | −0.70 | 11.28 | 27.19 | −3.55 |
| 420 | 39.55 | 4.30 | −0.54 | 10.82 | 28.20 | −3.51 |
| 440 | 38.64 | 3.17 | −0.38 | 10.32 | 29.21 | −3.47 |
| 460 | 37.60 | 1.99 | −0.23 | 9.80 | 30.22 | −3.43 |
| 480 | 36.44 | 0.78 | −0.09 | 9.23 | 31.23 | −3.40 |
| 500 | 35.12 | −0.45 | 0.05 | 8.62 | 32.25 | −3.37 |
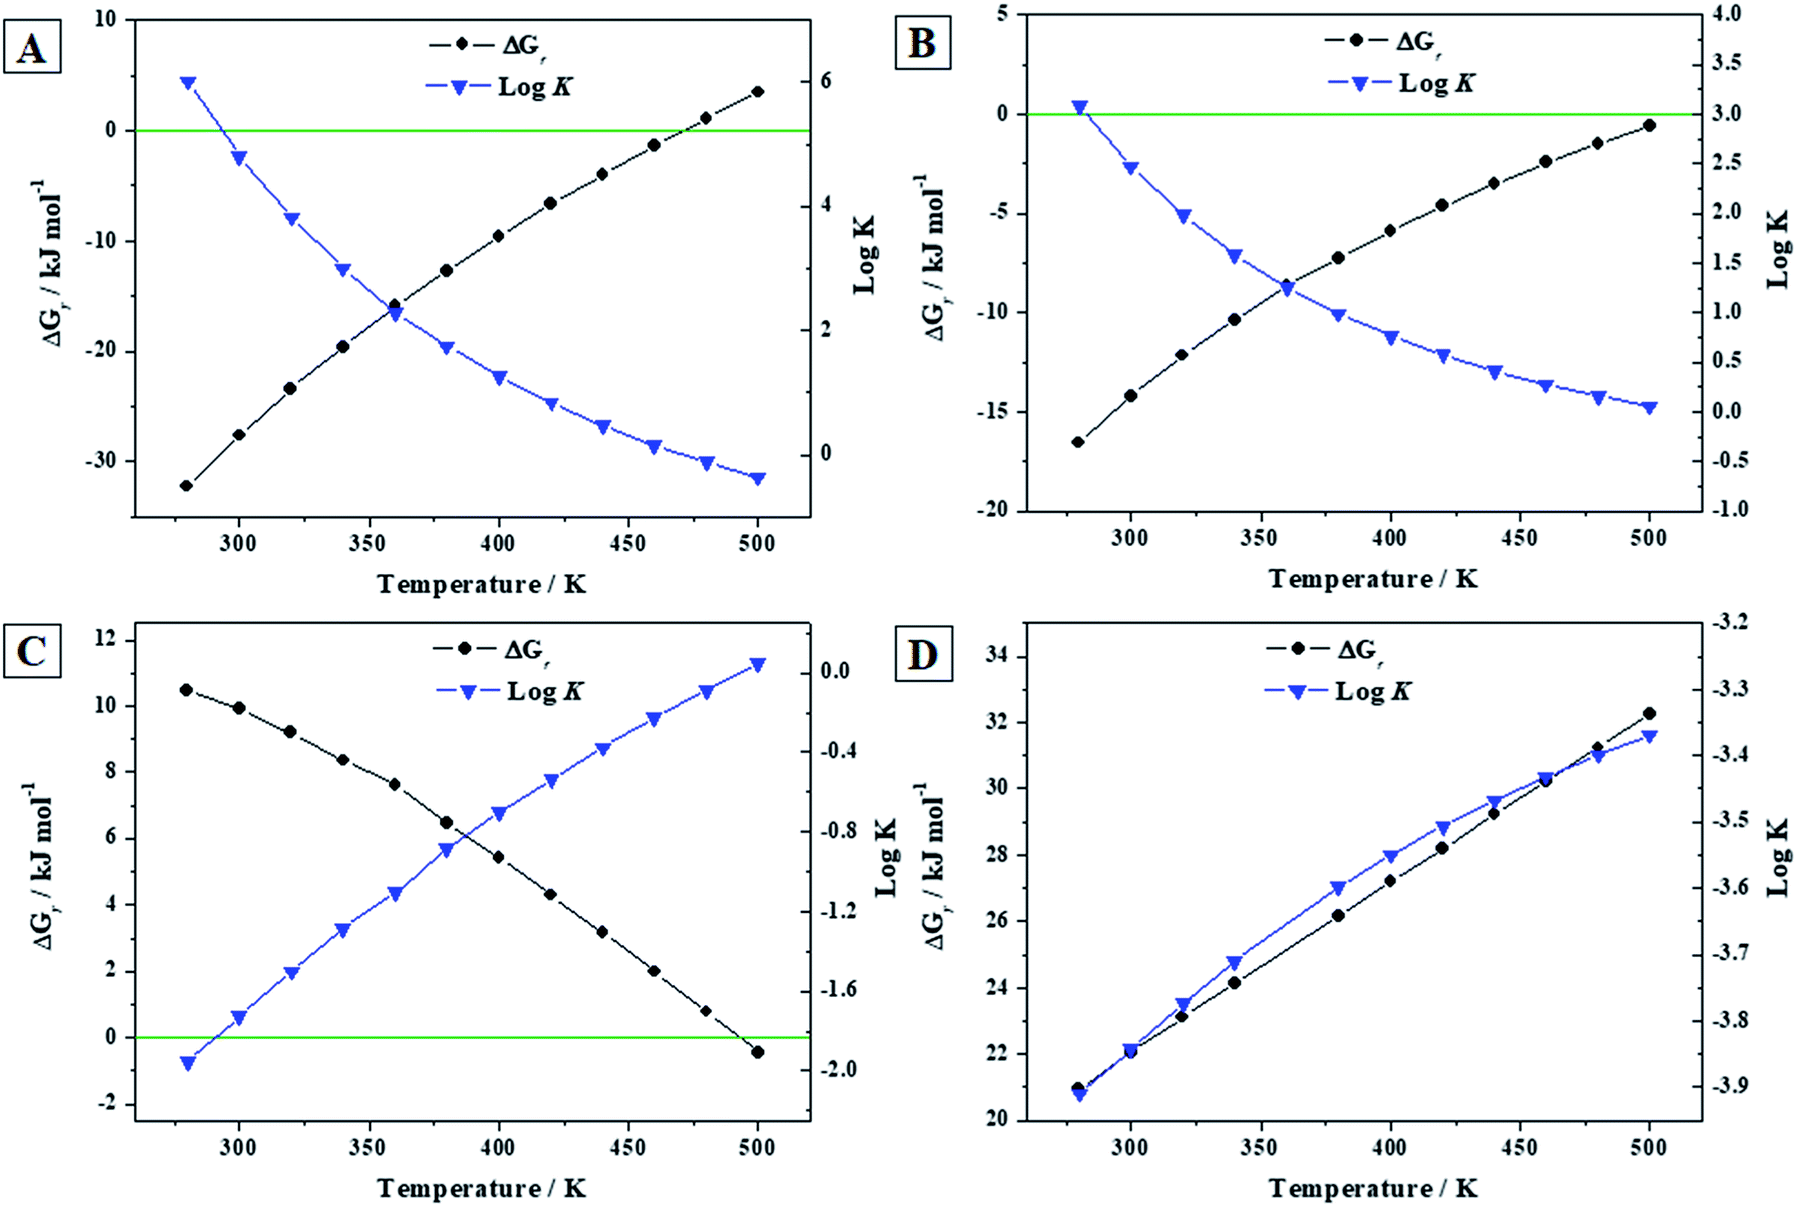 | ||
| Fig. 6 Calculated Gibbs free energies of formation and associated reaction constants of reactions (A) to (D) as a function of temperature. | ||
Becquerelite mineral becomes unstable with respect to the corresponding oxides at a temperature of 218 °C (491 ± 1 K) as it can be seen in Fig. 6A. The error estimate in this temperature is due to the error margin in the experimental value of the enthalpy of formation of becquerelite mineral,139 ΔfH0 = −1898.2 ± 2.3 kJ mol−1 (see Section 3.3.2.a). Similarly, as it can be appreciated in Fig. 6B, the temperature of transformation of becquerelite mineral into dehydrated schoepite is 239 °C (512 ± 25 K). Becquerelite will transform in the presence of carbon dioxide into rutherfordine at temperatures lower than 219 °C (492 ± 37 K). Similarly, becquerelite is predicted to transform in the presence of SiO2 into soddyite for the full range of temperatures considered. The error estimates in the temperatures at which the changes of the stability of becquerelite are found, are of the same order as those found in our previous work.91
3.3.3.b Reactions (E) and (F). As in the previous section, the calculated thermodynamic properties of formation of becquerelite, given in Section 3.3.2.b, were combined with those of metastudtite and studtite reported in our previous work90 to study the reactions (E) and (F) of the Introduction section. Reaction (E) represents the transformation of becquerelite into metastudtite in the presence of water and hydrogen peroxide, and reaction (F) represents the corresponding transformation into studtite in the presence of hydrogen peroxide and absence of water. The last situation is very important since is the one expected under high radiation fields causing the radiolysis of most of the water reaching the surface of the spent nuclear fuel. The thermodynamic experimental data for the non-uranyl systems needed to determine the enthalpies and Gibbs free energies of these reactions were taken from JANAF tables,144 except those of hydrogen peroxide which were taken from Barin.145 The results are given in Table 7 and displayed in Fig. 7. Note that liquid hydrogen peroxide is stable up to 500 K,145 the larger temperature for which the thermodynamic properties of these reactions have been studied. Additionally, the temperature range considered covers the full range of temperatures expected for a radioactive waste disposal146,147 (the temperature is expected to be at most about 475 K).
K) of reactions (E) to (F). The values of ΔrH and ΔrG are in units of kJ mol−1
| T (K) | ΔrH | ΔrG | logK |
ΔrH | ΔrG | logK |
|---|---|---|---|---|---|---|
| Reaction (E) | Reaction (F) | |||||
| 298.15 | 52.14 | 80.68 | −14.13 | −145.49 | −130.09 | 22.58 |
| 300 | 52.20 | 80.92 | −14.09 | −145.37 | −129.70 | 20.49 |
| 320 | 52.78 | 83.52 | −13.63 | −144.20 | −125.51 | 18.68 |
| 340 | 53.32 | 86.05 | −13.22 | −143.30 | −121.56 | 17.10 |
| 360 | 53.79 | 88.51 | −12.84 | −142.66 | −117.84 | 15.72 |
| 380 | 54.17 | 90.87 | −12.49 | −142.26 | −114.34 | 14.50 |
| 400 | 54.49 | 93.16 | −12.17 | −142.08 | −111.06 | 13.43 |
| 420 | 54.76 | 95.39 | −11.86 | −142.10 | −107.96 | 12.47 |
| 440 | 54.98 | 97.56 | −11.58 | −142.30 | −105.03 | 11.61 |
| 460 | 55.15 | 99.68 | −11.32 | −142.68 | −102.26 | 10.84 |
| 480 | 55.30 | 101.77 | −11.07 | −143.22 | −99.61 | 10.14 |
| 500 | 55.41 | 103.83 | −10.85 | −143.93 | −97.09 | 10.14 |
 | ||
| Fig. 7 Calculated Gibbs free energies of formation and associated reaction constants of reactions (E) to (F) as a function of temperature. | ||
Since the Gibbs free energies of reaction (E) are positive everywhere (see Fig. 7E), becquerelite will not transform spontaneously into metastudtite in the presence of water and hydrogen peroxide. Therefore, becquerelite, as other uranyl oxide hydrate phases as schoepite and metaschoepite,92 is very stable under the presence of water and hydrogen peroxide becoming more stable than metastudtite. The opposite behavior is observed for reaction (F). In this case the Gibbs free energies of reaction are negative within the full range of temperature considered (see Fig. 7F) and, consequently, becquerelite phase will be converted into studtite under high hydrogen peroxide concentrations. This means that the stabilization of becquerelite under these conditions is not as large as that of studtite phase.
As it was observed experimentally by Kubatko et al.93 and Forbes et al.,148 becquerelite, dehydrated schoepite and soddyite readily transform into studtite in the presence of high hydrogen peroxide concentrations. The transformation of uranium trioxide, rutherfordine, metastudtite, schoepite and metaschoepite into studtite was also predicted in our previous works.91,92 The transformation of becquerelite into studtite under the presence of hydrogen peroxide will be studied in more detail in the next section.
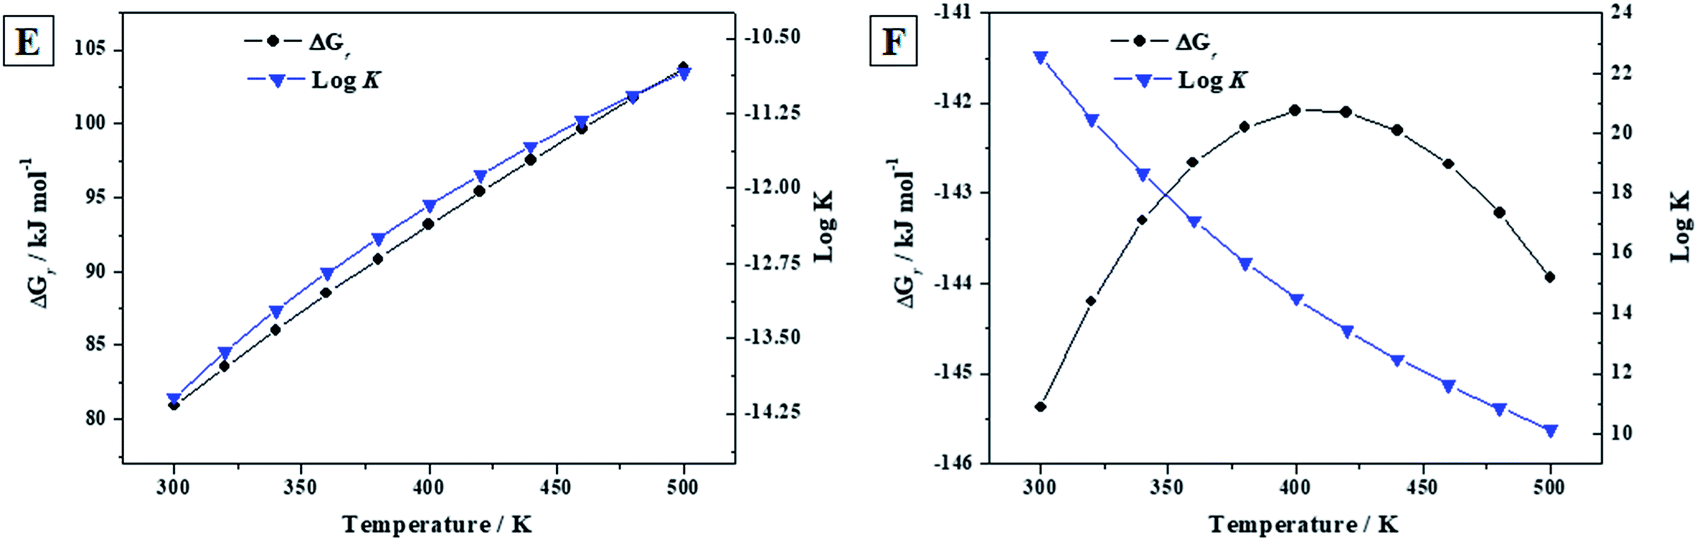
3.3.3.c Transformation of becquerelite into studtite. Reactions (G) to (I). The reactions (G) to (I) represent the transformation of becquerelite into studtite under the presence of increasing concentrations of hydrogen peroxide. The water to hydrogen peroxide ratios associated to these reactions are τ = 7
:6, 1:1, and 6:7, respectively. The enthalpies and Gibbs free energies and associated reaction constants of these reactions for the range of temperatures from 300 to 500 K, are given in Table 8. The corresponding enthalpies and free-energies of reaction are displayed in Fig. 8.
K) of reactions (G) to (I). The values of ΔrH and ΔrG are in units of kJ mol−1
| T (K) | ΔrH | ΔrG | logK |
ΔrH | ΔrG | logK |
ΔrH | ΔrG | logK |
|---|---|---|---|---|---|---|---|---|---|
| Reaction (G) [τ = 7:6] |
Reaction (H) [τ = 1:1] |
Reaction (I) [R = 6:7] |
|||||||
| 298.15 | −186.60 | 37.13 | −6.50 | −214.35 | −21.28 | 3.73 | −204.97 | −79.69 | 13.96 |
| 300 | −185.89 | 40.33 | −7.02 | −216.77 | −18.14 | 3.16 | −207.33 | −76.60 | 13.34 |
| 320 | −178.99 | 74.22 | −12.12 | −243.13 | 15.13 | −2.47 | −233.05 | −43.96 | 7.18 |
| 340 | −173.70 | 106.76 | −16.40 | −269.75 | 47.04 | −7.23 | −259.03 | −12.69 | 1.95 |
| 360 | −169.32 | 138.62 | −20.11 | −296.58 | 78.21 | −11.35 | −285.22 | 17.81 | −2.58 |
| 380 | −167.87 | 167.75 | −23.06 | −323.61 | 106.76 | −14.67 | −311.60 | 45.77 | −6.29 |
| 400 | −167.17 | 196.33 | −25.64 | −350.83 | 134.71 | −17.59 | −338.16 | 73.09 | −9.54 |
| 420 | −167.79 | 223.80 | −27.83 | −378.25 | 161.54 | −20.09 | −364.91 | 99.29 | −12.35 |
| 440 | −169.66 | 250.27 | −29.71 | −405.91 | 187.38 | −22.24 | −391.89 | 124.49 | −14.78 |
| 460 | −172.71 | 275.86 | −31.32 | −433.85 | 212.33 | −24.11 | −419.13 | 148.80 | −16.90 |
| 480 | −176.89 | 300.68 | −32.72 | −462.15 | 236.52 | −25.74 | −446.72 | 172.35 | −18.75 |
| 500 | −182.22 | 324.85 | −33.94 | −490.93 | 260.04 | −27.17 | −474.78 | 195.23 | −20.39 |
 | ||
| Fig. 8 Calculated Gibbs free energies and enthalpies of reactions (G) to (I) as a function of temperature. | ||
The kinetics of the conversion of becquerelite into studtite was analyzed experimentally by Kubatko et al.93 These authors studied also the thermodynamics of reaction (G) at the standard state, obtaining an enthalpy of reaction of ΔrH0 = −186.7 kJ mol−1. This value is in excellent agreement with our calculated value of ΔrH0 = −186.60 kJ mol−1 (see Table 8), the difference being about 0.1 kJ mol−1. However, Kubatko et al.,93 neglected the contribution of the entropy to the Gibbs free energy of reaction. As it can be seen in Fig. 8G, if this contribution is taken into account, the free energy of the reaction is positive within the full range of temperatures considered (298.15 K to 500 K). Therefore, although the reaction (G) of conversion of becquerelite to studtite is exothermic, it is non-spontaneous at this water to hydrogen peroxide ratio. This emphasizes the fact that the contribution of the entropy of reaction should not be overlooked since it may change even the sign of the value of the free energy of reaction.
Using the thermodynamic data for reactions (G), (H) and (I) (τ = 7:6, τ = 1.0, and τ = 6:7, respectively) at the temperature of 298.15 K, we may determine the precise value of the ratio τ (H2O:H2O2) at which ΔrG = 0, that is, the conversion of becquerelite into studtite becomes spontaneous. The value obtained was 1.049 ∼ 21:20, a value intermediate between those associated to reactions (G) and (H). Since reaction (H) is spontaneous at 298.15 K, we can use the corresponding calculated thermodynamic data to estimate the hydrogen peroxide concentration required for the conversion of becquerelite into studtite. From the calculated free energy of reaction (H) at 298.15 K, −21.28 kJ mol−1, a value of logK = 3.73 for the reaction constant at this temperature is obtained (see Table 8). By using the same methods as Kubatko et al.,93 we obtained, from this logK value, that the transformation of becquerelite into studtite should occur spontaneously at ambient temperature at concentrations of hydrogen peroxide higher than 3.6 × 10⁻⁴ M. The experiments carried out by Kubatko et al.93 were performed at a concentration of hydrogen peroxide of 0.1 M, which is much larger than this minimum concentration. The transformation was complete after 8 hours. The difference between present results and those of Kubatko et al.93 (they obtained a much smaller minimum hydrogen peroxide concentration, 3.5 × 10⁻⁶) results from the fact that they did not take into account the contribution of the entropy of reaction, which appears to be very important in this case.
 | ||
| Fig. 9 Relative thermodynamic stability of schoepite and metaschoepite with respect to other secondary phases of SNF: (A) under the absence of hydrogen peroxide; (B) under the presence of water and hydrogen peroxide; (C) under high concentrations of hydrogen peroxide. | ||
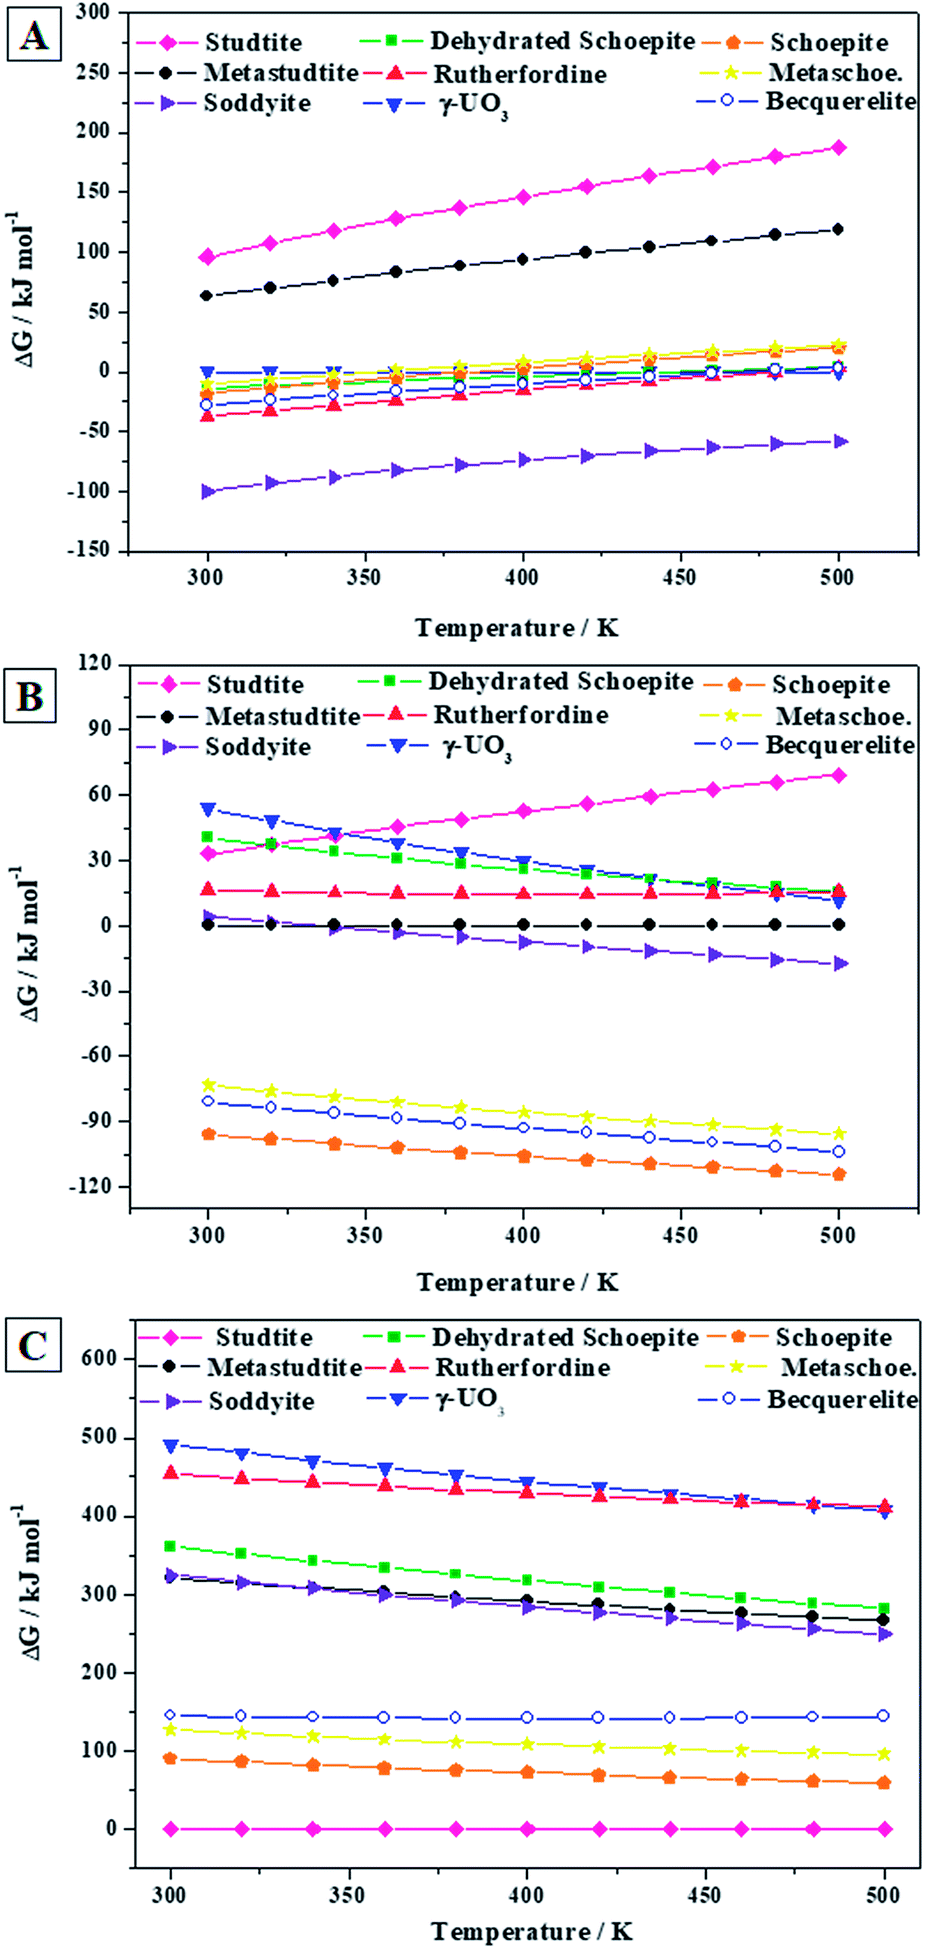
As shown in Fig. 9A, in the absence of hydrogen peroxide, soddyite is the most stable phase and rutherfordine is also more stable than becquerelite for temperatures lower than 219 °C (492 ± 37 K). Thus, at hydrogen peroxide free conditions, becquerelite phase should be replaced by other mineral phases containing for example silicate or carbonate ions.
The presence of water and hydrogen peroxide stabilizes to a large extent the becquerelite phase which, as shown in Fig. 9B, becomes the second most stable after schoepite among those considered in this study. Finally, as it can be seen in Fig. 9C, the stability increases even more in the presence of high hydrogen peroxide concentrations, as it also occurs to studtite, schoepite and metaschoepite phases.91,92 However, the stabilization of these other phases is larger than that of becquerelite, which becomes the fourth more stable phase within the full range of temperature considered (300 to 500 K). Under these conditions, the hydrated uranyl peroxide studtite is the most stable phase.
If the concentration of hydrogen peroxide decreases with time, as expected from the diminution of the intensity of radiation fields over time in a radioactive waste disposal,149 the stability of studtite will decrease, and the formation of other secondary phases will occur. However, in order to evaluate the thermodynamic stability of the secondary phases of the SNF in a precise way, an extended study must be carried out including a more significant number of secondary phases. Clearly, a full evaluation and understanding of the number and relative amount of the secondary phases of spent nuclear fuel present at the conditions of a final geological disposal over time requires the realization of complete thermodynamic calculations employing thermochemical data for a significant number of materials, including the most important secondary phases, amorphous phases and aqueous species, at a wide range of temperature and pressure conditions.91
| Ca(UO2)6O4(OH)6·8H2O(cr) + 14H+(aq) → Ca2+(aq) + 6UO22+(aq) + 16H2O(l) |
Using the computed value of the Gibbs free energy of formation of becquerelite and the Gibbs free energies of formation of aqueous ions, Ca2+(aq), UO22+(aq), H+(aq) and liquid water at 298.15 K,150 we obtain the Gibbs free energy and associated reaction constant of solubility given in Table 9. The calculated solubility product of logKcalcsp becquerelite, 50.38, is in good agreement with the most recent experimental value of 40.5 ± 1.4.140
Ksp) of the solubility reaction of becquerelite. The values of ΔspG are in units of kJ mol−1
3.4 Mechanic properties
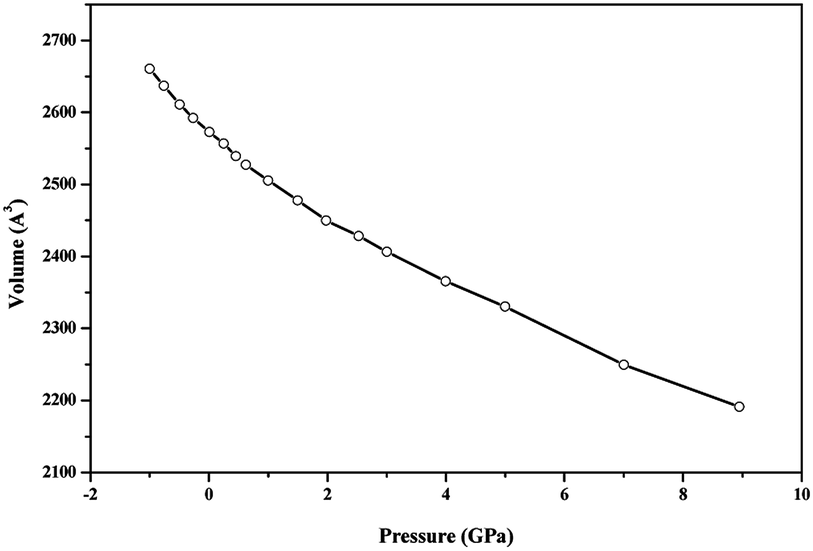 | ||
| Fig. 10 Unit cell volume of becquerelite as a function of the applied pressure. | ||
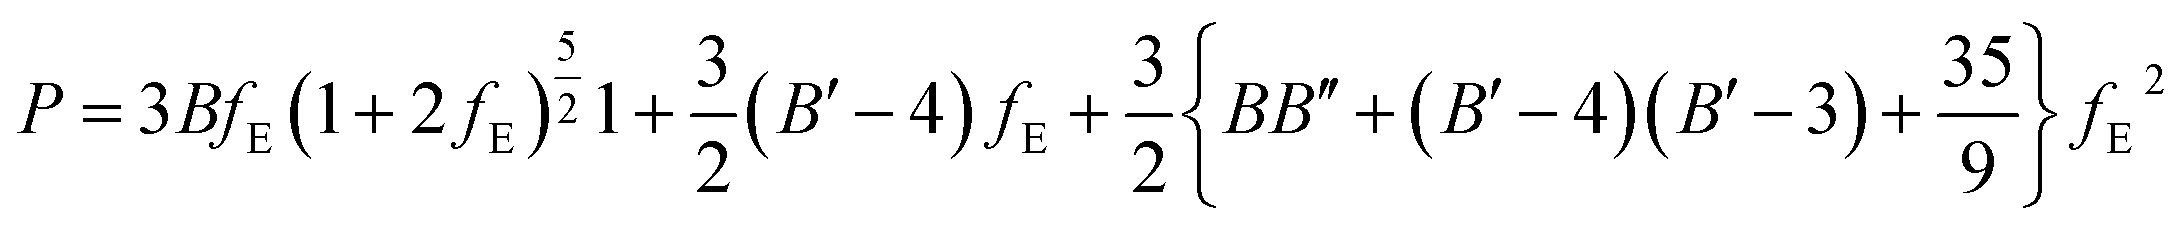
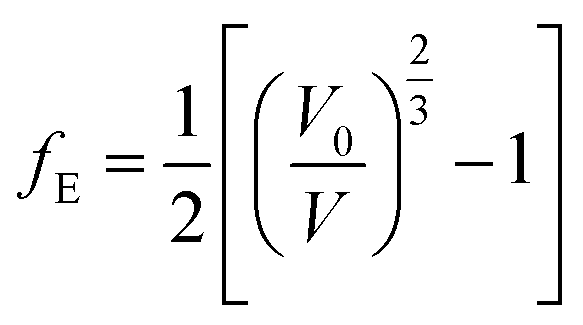
EOSFIT 5.2 code129 was then used to fit the calculated volume-pressure data to a fourth-order Birch–Murnaghan128 equation of state (EOS) using the computed volume at zero pressure (2572.99 Å3, see Table 1) as V0:
 | (1) |
In the above equation:
 | (2) |
 | (3) |
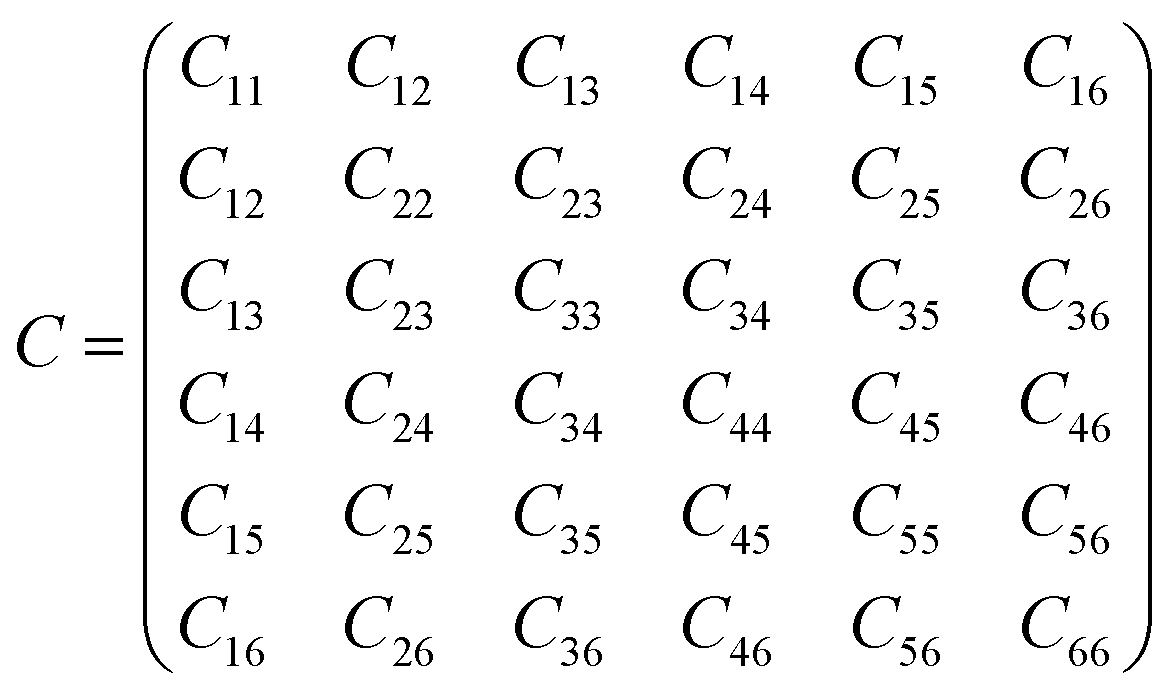
This equation is written by using the standard Voigt notation for the indices contracting a pair of Cartesian indices into a single integer 1 ≤ i ≤ 6: xx → 1, yy → 2, zz → 3, yz → 4, xz → 5, xy → 6. The values of the Cij constants obtained from our calculations are detailed in eqn (4).
 | (4) |
The generic necessary and sufficient Born criterion for stability of a triclinic symmetry crystal structure is that all eigenvalues of the C matrix be positive.151 The C matrix was diagonalized numerically and all eigenvalues were found to be positive. Since the above condition is satisfied, becquerelite mechanical stability can be inferred. To analyze the stability of the material in a complete form we must also study the dynamical stability. A structure is dynamically stable if and only all its phonon modes have positive frequencies for all wave vectors.151 The satisfaction of this condition has also been verified from the phonon calculation utilized to determine becquerelite thermodynamic properties.
The thermal expansion of the material should occur predominantly along [010] direction because C22, the diagonal component of C matrix along b direction, is much smaller than both C11 and C33 components. As expected, this direction is the one perpendicular to becquerelite layers (see Fig. 1). The diagonal component C33 is the largest (along c direction).
If single crystal samples are not available, the measure of the individual elastic constants is not possible. However, the polycrystalline bulk and shear moduli (B and G) may be determined experimentally. The Voigt152 and Reuss153 schemes were used to compute the isotropic elastic properties of becquerelite polycrystalline aggregates. As shown by Hill,154 the Reuss and Voigt approximations result in lower and upper limits, respectively, of polycrystalline constants and practical estimates of the polycrystalline bulk and shear moduli in the Hill approximation can be computed using average formulas. The Reuss scheme provided the best results when the computed bulk modulus was compared with that determined from the equation of state, given in the previous Section 3.3.1, although the differences between the results obtained from these approximations were relatively small. The bulk and shear moduli calculated in these three approximations together with the values obtained for other mechanical properties are given in Table 10. Since CASTEP code gave a numerical estimate of the error in the computed bulk modulus of 0.99 GPa, our final value for the bulk modulus computed from the elastic constants in the Reuss approximation is B = 31.17 ± 0.99 GPa, which agrees well with that obtained from the EOS, B = 34.68 ± 0.79 GPa.
| Property | Voigt | Reuss | Hill |
|---|---|---|---|
| B | 43.73 | 31.17 | 37.45 |
| G | 24.80 | 19.92 | 22.36 |
| E | 62.57 | 49.27 | 55.95 |
| ν | 0.26 | 0.24 | 0.25 |
| D | 1.76 | 1.56 | 1.67 |
| H | 3.74 | 3.82 | 3.74 |
While the elasticity theory is very well understood and mathematically well founded, it is difficult to visualize how the elastic properties vary with the strain orientation, except for the simplest cases of isotropic materials. In order to address this difficulty, the ElAM software of Marmier et al.155 was used to obtain detailed tridimensional representations of the most important elastic properties calculated in this work, which are shown in Fig. 11. In Fig. 11A, the property displayed is the inverse of the bulk modulus (the compressibility) instead of the bulk modulus. As it can be seen in Fig. 11A, direction b is the most compressible one in accordance with the previous discussion on the results of the stiffness C matrix. Also, it must be noted that the corresponding tridimensional representations of the elastic properties of schoepite mineral,92 including those of the shear modulus, are very similar to those shown in Fig. 11. This was expected, since this uranyl oxyhydroxide mineral is closely related to becquerelite having also layered structure.
 | ||
| Fig. 11 Becquerelite elastic properties as a function of the orientation of the applied strain: (A) compressibility; (B) Young modulus; (C) shear modulus; (D) Poisson ratio. Note that the b and c axis have been interchanged to show the great similarity of the shape of these functions for becquerelite and schoepite.87 | ||
A large value of shear modulus is an indication of the more pronounced directional bonding between atoms. The shear modulus represents the resistance to plastic deformation while the bulk modulus represents the resistance to fracture. By considering this interpretation of the shear and bulk modulus, Pugh156 introduced the proportion of bulk to shear modulus of polycrystalline phases (D = B/G) as a measure of ductility of a material. A higher D value is usually associated with higher ductility and the critical value which separates ductile and brittle materials is 1.75, i.e. if D > 1.75, the material behaves in a ductile manner, otherwise the material behaves in a brittle manner.157 Poisson's ratio,156 ν, can be also utilized to measure the malleability of crystalline compounds and is related to the Pugh's ratio given above by the relation D = (3 − 6ν)/(8 + 2ν). This ratio is close to 1/3 for ductile materials and is generally much smaller for brittle materials. Becquerelite material is brittle because the ratio D (1.56) is smaller than 1.75 and Poisson's ratio is much smaller than 1/3 (0.24, see Table 10). For comparison, studtite and metastudtite were found to be ductile105 and rutherfordine, uranophane, soddyite and schoepite were found to be brittle.88,114–117
The recently introduced empirical scheme158 correlating the Vickers hardness and Pugh's ratio (D) was employed to compute the hardness of becquerelite mineral. The value of the Vickers hardness, H, of polycrystalline becquerelite is reported in Table 10. Its value, about 3.8, corresponds to material of intermediate hardness. For comparison, studtite and metastudtite105,112 have much smaller hardness (smaller than one), and rutherfordine, uranophane, soddyite and schoepite are characterized by hardness values of 9.5, 6.3, 6.3 and 4.9 respectively.88,114–117
The elastic anisotropy of becquerelite was evaluated by obtaining the corresponding shear anisotropic factors which provide a measure of the degree of anisotropy in the bonding between atoms in different planes. These factors are important to study material durability.159 Shear anisotropic factors for the {100} (A1), {010} (A2), and {001} (A3) crystallographic planes were determined. For a perfectly isotropic crystal, these factors must be one, while any value smaller or greater than unity is a measure of the degree of elastic anisotropy possessed by the crystal. The computed values were 0.46, 0.93 and 0.45, respectively. The {010} plane, containing becquerelite sheets, is the least anisotropic.
The universal anisotropy index,160 AU, was recently introduced to provide a measure of material anisotropy independent of the scheme used to determine the polycrystalline elastic properties, since it is defined in terms of the bulk and shear moduli in both Voigt and Reuss approximations. Thus, AU represents a universal measure to quantify the single crystal elastic anisotropy. In this scheme, the departure of AU from zero defines the extent of single crystal anisotropy and accounts for both the shear and the bulk contributions unlike all other existing anisotropy measures. Becquerelite is characterized by a computed anisotropy index of 1.63, which is a rather large value (AU = 0 corresponds to a perfectly isotropic crystal). For comparison, studtite, metastudtite, rutherfordine, uranophane, soddyite and schoepite exhibit anisotropy values of 2.17, 1.44, 8.82, 0.81, 0.50 and 0.78, respectively.88,105,114–117
A set of fundamental physical properties can be estimated using the calculated elastic constants. For example, VL and VT, the transverse and longitudinal elastic wave velocities of the polycrystalline materials may be determined in terms of the bulk and shear moduli.105 The values obtained were 2.097 and 3.637 km s−1, respectively, using the calculated crystal density of 4.993 g cm−3 (see Table 1).
4 Conclusions
Since in the previous experimental studies47–50 of this mineral it was not possible to locate hydrogen atoms directly from X-ray diffraction data by structure refinement, the full crystal structure of becquerelite mineral phase was determined by using theoretical solid-state methods for the first time. Structural optimization performed by using the PBE exchange-correlation functional and including empirical dispersion corrections has produced a becquerelite structure in excellent agreement with experimental data. The computed X-ray powder pattern was also in very good agreement with the experimental pattern. The determination of the hydrogen atom positions has provided support to the interlayer hydrogen bonding structure of becquerelite, which was rationalized in the experimental work of Burns and Li,50 and has allowed to resolve the ambiguities encountered by these authors since permits to discriminate among the hydrogen bonds proposed by these authors.Despite of the large computational resources required to study becquerelite mineral by means of theoretical methods (the corresponding calculations involve 1184 valence electrons to be described explicitly), the thermodynamic and mechanical properties of this material were obtained. Since these properties have not been measured experimentally for becquerelite, their values were predicted. The calculated thermodynamic properties were used to obtain the enthalpies and Gibbs free energies of formation as a function of temperature. These thermodynamic properties of formation were combined with those of other important uranyl-containing materials (gamma uranium trioxide, dehydrated schoepite, rutherfordine and soddyite) to study four reactions relating becquerelite and these materials. The results showed that becquerelite becomes unstable with respect to the corresponding oxides at temperatures higher than 218 °C (491 ± 1 K) and that the conversion into dehydrated schoepite occurs at 239 °C (512 ± 25 K). Becquerelite, under hydrogen peroxide free conditions, will transform in the presence of carbon dioxide into rutherfordine for temperatures lower than 219 °C (492 ± 37 K). Similarly, becquerelite is predicted to transform in the presence of SiO2 into soddyite for the full range of temperatures considered (298.15 to 500 K).
The relative stability of becquerelite with respect to the uranyl peroxide hydrates metastudtite and studtite was studied under different conditions of temperature and concentrations of hydrogen peroxide by considering the corresponding reactions. The results obtained allowed to study in detail the thermodynamics of the reaction of conversion of this phase into studtite, complementing the experimental study of Kubatko et al.,93 and to determine the relative stability of becquerelite with respect to a series of the most important secondary phases of the spent nuclear fuel under different conditions including dehydrated schoepite, schoepite, metaschoepite, studtite, metastudtite, rutherfordine and soddyite. These results show that, among the mineral phases considered in this study, becquerelite is, after schoepite, the second most stable phase under intermediate hydrogen peroxide concentrations and, after studtite, schoepite and metaschoepite, the fourth more stable phase under high hydrogen peroxide concentration. The last situation is important since is the one expected under high radiation fields causing the radiolysis of most of the water reaching the surface of the spent nuclear fuel.
The crystalline structure of becquerelite was found to be mechanically and dynamically stable. Becquerelite mineral phase is a brittle material characterized by a large anisotropy and large compressibility along direction perpendicular to the sheets, which characterize its structure. The computed bulk modulus of becquerelite (B ∼ 31 GPa) is of the same order as that obtained previously88 for schoepite mineral (B ∼ 35 GPa), and intermediate between the values obtained in previous works for other layered uranyl-containing materials as rutherfordine (B ∼ 20 GPa) and uranophane (B ∼ 60 GPa).112,115,117 A large amount of relevant mechanical data of schoepite mineral was reported here, including bulk modulus derivatives, elastic coefficients, shear and Young moduli, Poisson ratios, ductility and hardness indices and elastic anisotropy measures.
Conflicts of interest
There are no conflicts to declare.Acknowledgements
This work was supported by ENRESA within the project: No. 079000189 “Aplicación de técnicas de caracterización en el estudio de la estabilidad del combustible nuclear irradiado en condiciones de almacenamiento” (ACESCO) and project FIS2013-48087-C2-1-P. Supercomputer time by the CETA-CIEMAT and CESGA centers are also acknowledged. This work has been carried out in the context of a CSIC – CIEMAT collaboration agreement: “Caracterización experimental y teórica de fases secundarias y óxidos de uranio formados en condiciones de almacenamiento de combustible nuclear”. We also thank Prof. Rafael Escribano for reading the manuscript and many helpful comments.References
- A. Schoep, Comptes Rendus Acad. Sci., 1922, 174, 1240–1242 Search PubMed.
- A. Schoep, Bull. Soc. Fr. Mineral., 1923, 46, 9–18 Search PubMed.
- A. Schoep and S. Stradiot, Am. Mineral., 1947, 33, 503–507 Search PubMed.
- A. H. Becquerel, Comptes Rendus Acad. Sci., 1896, 122, 501–502 Search PubMed.
- J. Plasil, J. Geosci., 2014, 59, 99–114 CrossRef.
- C. Frondel, Am. Mineral., 1956, 41, 539–568 Search PubMed.
- R. J. Finch and R. C. Ewing, J. Nucl. Mater., 1992, 190, 133–156 CrossRef.
- M. Deliens, Bull. Soc. Fr. Mineral. Cristallogr., 1977, 100, 32–38 Search PubMed.
- I. Grenthe, J. Drozdzynski, T. Fujino, E. C. Buck, T. E. Albrecht-Schmitt and S. F. Wolf, in The Chemistry of Actinide and Transactinide Elements, ed. L. R. Morss, N. M. Edelstein and J. Fuger, Springer Science and Business Media, Berlin, 2006, vol. I, ch. V, pp. 253–638 Search PubMed.
- R. J. Finch and T. Murakami, Rev. Mineral. Geochem., 1999, 38, 91–180 Search PubMed.
- R. J. Finch, M. L. Miller and R. C. Ewing, Radiochim. Acta, 1992, 58/59, 433–443 Search PubMed.
- E. C. Pearcy, J. D. Prikryl, W. M. Murphy and B. W. Leslie, Appl. Geochem., 1994, 9, 713–732 CrossRef.
- D. J. Wronkiewicz, J. K. Bates, T. J. Gerding, E. Veleckis and B. S. Tani, J. Nucl. Mater., 1992, 190, 107–127 CrossRef.
- D. J. Wronkiewicz, J. K. Bates, S. F. Wolf and E. C. Buck, J. Nucl. Mater., 1996, 238, 78–95 CrossRef.
- SKB-91, Final Disposal of Spent Nuclear Fuel. Importance of the Bedrock for Safety, SKB Report 92–20, SKB, May, 1992 Search PubMed.
- R. C. Ewing, Nat. Mater., 2015, 14, 252–256 CrossRef PubMed.
- H. Christensen and S. Sunder, J. Nucl. Mater., 1996, 238, 70–77 CrossRef.
- D. W. Shoesmith, J. Nucl. Mater., 2000, 282, 1–31 CrossRef.
- S. Sunder, Nucl. Technol., 1998, 122, 211–221 CrossRef.
- R. Wang and Y. B. Katayama, Nucl. Chem. Waste Manage., 1982, 3, 83–90 CrossRef.
- G. Sattonnay, C. Ardois, C. Corbel, J. F. Lucchini, M. F. Barthe, F. Garrido and D. Gosset, J. Nucl. Mater., 2001, 288, 11–19 CrossRef.
- M. Amme, B. Renker, B. Schmid, M. P. Feth, H. Bertagnolli and W. Döbelin, J. Nucl. Mater., 2002, 306, 202–212 CrossRef.
- K. J. Cantrell, K. M. Krupka, W. J. Deutsch and M. J. Lindberg, Environ. Sci. Technol., 2006, 40, 3755–3761 CrossRef PubMed.
- J. Abrefah, S. Marschmann and E. D. Jenson, Examination of the Surface Coatings Removed from K-East Basin Fuel Elements, Report of the U.S. Department of Energy, Pacific Northwest National laboratory PNNL-11806, US-DOE, Richland, Washington, 1998 Search PubMed.
- A. J. Schmidt and C. H. Delegard, Assessment of K Basin Sludge Volume Expansion Resulting from Uranium Corrosion During Storage, Report of the U.S. Department of Energy, Pacific Northwest National laboratory PNNL-13786, US-DOE, Richland, Washington, 2002 Search PubMed.
- C. H. Delegard and A. J. Schmidt, Uranium Metal Reaction Behavior in Water, Sludge, and Grout, Report of the U.S. Department of Energy, Pacific Northwest National laboratory PNNL-17815, US-DOE, Richland, Washington, 2008 Search PubMed.
- L. P. Moroni and F. P. Glasser, Waste Management, 1995, 15, 243–254 CrossRef.
- N. D. M. Evans, Cem. Concr. Res., 2008, 38, 543–553 CrossRef.
- M. Felipe-Sotelo, J. Hinchliff, L. P. Field, A. E. Milodowski, O. Preedy and D. Read, Chemosphere, 2017, 179, 127–138 CrossRef PubMed.
- M. Atkins, A. N. Beckley and F. P. Glasser, Radiochim. Acta, 1988, 44/45, 255–261 Search PubMed.
- D. M. Wellman, K. E. Parker, S. V. Mattigod, L. N. Clayton, L. Powers and M. I. Wood, Concrete Property and Radionuclide Migration Tests, Report of the U.S. Department of Energy, Pacific Northwest National laboratory PNNL-17676, US-DOE, Richland, Washington, 2007 Search PubMed.
- D. M. Wellman, K. E. Parker, C. C. Bovaird, R. M. Ermi, S. V. Mattigod and M. I. Wood, Effect of Concrete Waste Form Properties on Radionuclide Migration, Report of the U.S. Department of Energy, Pacific Northwest National laboratory PNNL-17808, US-DOE, Richland, Washington, 2008 Search PubMed.
- S. V. Mattigod, C. C. Bovaird, D. M. Wellman, D. J. Skinner, E. A. Cordova and M. I. Wood, Effect of Concrete Waste Form Properties on Radionuclide Migration, Report of the U.S. Department of Energy, Pacific Northwest National laboratory PNNL-18745, US-DOE, Richland, Washington, 2009 Search PubMed.
- S. V. Mattigod, C. C. Bovaird, D. M. Wellman and M. I. Wood, Radionuclide Retention in Concrete Waste Forms, Report of the U.S. Department of Energy, Pacific Northwest National laboratory PNNL-19823, US-DOE, Richland, Washington, 2010 Search PubMed.
- R. J. Finch, J. Suksi, K. Rasilainen and R. C. Ewing, Mater. Res. Soc. Symp. Proc., 1995, 353, 647–652 CrossRef.
- I. Casas J. Bruno, E. Cera, R. J. Finch and R. C. Ewing, Kinetic and thermodynamic studies of uranium minerals, Assessment of the long-term evolution of spent nuclear fuel, Report SKB TR 94–16, SKB, 1994 Search PubMed.
- I. Casas, J. Bruno, E. Cera, R. J. Finch and R. C. Ewing, Geochim. Cosmochim. Acta, 1997, 61, 3879–3884 CrossRef.
- M. C. A. Sandino and B. Grambow, Radiochim. Acta, 1994, 66–67, 37–43 Search PubMed.
- D. Rai, A. R. Felmy, N. J. Hess, V. L. LeGore and D. E. McCready, Radiochim. Acta, 2002, 90, 495–503 Search PubMed.
- M. Schlinder, F. C. Hawthorne, C. Putnis and A. Putnis, Can. Mineral., 2004, 42, 1683–1697 CrossRef.
- M. Schindler, F. C. Hawthorne, P. C. Burns and P. A. Maurice, Can. Mineral., 2006, 44, 1207–1225 CrossRef.
- R. Vochten and L. van Haverbeke, Mineral. Petrol., 1990, 43, 44–45 CrossRef.
- P. C. Burns, M. L. Miller and R. C. Ewing, Can. Mineral., 1996, 34, 845–880 Search PubMed.
- P. C. Burns, R. C. Ewing and F. C. Hawthorne, Can. Mineral., 1997, 35, 1551–1570 Search PubMed.
- P. C. Burns, Can. Mineral., 2005, 43, 1839–1894 CrossRef.
- P. C. Burns, Rev. Mineral. Geochem., 1999, 38, 23–90 Search PubMed.
- J. Piret-Meunier and P. Piret, Bull. Soc. Fr. Mineral. Cristallogr., 1982, 105, 606–610 Search PubMed.
- M. K. Pagoaga, D. E. Appleman and J. M. Stewart, Am. Mineral., 1987, 72, 1230–1238 Search PubMed.
- J. Cejka, J. Sejkora, R. Skala, J. Cejka, M. Novotna and J. Ederova, Neues Jahrb. Mineral., Abh., 1998, 174, 159–180 Search PubMed.
- P. C. Burns and Y. Li, Am. Mineral., 2002, 87, 550–557 CrossRef.
- R. J. Finch, M. A. Cooper, F. C. Hawthorne and R. C. Ewing, Can. Mineral., 1996, 34, 1071–1088 Search PubMed.
- R. J. Finch, F. C. Hawthorne, M. L. Miller and R. C. Ewing, Powder Diffr., 1997, 12, 230–238 CrossRef.
- R. J. Finch, F. C. Hawthorne and R. C. Ewing, Can. Mineral., 1998, 36, 831–845 Search PubMed.
- M. T. Weller, M. E. Light and T. Gelbrich, Acta Crystallogr., Sect. B: Struct. Sci., 2000, 56, 577–583 CrossRef.
- A. G. Sowder, S. B. Clark and R. A. Fjeld, Environ. Sci. Technol., 1999, 33, 3552–3557 CrossRef.
- J. Brugger, N. Meisser, B. Etschmann, S. Ansermet and A. Pring, Am. Mineral., 2011, 96, 229–240 CrossRef.
- P. Piret, Bull. Soc. Fr. Mineral. Cristallogr., 1985, 108, 659–665 Search PubMed.
- P. Piret, M. Deliens, J. Piret-Meunier and G. Germain, Bull. Soc. Fr. Mineral. Cristallogr., 1983, 106, 299–304 Search PubMed.
- K. Mereiter, Tschermaks Mineral. Petrogr. Mitt., 1979, 26, 279–292 CrossRef.
- B. O. Loopstra and H. M. Rietveld, Acta Crystallogr., Sect. B: Struct. Crystallogr. Cryst. Chem., 1969, 25, 787–791 CrossRef.
- C. Guillemin and J. Protas, Bull. Soc. Fr. Mineral. Cristallogr., 1959, 82, 80–86 Search PubMed.
- R. J. Finch and R. C. Ewing, Mater. Res. Soc. Symp. Proc., 1995, 333, 625–629 CrossRef.
- D. K. Smith, in Uranium Geochemistry, Mineralogy, Geology, Exploration and Resources, ed. B. De Vivo, F. Ippolito, G. Capaldi and P. R. Simpson, Institute of Mining and Metallurgy, London, 1984, pp. 43–88 Search PubMed.
- R. Sobry, J. Inorg. Nucl. Chem., 1973, 35, 2753–2768 CrossRef.
- R. Sobry, J. Inorg. Nucl. Chem., 1973, 35, 1515–1524 CrossRef.
- M. Deliens, Mineral. Mag., 1977, 41, 51–57 CrossRef.
- Y. Li and P. C. Burns, Can. Mineral., 2000, 38, 727–735 CrossRef.
- P. C. Burns, Am. Mineral., 1997, 82, 1176–1186 Search PubMed.
- P. C. Burns, Can. Mineral., 1998, 36, 1061–1067 Search PubMed.
- R. J. Finch, P. C. Burns, F. C. Hawthorne and R. C. Ewing, Can. Mineral., 2006, 44, 1197–1205 CrossRef.
- P. C. Burns and J. M. Hanchar, Can. Mineral., 1999, 37, 1483–1491 Search PubMed.
- C. L. Cahill and P. C. Burns, Am. Mineral., 2000, 85, 1294–1297 CrossRef.
- P. C. Burns, Can. Mineral., 1998, 36, 187–199 Search PubMed.
- P. C. Burns, R. C. Ewing and M. L. Miller, J. Nucl. Mater., 1997, 245, 1–9 CrossRef.
- P. C. Burns, Can. Mineral., 1998, 36, 1069–1075 Search PubMed.
- P. C. Burns, J. Nucl. Mater., 1999, 265, 218–223 CrossRef.
- P. C. Burns, K. M. Deely and S. Skanthakumar, Radiochim. Acta, 2004, 92, 151–159 Search PubMed.
- P. C. Burns and A. L. Klingensmith, Elements, 2006, 2, 351–356 CrossRef.
- A. L. Klingensmith and P. C. Burns, Am. Mineral., 2007, 92, 1946–1951 CrossRef.
- M. Douglas, S. B. Clark, S. Utsunomiya and R. C. Ewing, J. Nucl. Sci. Technol., 2002,(suppl. 3), 504–507 CrossRef.
- M. Douglas, S. B. Clark, J. I. Friese, B. W. Arey, E. C. Buck, B. D. Hanson, S. Utsunomiya and R. C. Ewing, Radiochim. Acta, 2005, 93, 265–272 Search PubMed.
- W. M. Murphy and B. Grambow, Radiochim. Acta, 2008, 96, 563–567 Search PubMed.
- L. C. Shuller, R. C. Ewing and U. Becker, Am. Mineral., 2010, 95, 1151–1160 CrossRef.
- L. C. Shuller, R. C. Ewing and U. Becker, J. Nucl. Mater., 2013, 434, 440–450 CrossRef.
- L. C. Shuller, W. M. Bender, S. M. Walker and U. Becker, Minerals, 2014, 4, 690–715 CrossRef.
- R. J. Baker, Coord. Chem. Rev., 2014, 266–267, 123–136 CrossRef.
- P. C. Burns, Can. Mineral., 1998, 36, 847–853 Search PubMed.
- F. Colmenero, J. Cobos and V. Timón, Inorg. Chem., 2018, 57, 4470–4481 CrossRef PubMed.
- M. C. Payne, M. P. Teter, D. C. Ailan, A. Arias and J. D. Joannopoulos, Rev. Mod. Phys., 1992, 64, 1045–1097 CrossRef.
- F. Colmenero, A. M. Fernández, J. Cobos and V. Timón, J. Phys. Chem. C, 2018, 122, 5254–5267 CrossRef.
- F. Colmenero, A. M. Fernández, J. Cobos and V. Timón, J. Phys. Chem. C, 2018, 122, 5268–5279 CrossRef.
- F. Colmenero, A. M. Fernández, J. Cobos and V. Timón, Inorg. Chem., 2018 Search PubMed , submitted.
- K.-A. Kubatko, D. Unruh and P. C. Burns, Mater. Res. Soc. Symp. Proc., 2006, 893, 423–428 Search PubMed.
- (a) J. P. Crocombette, F. Jollet, L. T. Nga and T. Petit, Phys. Rev. B: Condens. Matter Mater. Phys., 2001, 64, 104107 CrossRef; (b) M. Freyss, T. Petit and J. P. Crocombette, J. Nucl. Mater., 2005, 347, 44–51 CrossRef.
- G. Beridze and P. M. Kowalski, J. Phys. Chem. A, 2014, 118, 11797–11810 CrossRef PubMed.
- Y. Yun, D. Legut and P. M. Oppeneer, J. Nucl. Mater., 2012, 426, 109–114 CrossRef.
- Q. Yin and S. Y. Savrasov, Phys. Rev. Lett., 2008, 100, 225504 CrossRef PubMed.
- B. T. Wang, P. Zhang, R. Lizárraga, I. Di Marco and O. Eriksson, Phys. Rev. B: Condens. Matter Mater. Phys., 2013, 88, 104107 CrossRef.
- (a) Z.-G. Mei, M. Stan and J. Yang, J. Alloys Compd., 2014, 603, 282–286 CrossRef; (b) Z.-G. Mei, M. Stan and B. Pichler, J. Nucl. Mater., 2013, 440, 63–69 CrossRef.
- S. L. Dudarev, D. N. Manh and A. P. Sutton, Philos. Mag. B, 1997, 75, 613–628 CrossRef.
- D. A. Andersson, G. Baldinozzi, L. Desgranges, D. R. Conradson and S. D. Conradson, Inorg. Chem., 2013, 52, 2769–2778 CrossRef PubMed.
- P. Nerikar, T. Watanabe, J. S. Tulenko, S. R. Phillpot and S. B. Sinnott, J. Nucl. Mater., 2009, 384, 61–69 CrossRef.
- (a) X.-D. Wen, R. L. Martin, L. E. Roy, G. E. Scuseria, S. P. Rudin, E. R. Batista, T. M. McCleskey, B. L. Scott, E. Bauer, J. J. Joyce and T. Durakiewicz, J. Chem. Phys., 2012, 137, 154707 CrossRef PubMed; (b) X.-D. Wen, R. L. Martin, G. E. Scuseria, S. P. Rudin, E. R. Batista and A. K. Burrell, J. Phys.: Condens. Matter, 2013, 25, 025501 CrossRef PubMed.
- P. F. Weck, E. Kim, N. Balakrishnan, F. Poineau, C. B. Yeamans and K. R. Czerwinski, Chem. Phys. Lett., 2007, 443, 82–86 CrossRef; P. F. Weck, E. Kim, C. F. Jove-Colon and D. C. Sassani, Dalton Trans., 2012, 41, 9748–9752 RSC; P. F. Weck and E. Kim, Dalton Trans., 2014, 43, 17191–17199 RSC.
- (a) P. F. Weck, E. Kim and E. C. Buck, RSC Adv., 2015, 5, 79090–79097 RSC; (b) P. F. Weck and E. Kim, J. Phys. Chem. C, 2016, 120, 16553–16560 CrossRef.
- (a) S. Ostanin and P. Zeller, J. Phys.: Condens. Matter, 2007, 19, 246108 CrossRef PubMed; (b) S. Ostanin and P. Zeller, Phys. Rev. B: Condens. Matter Mater. Phys., 2007, 75, 073101 CrossRef.
- (a) G. A. Shamov and G. Schreckenbach, Chem.–Eur. J., 2007, 13, 4932–4947 CrossRef PubMed; (b) G. Schreckenbach and G. A. Shamov, Acc. Chem. Res., 2010, 43, 19–29 CrossRef PubMed; (c) S. O. Odoh and G. Schreckenbach, Inorg. Chem., 2013, 52, 5590–5602 CrossRef PubMed.
- N. Iche-Tarrat and C. J. Marsden, J. Phys. Chem. A, 2008, 112, 7632–7642 CrossRef PubMed.
- L. Castro, A. Yahia and L. Maron, ChemPhysChem, 2010, 11, 990–994 CrossRef PubMed.
- (a) D. Majumdar, K. Balasubramanian and H. Nitsche, Chem. Phys. Lett., 2002, 361, 143–151 CrossRef; (b) D. Majumdar, S. Roszak, K. Balasubramanian and H. Nitsche, Chem. Phys. Lett., 2003, 372, 232–241 CrossRef; (c) D. Chaudhuri and K. Balasubramanian, Chem. Phys. Lett., 2004, 399, 67–72 CrossRef.
- L. J. Bonales, F. Colmenero, J. Cobos and V. Timón, Phys. Chem. Chem. Phys., 2016, 18, 16575–16584 RSC.
- F. Colmenero, PhD thesis, Universidad Autónoma de Madrid, Madrid, 2017, p. 443.
- F. Colmenero, L. J. Bonales, J. Cobos and V. Timón, Spectrochim. Acta, Part A, 2017, 174, 245–253 CrossRef PubMed.
- F. Colmenero, L. J. Bonales, J. Cobos and V. Timón, J. Solid State Chem., 2017, 253, 249–257 CrossRef.
- F. Colmenero, L. J. Bonales, J. Cobos and V. Timón, J. Phys. Chem. C, 2017, 121, 5994–6001 CrossRef.
- F. Colmenero, L. J. Bonales, J. Cobos and V. Timón, J. Phys. Chem. C, 2017, 121, 14507–14516 CrossRef.
- F. Colmenero, L. J. Bonales, J. Cobos and V. Timón, Clay Miner., 2017 Search PubMed , accepted for publication.
- S. J. Clark, M. D. Segall, C. J. Pickard, P. J. Hasnip, M. I. J. Probert, K. Refson and M. C. Payne, Z. Kristallogr., 2005, 220, 567–570 Search PubMed.
- MaterialsStudio, http://accelrys.com/products/collabora-tivescience/biovia-materials-studio/, accessed April 30, 2018 Search PubMed.
- J. P. Perdew, K. Burke and M. Ernzerhof, Phys. Rev. Lett., 1996, 77, 3865–3868 CrossRef PubMed.
- S. Grimme, J. Comput. Chem., 2006, 27, 1787–1799 CrossRef PubMed.
- N. Troullier and J. L. Martins, Phys. Rev. B: Condens. Matter Mater. Phys., 1991, 43, 1993–2006 CrossRef.
- B. G. Pfrommer, M. Cote, S. G. Louie and M. L. Cohen, J. Comput. Phys., 1997, 131, 233–240 CrossRef.
- H. J. Monkhorst and J. D. Pack, Phys. Rev. B: Solid State, 1976, 13, 5188–5192 CrossRef.
- F. Colmenero and V. Timon, J. Solid State Chem., 2018, 263, 131–140 CrossRef.
- S. Baroni, S. de Gironcoli and A. Dal Corso, Rev. Mod. Phys., 2001, 73, 515–562 CrossRef.
- C. Lee and X. Gonze, Phys. Rev. B: Condens. Matter Mater. Phys., 1995, 51, 8610–8613 CrossRef.
- F. Birch, Phys. Rev., 1947, 71, 809–824 CrossRef.
- (a) R. J. Angel, Rev. Mineral. Geochem., 2000, 41, 35–60 CrossRef; (b) EOSFIT 5.2 software, http://www.ccp14.ac.uk/ccp/web-mirrors/ross-angel/rja/soft/, accessed April 30, 2018 Search PubMed.
- J. F. Nye, The Physical Properties of Crystals: Their Representation by Tensors and Matrices, Oxford University Press, New York, 1985 Search PubMed.
- R. Yu, J. Zhu and H. Q. Ye, Comput. Phys. Commun., 2010, 181, 671–675 CrossRef.
- H. T. Evans, Science, 1963, 141, 154–158 CrossRef PubMed.
- B. O. Loopstra, Acta Crystallogr., 1964, 17, 651–654 CrossRef.
- B. O. Loopstra, Acta Crystallogr., Sect. B: Struct. Sci., 1970, 26, 656–657 CrossRef.
- J. L. Hoekstra, S. Siegel, L. H. Fuchs and J. J. Katz, J. Phys. Chem., 1955, 59, 136–138 CrossRef.
- J. D. Martin, XPowder12, Ver. 04.13, 2012 Search PubMed.
- ICDD, The International Center for Difracction Data, PDF-2 Database, 2003 Search PubMed.
- T. Y. Shvareva, J. B. Fein and A. Navrotsky, Ind. Eng. Chem. Res., 2012, 51, 607–613 CrossRef.
- K.-A. Kubatko, K. Helean, A. Navrotsky and P. C. Burns, Am. Mineral., 2006, 91, 658–666 CrossRef.
- D. Gorman-Lewis, J. B. Fein, P. C. Burns, J. E. S. Szymanowski and J. Converse, J. Chem. Thermodyn., 2008, 40, 980–990 CrossRef.
- F. Chen, R. C. Ewing and S. B. Clark, Am. Mineral., 1999, 84, 650–664 CrossRef.
- R. J. Finch, Mater. Res. Soc. Symp. Proc., 1997, 465, 1185–1192 CrossRef.
- S. B. Clark, R. C. Ewing and J. C. Schaumloffel, J. Alloys Compd., 1998, 271–273, 189–193 CrossRef.
- M. W. Chase, C. A. Davies, J. R. Downey, D. J. Frurip, R. A. McDonald and A. N. Syverud, J. Phys. Chem. Ref. Data, 1985, 14(suppl. 1), 1–1856 Search PubMed.
- I. Barin, Thermochemical Data of Pure Substances, VCH, Weinheim, 3rd edn, 1995 Search PubMed.
- T. Wiss, J. P. Hiernaut, D. Roudil, J. Y. Colle, E. Maugeri, Z. Talip, A. Janssen, V. Rondinella, R. J. M. Konings, H. J. Matzke and W. J. Weber, J. Nucl. Mater., 2014, 451, 198–206 CrossRef.
- F. G. F. Gibb, Waste Management, 1999, 19, 207–211 CrossRef.
- T. Z. Forbes, P. Horan, T. Devine, D. McInnis and P. C. Burns, Am. Mineral., 2011, 96, 202–206 CrossRef.
- D. W. Shoesmith, Used Fuel and Uranium Dioxide Dissolution Studies – A Review, NWMO Technical Report 2007-03, University of Western Ontario, Canada, 2014 Search PubMed.
- J. D. Cox, D. D. Wagman and V. A. Medvedev, CODATA Key Values for Thermodynamics, New York, Hemisphere Publishing Corp., 1989 Search PubMed.
- F. Mouhat and F.-X. Coudert, Phys. Rev. B: Condens. Matter Mater. Phys., 2014, 90, 224104 CrossRef.
- W. Voigt, Lehrbuch der Kristallphysik, Teubner, Leipzig, 1962 Search PubMed.
- A. Reuss, Z. Angew. Math. Mech., 1929, 9, 49–58 CrossRef.
- R. Hill, Proc. Phys. Soc. London, 1952, 65, 349–354 CrossRef.
- A. Marmier, Z. A. D. Lethbridge, R. Walton, C. W. Smith, S. C. Parker and K. E. Evans, Comput. Phys. Commun., 2010, 181, 2102–2115 CrossRef.
- S. F. Pugh, Philos. Mag., 1954, 45, 823–843 Search PubMed.
- Y. Bouhadda, S. Djella, M. Bououdina, N. Fenineche and Y. Boudouma, J. Alloys Compd., 2012, 534, 20–24 CrossRef.
- H. Niu, P. Wei, Y. Sun, C.-X. Chen, C. Franchini, D. Li and Y. Li, Appl. Phys. Lett., 2011, 99, 031901 CrossRef.
- P. Ravindran, L. Fast, P. A. Korzhavyi, B. Johansson, J. Wills and O. Eriksson, J. Appl. Phys., 1998, 84, 4891–4904 CrossRef.
- S. I. Ranganathan and M. Ostoja-Starzewski, Phys. Rev. Lett., 2008, 101, 055504 CrossRef PubMed.
Footnote |
| † Electronic supplementary information (ESI) available: Calculated thermodynamic properties (specific heats, entropies, enthalpies and Gibbs free energies) of becquerelite as a function of temperature in the range from 0 to 1000 K. CCDC 1844447. For ESI and crystallographic data in CIF or other electronic format see DOI: 10.1039/c8ra04678f |
| This journal is © The Royal Society of Chemistry 2018 |