 Open Access Article
Preparation and photocatalytic activity characterization of activated carbon fiber–BiVO4 composites
Chencheng Zhang ab,
Pingfang Han
 *a,
Xiaoping Lua,
Qinghui Maob,
Jiangang Qub and
Ya Lic
aBiotechnology and Pharmaceutical Engineering, Nanjing Tech University, Nanjing 210009, PR China. E-mail: hpf@njtech.edu.cn
bCollege of Textile and Garment, Nantong University, Nantong 226019, PR China
cNantong College of Science and Technology, Nantong 226007, PR China
First published on 10th July 2018
Abstract
Herein, we describe the hydrothermal immobilization of BiVO4 on activated carbon fibers (ACFs) and characterize the obtained composite by several instrumental techniques, using Reactive Black KN-B (RB5) as a model pollutant for photocatalytic performance evaluation and establishing the experimental conditions yielding maximal photocatalytic activity. The photocatalytic degradation of RB5 is well fitted by a first-order kinetic model, and the good cycling stability and durability of BiVO4@ACFs highlight the potential applicability of the proposed composite. The enhanced photocatalytic activity of BiVO4@ACFs compared to those of BiVO4 and ACFs individually was mechanistically rationalized, and the suggested mechanism was verified by ultraviolet-visible spectroscopy, attenuated total reflectance Fourier-transform infrared spectroscopy, and RB5 degradation experiments. Thus, this work contributes to the development of BiVO4@ACF composites as effective photocatalysts for environmental remediation applications.
Introduction
The development of human society unavoidably causes environmental problems, necessitating the development of highly efficient pollution control methods such as photocatalytic decontamination. In particular, the application of photocatalysis for energy production and environmental protection (e.g., for organic pollutant degradation, hydrogen reduction, and solar cell fabrication) has recently received increased attention.1–3 In photocatalysts, photoexcited electrons are transferred from the valence band to the conduction band, where they can freely move within the crystal.4TiO2 is a widely used traditional photocatalyst.5,6 However, its large bandgap (3.2 eV) implies that this catalyst can only utilize ultraviolet light, thus necessitating the development of visible light-driven photocatalysts7 such as Bi-based semiconductors. For example, BiVO4, first synthesized in 1963, exhibits a relatively narrow bandgap of 2.3–2.4 eV and is therefore a promising photocatalyst.8 The valence band of BiVO4 mainly comprises the O 2p and V 3d orbitals, which allows photocatalytic O2 evolution under visible light irradiation. The use of BiVO4 to catalyze visible light-induced water splitting was first reported by Kudo et al., who demonstrated a new application of this semiconductor as a photocatalyst9 and inspired extensive research on its synthesis, characterization, and photocatalytic properties.10
Although photocatalysis has been widely used for the purification of dye-contaminated wastewater with partial contaminant degradation, the separation of spent photocatalysts remains challenging. Separation is typically addressed by immobilizing the active material on macroscopic supports.11,12 For example, Wu et al. reported a novel procedure for immobilizing BiVO4 on silica fibers, obtaining a catalyst with increased surface area and activity.13 Importantly, the choice of the immobilization method significantly affects the performance of the supported BiVO4, e.g., hydrothermal synthesis commonly yields catalysts with high degrees of crystallinity.
The abundance of delocalized electrons in their conjugated π-systems makes carbon materials promising supports, including fullerenes (C60), carbon nanotubes (CNTs), graphitic carbon nitride (g-C3N4), and activated carbon fibers (ACFs), which can potentially enhance charge separation and transport within the immobilized catalyst.14,15 Among them all, it was observed that the construction of a semiconductor heterojunction can greatly promote photocatalytic activity.16,17 Recently, ACFs have attracted much attention as pollutant adsorbents because of their high surface areas, diverse functional groups, narrow pore size distributions, and many raw material precursors.18 However, the adsorption of a given pollutant on ACFs is not accompanied by degradation, and ACFs have therefore been extensively explored as photocatalyst supports offering further photocatalytic performance enhancement. Lin et al. described CF-supported ordered mesoporous TiO2, revealing that the synergistic active material–support interactions enhanced the photocatalytic activity of this composite to levels exceeding those of commercial photocatalysts.19 Furthermore, ACF-supported N-doped TiO2 photocatalysts have also been reported.20 Nevertheless, the immobilization of BiVO4 on ACFs has been underexplored.
Herein, we investigated the hydrothermal immobilization of BiVO4 nanoparticles on ACFs, aiming to (a) develop a simple procedure of immobilizing BiVO4 on ACFs, (b) characterize the structure, properties, and photostability of the synthesized photocatalysts, and (c) determine the influence of the processing parameters on photocatalyst performance.
Experimental
Materials
ACFs were sourced from Nantong Sutong Carbon Fiber Co., Ltd. (Jiangsu, China). Bi(NO3)3·5H2O, NH4VO3, HNO3 (64–69%), NH4OH (35%), KI and ethylenediaminetetraacetic acid (EDTA) of analytical grade were purchased from Meryer Chemical (Shanghai, China). Reactive Black KN-B (RB5) was provided by Bomei Company (Anhui, China). All solutions were prepared using deionized water.Preparation of photocatalysts
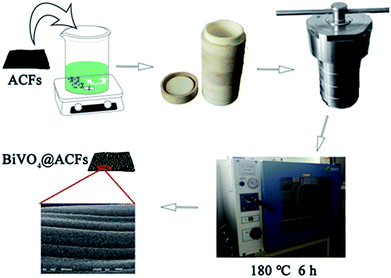
ACFs pretreated with ethanol (95%) and deionized water were dried at 70 °C for 12 h. As shown in Scheme 1, Bi(NO3)3·5H2O (2.1828 g) and a certain amount of EDTA were dissolved in dilute HNO3 (50 mL, 2 mM), and the resulting mixture was stirred at 90 °C for 30 min (200 rpm) with a magnetic stirrer to afford solution A. Solution B was obtained by dissolving NH4VO3 (0.5263 g) in deionized water (50 mL) at 60 °C. Subsequently, a dispersion of ACFs (1.0 g) in solution B was added to solution A, and the pH of the resulting mixture was adjusted by the slow dropwise addition of NH4OH. The above mixture was continuously stirred for 1 h at 50 °C, poured into a Teflon-lined stainless-steel autoclave (150 mL), and maintained at 180 °C for 6 h. The produced precipitate (BiVO4@ACFs) was washed with ethanol and deionized water several times and dried in a vacuum oven at 75 °C overnight.Instrumentation
X-ray diffraction (XRD; Ultima IV, Rigaku, Japan) patterns were recorded using high-intensity Cu Kα radiation (λ = 0.154 nm) in the range of 2θ = 10–80° at a scan rate of 5° min−1. Sample morphologies and surface elemental compositions were probed by scanning electron microscopy (SEM; JSM6510, JEOL, Japan) coupled with energy-dispersive spectrometry (EDS) at an accelerating voltage of 10 kV, and the sample surface was coated by a thin layer of gold before SEM characterization. The chemical states of the as-prepared composites were determined by X-ray photoelectron spectroscopy (XPS; ESCALAB 250XI, Thermo Electron Corporation, USA). Thermal stabilities were determined by thermogravimetric analysis (TGA; TG209F3, NETZSCH, Germany) performed under N2 in the temperature range of 40–800 °C at a heating rate of 10 °C min−1. Ultraviolet-visible (UV-Vis) absorption spectra were recorded on a UV-Vis spectrophotometer (Cary300, Agilent, USA) in the wavelength range of 200–800 nm. Dye concentrations were monitored by (a) UV-Vis spectroscopy and (b) Fourier-transform infrared (FTIR) spectroscopy (IS10, Thermo Fisher, USA; 600–4000 cm−1) using an attenuated total reflectance (ATR) accessory with a diamond crystal.Photocatalytic activity evaluation
Photodegradation tests were conducted in a photocatalytic reactor (XPA-XL, XJ, China) equipped with a 1000 W Xe arc lamp as a simulated sunlight source and featuring a 6 cm-diameter water-cooled quartz jacket placed in a stainless steel box. BiVO4@ACFs (0.2 g) and pure ACFs (0.2 g) were independently placed in a quartz tube containing aqueous RB5 (50 mL, 40 mg L−1), and the tube was immediately placed in darkness for 30 min to establish an adsorption equilibrium. Subsequently, the solution was magnetically stirred under visible-light irradiation for 3 h, and the residual dye concentrations were determined spectrophotometrically (V-1200, MAPADA, Shanghai, China). The efficiency of RB5 degradation (R) was calculated as21| R(%) = (1 − A/A0) × 100, | (1) |
In addition, to investigate the adsorption kinetics and suggest a possible degradation mechanism, the rate constants of photocatalytic RB5 degradation (k) were obtained from the following equation:22
| ln(C0/C) = kt, | (2) |
Results and discussion
Crystal phase composition
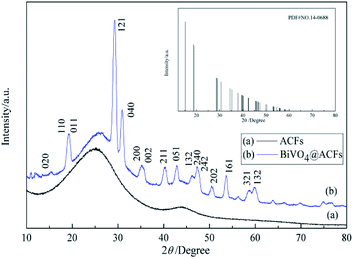
The phase purities and crystallinities of the samples are examined by XRD analysis (Fig. 1). Notably, the XRD pattern of ACFs (Fig. 1a) exhibits no peaks except for a broad signal at ∼25°, which is attributed to the carbon structure.23 Fig. 1b shows the XRD pattern of the BiVO4@ACFs, revealing the diffraction peaks of the (110), (011), (121), (040), (161) planes for BiVO4@ACFs at 2θ = 18.9°, 19.3°, 29.3°, 30.9°, and 53.6°; these are indexed to monoclinic scheelite-type BiVO4 (JCPDS no. 14-0688) and indicate that the surfaces of the ACFs are largely covered by BiVO4.24,25Surface morphology and textural properties
The morphologies and microstructures of the as-obtained products were investigated by SEM (Fig. 2). Compared to pristine the ACFs, which are smooth and feature long grooves on their surfaces (Fig. 2a), thick and sheet-like immobilized particles are observed for BiVO4@ACFs (Fig. 2c). In addition, Fig. 2b and d show the EDS spectra and the corresponding elemental compositions of the spots marked A (Fig. 2a) and B (Fig. 2c). The obtained results indicate that the BiVO4@ACFs contain C, O, Bi, and V (Bi![[thin space (1/6-em)]](https://www.rsc.org/images/entities/char_2009.gif) :
:![[thin space (1/6-em)]](https://www.rsc.org/images/entities/char_2009.gif) V ≈ 1
V ≈ 1![[thin space (1/6-em)]](https://www.rsc.org/images/entities/char_2009.gif) :
:![[thin space (1/6-em)]](https://www.rsc.org/images/entities/char_2009.gif) 1 mol mol−1), confirming the presence of BiVO4.26 Moreover, the insights provided by XRD analysis suggest that the BiVO4 nanoparticles are grown in situ on the surfaces of the ACFs.
1 mol mol−1), confirming the presence of BiVO4.26 Moreover, the insights provided by XRD analysis suggest that the BiVO4 nanoparticles are grown in situ on the surfaces of the ACFs.
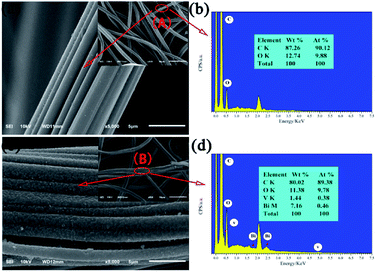 | ||
| Fig. 2 SEM images of (a) ACFs and (c) BiVO4@ACFs; (b) and (d) EDS spectra corresponding to points A and B, respectively. | ||
XPS analysis of as-prepared samples
Subsequently, the BiVO4@ACFs was characterized by XPS to gain further insight into its chemical composition, metal chemical states, and structure. Fig. 3a shows the survey spectrum of BiVO4@ACFs, which resembles that of pristine ACFs and indicates the presence of C, N, and O. However, weak V 2p peaks at 510–525 eV and a Bi signal at 156–168 eV are additionally observed in the former case. The Bi 4f spectrum (Fig. 3b) of BiVO4@ACFs displays two intense peaks at 159.58 and 164.93 eV, which are ascribed to the Bi 4f5/2 and Bi 4f7/2 transitions of Bi3+ ions.27 Fig. 3c shows the corresponding V 2p spectrum, showing peaks at 515.78 (V 2p5/2) and 523.83 eV (V 2p3/2) that correspond to surface V4+ and V5+ species, respectively.28,29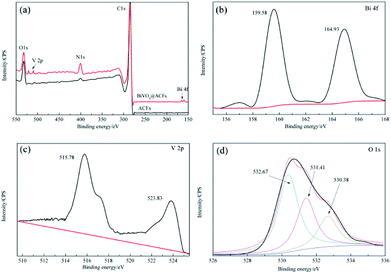 | ||
| Fig. 3 XPS spectra of ACFs before (black) and after BiVO4 deposition (red). (a) Survey spectra, (b) Bi 4f spectra, (c) V 2p spectra, and (d) O 1s spectra. | ||
The O 1s spectrum (Fig. 3d) is deconvoluted into three peaks at 530.38, 531.41, and 532.67 eV, indicating the presence of at least three types of O species. Based on the results of previous studies, the high-intensity peak at 532.67 eV is attributed to surface-adsorbed O,30 while the shoulder peak at 531.41 eV reflects the presence of C![[double bond, length as m-dash]](https://www.rsc.org/images/entities/char_e001.gif) O or C–O moieties.31,32 Finally, the signal at 530.38 eV is characteristic of lattice O in monoclinic BiVO4.33 Thus, the results of XPS analysis confirm the successful formation of a C–BiVO4 heterojunction.
O or C–O moieties.31,32 Finally, the signal at 530.38 eV is characteristic of lattice O in monoclinic BiVO4.33 Thus, the results of XPS analysis confirm the successful formation of a C–BiVO4 heterojunction.
Optimization of experimental conditions
For more sensitive detection of BiVO4 in the actual test, the conditions including the concentration of the precursor solution of BiVO4 were optimized. As shown in Fig. 4, the above concentration is varied from 0.06 to 0.3 M, and the maximum RB5 degradation efficiency is observed at 0.1 M. During the synthesis of BiVO4, the addition of EDTA caused the formation of Bi3+–EDTA− chelates via electrostatic interactions.34 At low Bi3+ concentrations, the gradual release of free Bi3+ from these complexes induced the formation of small amounts of monoclinic BiVO4.35 As the concentrations of Bi3+ and VO4− increased, the inhibitory effect of EDTA− decreased, which caused the fast growth of particles with large sizes.36 As the above concentrations continued to increase, the size of the BiVO4 particles became progressively larger, reflecting the decreasing influence of chelation by EDTA, which corresponded to decreased photocatalytic activity.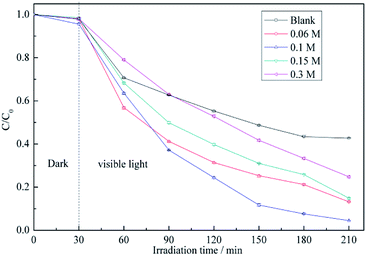 | ||
| Fig. 4 RB5 degradation profiles determined for different concentrations of precursor solution of BiVO4: (a) pristine ACFs, (b) 0.06 M, (c) 0.1 M, (d) 0.15 M, and (e) 0.3 M. | ||
The above assumption was further supported by TGA results. As shown in Fig. 5, the pristine ACFs exhibit good thermal stability,37 whereas the thermograms of BiVO4@ACFs recorded at temperatures from ambient to 800 °C show at least two weight losses. The first weight loss (<150 °C, ∼1%) is attributed to the removal of absorbed water,38 and the second one (150–480 °C, ∼7%) is ascribed to the combustion of EDTA.39
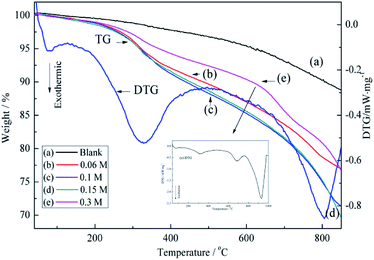 | ||
| Fig. 5 TGA curves obtained for different concentrations of precursor solution of BiVO4: (a) pristine ACFs, (b) 0.06 M, (c) 0.1 M, (d) 0.15 M, and (e) 0.3 M. | ||
Moreover, when the concentration of precursor solution of BiVO4 reaches 0.3 M, BiVO4 loading on the ACFs begins to decrease. According to the (e)-differential thermogravimetric (DTG) curve in Fig. 5, this is explained by the weak inhibitory effect of high BiVO4 concentration on the growth of BiVO4@ACFs. Moreover, a further change in BiVO4 crystallites is observed as the temperature reached 700 °C.40 Therefore, the concentration of precursor solution of BiVO4 in subsequent experiments is set to 0.1 M.
The presence of EDTA, a typical chelator, significantly affects the morphologies and microstructures of BiVO4, because the ligand can be adsorbed on the surface of BiVO4 nanoparticles and can thereby reduce their interfacial energy, with the possible mechanism of the above influence provided below.41
| Bi3+ + EDTA− → Bi3+–EDTA, | (3) |
| Bi3+–EDTA + VO4− + H2O → BiVO4 + EDTA− + 2H+. | (4) |
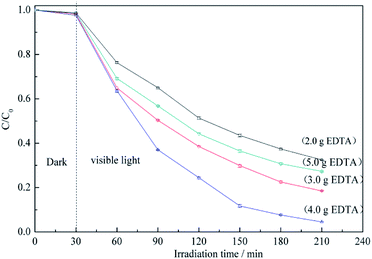
Fig. 6 shows the RB5 degradation profiles recorded in the presence of BiVO4@ACFs samples prepared using different amounts of EDTA. Notably, the fastest photocatalytic degradation is observed for the EDTA loading of 4.0 g. These data indicate that smaller amounts of BiVO4 are coated on ACFs as EDTA decreases, because EDTA balances the growth rates of different crystalline facets.39 In other words, high EDTA concentrations promote the formation of BiVO4@ACFs samples with irregular rod-like morphologies that show enhanced photodegradation performance.42 However, when the EDTA loading is further increased to 5.0 g, the photocatalytic activity decreases, because of the negative effects of such high concentrations on the anisotropic growth of single-crystalline BiVO4.43
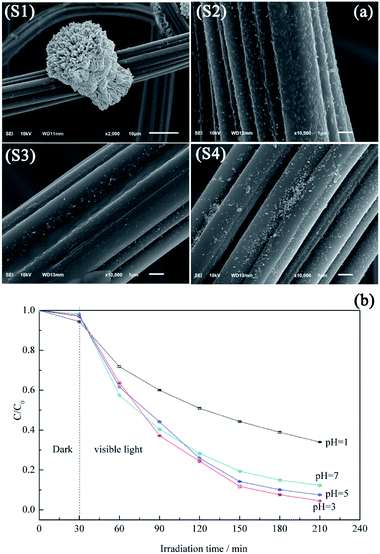
Fig. 7a shows the morphology variation of ACF-supported BiVO4 particles with pH, revealing that higher pH values promotes the lamellar crystallization of BiVO4, which decreases the number of BiVO4 particles.44 At pH 1, the protonation of EDTA and its precipitation decreases the chelation ability of the ligand, thus allowing the growth of large and highly crystalline BiVO4 particles (Fig. 7a(S1)), which corresponds to low photocatalytic activity.45 Samples prepared at pH 3 and 5 exhibit irregular rod-like morphologies (Fig. 7a(S2 and S3), respectively) and show good photocatalytic activities (Fig. 7b). At these pH values, the increased extent of branching decreases the BiVO4 particle size, which is ascribed to the accelerated hydrolysis of bismuth nitrate and the extensive precipitation of the poorly water-soluble BiONO3.46 As the pH further increases to 7.0, large numbers of pellet-like particles are produced (Fig. 7a(S4)), attributed to the crystal growth rate exceeding the nucleation rate.47 However, this observation is also explained by the reduced crystal surface area and the weakened chelation ability of EDTA.48,49
Photocatalytic degradation performance of as-synthesized samples and a possible mechanistic explanation
Five initial RB5 concentrations (40, 50, 60, 80, and 100 mg L−1) are used to determine the effect of the above parameter on the degradation rate (Fig. 8a). The photodegradation efficiency is increased with decreasing initial RB5 concentration, which is mainly attributed to the reduction of light penetration efficiency (i.e., the decreased amount of photons arriving at the catalyst surface) at high initial concentrations.50 Moreover, as the initial RB5 concentration decreases, the slope of the ln(C0/C) vs. t plot becomes steeper (Fig. 8b), which indicates the existence of a certain linear correlation between these parameters at different initial RB5 concentrations and implies that the photocatalytic degradation of RB5 is a first-order reaction.51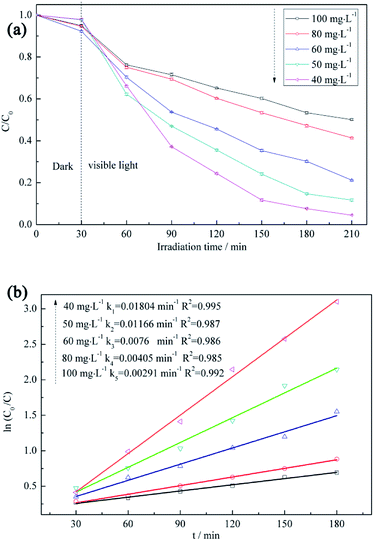 | ||
| Fig. 8 (a) RB5 degradation profiles recorded at different initial RB5 concentrations and (b) first-order kinetics describing the adsorption of RB5 on BiVO4@ACFs. | ||
Sample durability was evaluated by using a given specimen for multiple degradation runs. The recycling test was performed three times and all samples were washed with deionized water and ethanol and subsequently dried at 75 °C for 2 h.
Fig. 9a shows that the photocatalytic activity of BiVO4@ACFs remains stable in the first two cycles and exceeds that of pristine ACFs at all times. In the third cycle, 65% of RB5 is removed by 2 h photolysis, which confirms that the BiVO4@ACFs sample is less affected than ACFs during oxidation. On the contrary, the RB5 removal efficiency of only 20% is obtained by ACFs in the third cycle. Therefore, it is concluded that dye molecules and intermediates compete with each other for the limited adsorption and catalytic sites on the catalyst surface, which decreases the photodegradation efficiency.52 In addition, the morphologies and phases of the used BiVO4@ACFs were further investigated. As shown in Fig. 9b, the used BiVO4@ACFs exhibits almost no difference in SEM images and XRD patterns compared with those obtained before photocatalytic reaction, and the used BiVO4 remains firmly attached to the surface of ACFs, rather than easily exfoliated from the mechanical stirring of the RB5 solutions for long durations. Moreover, the spent catalysts are easily separated from the reaction system.24
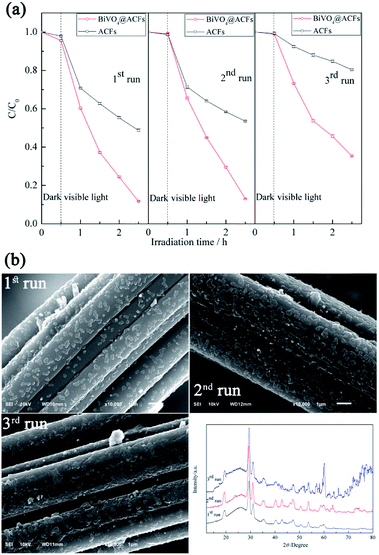 | ||
| Fig. 9 (a) Performances of tested samples in three consecutive RB5 photodegradation runs; (b) morphologies and XRD patterns of BiVO4@ACFs after RB5 degradation. | ||
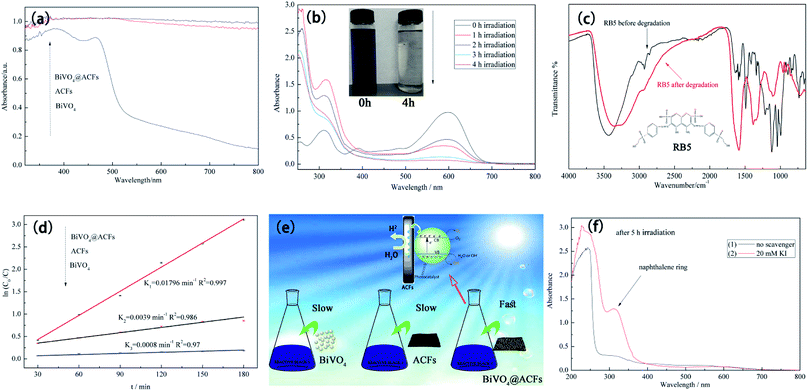
Fig. 10a compares the UV-Vis diffuse reflectance spectra of ACFs, BiVO4@ACFs, and BiVO4, revealing that all samples except for BiVO4 exhibit strong absorption in the visible-light region (400–800 nm), as indirectly confirmed by the black hue of the ACFs.53 These results clearly demonstrate that the intense absorption of visible light by BiVO4@ACFs provide greater photocatalytic activity than shown by pristine ACFs and BiVO4 individually.
The time-dependent UV-Vis spectrum of RB5 (40 mg L−1) recorded under visible light irradiation in the presence of BiVO4@ACFs (0.2 g) (Fig. 10b) reveals the presence of two main absorption peaks. The first peak is located in the visible region (598 nm) and reflects the presence of the azo (–N![[double bond, length as m-dash]](https://www.rsc.org/images/entities/char_e001.gif) N–) chromophore, whereas the second is located in the UV region (310 nm) and reflects the presence of naphthalene rings.54 Both peaks lose intensity and eventually disappear with increased irradiation time, corresponding to the degradation of RB5.55
N–) chromophore, whereas the second is located in the UV region (310 nm) and reflects the presence of naphthalene rings.54 Both peaks lose intensity and eventually disappear with increased irradiation time, corresponding to the degradation of RB5.55
Structural and elemental analyses of RB5 before and after irradiation were performed using ATR-FTIR spectroscopy. The spectrum of pristine RB5 (Fig. 10c) features a peak at 3436 cm−1 assigned to O–H stretching of alcohols and N–H stretching of amines. Peaks at 2927 and 2854 cm−1 are assigned to CH3 asymmetric and symmetric vibrations and to CH2 asymmetric vibrational stretching, respectively. The typical peak at 1492 cm−1 is assigned to aromatic ring-bonded –N![[double bond, length as m-dash]](https://www.rsc.org/images/entities/char_e001.gif) N– moieties, and that at 1122 cm−1 is attributed to sulfoxide (S
N– moieties, and that at 1122 cm−1 is attributed to sulfoxide (S![[double bond, length as m-dash]](https://www.rsc.org/images/entities/char_e001.gif) O) groups.56 In contrast, the ATR-FTIR spectrum of RB5 after photocatalytic degradation (Fig. 10c) shows no peak at 1492 cm−1, indicating the breakage of the azo bond, and the appearance of the peak at 1589 cm−1 is thought to reflect the formation of quinine-like structures.57
O) groups.56 In contrast, the ATR-FTIR spectrum of RB5 after photocatalytic degradation (Fig. 10c) shows no peak at 1492 cm−1, indicating the breakage of the azo bond, and the appearance of the peak at 1589 cm−1 is thought to reflect the formation of quinine-like structures.57
To determine the extent of C–BiVO4 coupling in the synthesized heterostructures, we explored the photocatalytic activities of ACFs, BiVO4 nanoparticles, and BiVO4@ACFs for the visible light-driven degradation of RB5. Fig. 10d shows the results of kinetic data fitting obtained for the photo-degradation of RB5 solution (40 mg L−1) under visible light illumination, revealing that the k value (0.01796 min−1) of BiVO4@ACFs is much higher than those of ACFs (0.0039 min−1) and BiVO4 (0.0008 min−1).
The formation mechanism of BiVO4@ACFs is represented in Fig. 10e. In the above composite, the highly conductive ACFs act as both charge carriers and electronic transmission media,58 allowing fast electron transfer from ACFs to BiVO4 and highly efficient dye degradation upon visible-light irradiation.59 Moreover, water adsorbed on the sample surface reacts with the photogenerated holes (hvb+) to afford ·OHads radicals as strong oxidizing agents.60 Hence, the azo bond of RB5 is easily attacked and cleaved by the above radicals, causing dye degradation, as summarized in eqn (5)–(7).61
| Photocatalyst + hν → hvb+ + ecb−, | (5) |
| hvb+ + OH−ads → ·OHads, | (6) |
| hvb+/·OHads + dye → degraded products, | (7) |
| I− + hvb+ →I· + e−, | (8) |
| I− + ·OHads → I· + OH−. | (9) |
The proposed mechanism was further verified by KI, which reacts with hvb+ and ·OHads, as summarized in eqn (8) and (9). As shown in Fig. 10f, when 20 mM KI is used as a diagnostic tool, an adsorption peak appears at 227 nm, and the peak located in the visible region (310 nm) does not disappear. This result displays that the naphthalene rings are mainly cleaved by reaction with hvb+ and ·OHads.
Conclusions
Herein, we established a facile procedure for immobilizing BiVO4 on ACFs and investigated the photocatalytic activities of the obtained composites. To improve the above activities and meet the requirements of practical applications, the effects of parameters such as the concentrations of the precursor solutions of BiVO4 and EDTA and the initial pH on sample structure and morphology were studied in detail. Based on the results of a series of measurements and performance tests, the above parameters were concluded to have important effects on the morphologies of the as-prepared samples.Moreover, the photocatalytic decolorization of RB5 was shown to be a first-order reaction. Compared to BiVO4 and ACFs, BiVO4@ACFs exhibited improved visible-light adsorption properties as well as increased stability and charge-separation efficiency, thus featuring enhanced RB5 degradation activity. This activity increase was mainly attributed to the formation of a heterojunction electric field between BiVO4 and ACFs, and a possible mechanism was proposed. Thus, we demonstrated that BiVO4@ACFs is a promising carbon-based material for photocatalysis and environmental applications.
Conflicts of interest
There are no conflicts to declare.Acknowledgements
This research was funded by the Nature Science Foundation of the Jiangsu Higher Education Institutions of China (16KJB540002). It is also funded by Nantong applied research program (GY12016031). The authors are also thankful for the support of the Fundamental Research Funds for the Nantong Universities (No. 17ZH158).Notes and references
- M. M. Khin, A. S. Nair, V. J. Bahu, R. Murugan and S. Ramakrishna, Energy Environ. Sci., 2012, 5, 8075–8109 RSC.
- S. Natarajan, H. C. Baiaj and R. J. Tayade, J. Environ. Sci., 2018, 3, 201–202 CrossRef PubMed.
- C. M. Suarez, S. Hernandez and N. Russo, Appl. Catal., A, 2015, 504, 158–170 CrossRef.
- A. Selloni, Nat. Mater., 2008, 7, 613–615 CrossRef PubMed.
- A. Fujishima and K. Honda, Nature, 1972, 238, 37–38 CrossRef PubMed.
- D. Yang, H. Liu, Z. Zheng, Y. Yuan, J. C. Zhao, E. R. Waclawik, X. Ke and H. Zhu, J. Am. Chem. Soc., 2009, 131, 17885–17893 CrossRef PubMed.
- R. A. He, S. W. Cao, P. Zhou and J. Yu, Chin. J. Catal., 2014, 35, 989–1007 CrossRef.
- R. Roth and J. Waring, Am. Mineral., 1963, 18, 1348–1356 Search PubMed.
- A. Kudo, K. Ueda, H. Kato and I. Mikami, Catal. Lett., 1998, 53, 229–230 CrossRef.
- K. R. Tolod, S. Hernandez and N. Russo, Catalysts, 2017, 7, 13 CrossRef.
- J. Z. Su, L. J. Guo, N. Z. Bao and C. A. Grimes, Nano Lett., 2011, 11, 1928–1933 CrossRef PubMed.
- L. Dong, X. F. Zhang, X. I. Dong, X. X. Zhang, C. Ma, H. C. Ma, M. Xue and F. Shi, J. Colloid Interface Sci., 2013, 393, 126–129 CrossRef PubMed.
- Q. Wu, P. F. Chen, L. Zhao, J. Wu, X. M. Qi and W. F. Yao, Catal. Commun., 2014, 49, 29–33 CrossRef.
- X. Lin, D. Xu, Y. Xi, R. Zhao, L. N. Zhao, M. S. Song, H. J. Zhai, G. B. Che and L. M. Chang, Colloids Surf., A, 2017, 513, 117–124 CrossRef.
- X. Lin, Y. Xi, R. Zhao, J. Y. Shi and N. Yan, RSC Adv., 2017, 7, 53847–53854 RSC.
- X. Lin, D. Xu, S. S. Jiang, F. Xie, M. S. Song, H. J. Zhai, L. N. Zhao, G. B. Che and L. M. Chang, Catal. Commun., 2017, 89, 96–99 CrossRef.
- X. Lin, D. Xu, R. Zhao, Y. Xi, L. N. Zhao, M. S. Song, H. J. Zhai, G. B. Che and L. M. Chang, Sep. Purif. Technol., 2017, 178, 163–168 CrossRef.
- C. L. Mangun, K. R. Benak, J. Economy and K. L. Foster, Carbon, 2001, 39, 1809–1820 CrossRef.
- X. Lin, M. Li, Y. J. Li and W. Chen, RSC Adv., 2015, 5, 105227–105238 RSC.
- X. D. Wang, K. Zhang, X. L. Guo, G. D. Shen and J. Y. Xiang, New J. Chem., 2014, 38, 6139–6146 RSC.
- C. Gu, S. Xiong, Z. X. Zhong, Y. Wang and W. H. Xing, RSC Adv., 2017, 7, 22234–22242 RSC.
- J. Y. Gao, C. H. Liu, F. Wang, L. J. Jia, K. J. Duan and T. C. Liu, Nanoscale Res. Lett., 2017, 12, 377 CrossRef PubMed.
- G. Jiang, X. Li, Z. Wei, X. Wang, T. Jiang, X. Du and W. Chen, Powder Technol., 2014, 261, 170–175 CrossRef.
- T. Ahmed, H. L. Zhang, H. B. Xu and Y. Zhang, Colloids Surf., A, 2017, 531, 213–220 CrossRef.
- J. F. Ma, J. H. Chen, B. Wang and S. Cai, Mater. Res. Bull., 2016, 77, 253–257 CrossRef.
- Q. Wu, P. F. Chen, L. Zhao, J. Wu, X. M. Qi and W. F. Yao, Catal. Commun., 2014, 49, 29–33 CrossRef.
- J. Y. Gao, C. H. Lin, F. Wang, L. J. Jia, K. J. Duan and T. C. Liu, Nanoscale Res. Lett., 2017, 12, 377 CrossRef PubMed.
- Z. X. Zhao, H. X. Dai, J. G. Deng, Y. X. Liu and C. T. Au, Chin. J. Catal., 2013, 34, 1617–1626 CrossRef.
- A. Saha and D. P. Eyman, Ind. Eng. Chem. Res., 2011, 50, 9027–9033 CrossRef.
- W. B. Li, Y. P. Zhang, Y. Y. Bu and Z. Y. Chen, J. Alloys Compd., 2016, 680, 677–684 CrossRef.
- C. Gu, S. Xiong, Z. X. Zhong, Y. Wang and W. H. Xing, RSC Adv., 2017, 7, 22234–22242 RSC.
- J. Fang, H. Fan and G. Dong, Mater. Lett., 2014, 120, 147–150 CrossRef.
- R. Wang and L. Cao, J. Alloys Compd., 2017, 722, 445–451 CrossRef.
- V. Stavila, R. L. Davidovich, A. Gulea and K. H. Whitemire, Coord. Chem. Rev., 2006, 250, 2780–2810 CrossRef.
- W. T. Sun, M. Z. Xie, L. Q. Jiang, Y. B. Luan and H. G. Fu, J. Solid State Chem., 2011, 184, 3050–2054 CrossRef.
- M. L. Guan, D. K. Ma, S. W. Hu, Y. J. Chen and S. M. Huang, Inorg. Chem., 2011, 50, 800–805 CrossRef PubMed.
- C. C. Zhang, L. L. Gong, Q. H. Mao, P. F. Han, X. P. Lu and J. G. Qu, RSC Adv., 2018, 8, 14414–14421 RSC.
- Z. D. Lu, Q. F. Lu, C. Q. Zheng, Z. F. Yao and J. J. Mu, J. Alloys Compd., 2015, 651, 29–33 CrossRef.
- L. Y. Zhang, Z. X. Dai, G. H. Zheng, Z. F. Yao and J. J. Mu, RSC Adv., 2018, 8, 10654–10664 RSC.
- G. C. Du, Z. H. Sun, Y. Xian, H. J. Chen, H. Jing, D. F. Yin and H. J. Tang, Iron, Steel, Vanadium, Titanium, 2015, 5, 34–39 Search PubMed.
- C. Regmi, G. Gyawall, T. H. Kim, B. Joshi, S. K. Ray, Y. H. Jo and S. W. Lee, J. Nanosci. Nanotechnol., 2016, 16, 11180–11185 CrossRef.
- S. M. Sun, W. Z. Wang, L. Zhou and H. L. Xu, Ind. Eng. Chem. Res., 2009, 48, 1735–1739 CrossRef.
- G. S. Zhao, W. Liu, Y. Hao, Z. Zhang, Q. Li and S. L. Zang, Dalton Trans., 2018, 47, 1325–1336 RSC.
- S. M. Thalluri, C. O. Suarez, S. Hermandez, S. Bensaid, G. Saiacco and N. Russo, Chem. Eng. J., 2014, 245, 124–132 CrossRef.
- L. Zhou, W. Z. Wang, L. S. Zhang, H. L. Xu and W. Zhu, J. Phys. Chem. C, 2007, 111, 13659–13664 CrossRef.
- S. Tokunaga, H. Kato and A. Kudo, Chem. Mater., 2001, 13, 4624–4628 CrossRef.
- G. Q. Tan, L. L. Zhang, H. T. Ren, S. S. Wei, J. Huang and A. Xia, ACS Appl. Mater. Interfaces, 2013, 5, 5186–5193 CrossRef PubMed.
- D. Wang, H. Jiang, X. Zhong, Q. Xu, Y. Ma, G. Li and C. Li, Chem.–Eur. J., 2011, 17, 1275–1282 CrossRef PubMed.
- Z. F. Zhu, J. Du, J. Q. Li, Y. L. Zhang and D. G. Liu, Ceram. Int., 2012, 38, 4827–4834 CrossRef.
- B. Zhou, X. Zhao, H. J. Liu, J. H. Qu and C. P. Huang, Appl. Catal., B, 2010, 99, 214–221 CrossRef.
- M. S. Lucas, P. B. Tavares, J. A. Peres, J. L. Faria, M. Rocha, C. Peraia and C. Freire, Catal. Today, 2013, 209, 116–121 CrossRef.
- H. L. Tan, R. Amal and Y. H. Ng, J. Mater. Chem. A, 2017, 5, 16498–46521 RSC.
- J. W. Shi, H. J. Cui, J. W. Chem, M. L. Fu, B. Xu, H. Y. Luo and Z. L. Ye, J. Colloid Interface Sci., 2012, 388, 201–208 CrossRef PubMed.
- W. F. Khalik, L. N. Ho, S. A. Ong, C. H. Voon, Y. S. Wong, N. Yusoff, S. L. Lee and S. Y. Yusuf, Chemosphere, 2017, 184, 112–119 CrossRef PubMed.
- S. A. Ong, O. M. Min, L. N. Ho, Y. S. Wong and F. M. Ridwan, J. Water Reuse Desalin., 2011, 14, 202–207 CrossRef.
- M. Bilal, T. Rasheed, H. M. N. Iqbal, H. B. Hu, W. Wang and X. H. Zhang, Environ. Manage., 2018, 61, 171–180 CrossRef PubMed.
- M. Gahlout, S. Gupte and A. Gupte, 3 Biotech, 2013, 3, 143–152 CrossRef PubMed.
- T. F. Ma, J. Bai and C. P. Li, Vacuum, 2017, 145, 47–54 CrossRef.
- G. Manna, R. Bose and N. Pradhan, Angew. Chem., Int. Ed., 2014, 53, 6743–6746 CrossRef PubMed.
- S. K. Kansal, N. Kaur and S. Singh, Nanoscale Res. Lett., 2009, 4, 709–716 CrossRef PubMed.
- S. Song, L. J. Xu, Z. H. He and J. M. Chen, Environ. Sci. Technol., 2007, 41, 5846–5853 CrossRef PubMed.
| This journal is © The Royal Society of Chemistry 2018 |

