 Open Access Article
Synthesis of Zn-based metal–organic frameworks in ionic liquid microemulsions at room temperature†
Ranfeng Ye ,
Min Ni,
Yuanyuan Xu,
Hao Chen
 and
Shengqing Li
 *
*
College of Science, Huazhong Agricultural University, Wuhan, Hubei 430070, People’s Republic of China. E-mail: sqingli@mail.hzau.edu.cn
First published on 23rd July 2018
Abstract
For the first time, Zn-metal–organic frameworks (Zn-MOFs) were prepared using Zn2+ and the aromatic ligand 1,3,5-benzenetricarboxylic acid (BTC) in ionic liquid microemulsions stabilized by the surfactant TX-100. This proposed environmentally friendly approach to synthesize Zn-MOFs is simple, requires no energy input, and operates at room temperature. The synthesized Zn-MOFs were characterized by scanning electron microscopy (SEM), transmission electron microscopy (TEM), single crystal X-ray diffraction and powder X-ray diffraction (XRD), thermal gravimetric analysis (TGA), and Fourier transform infrared spectroscopy (FT-IR). The results showed that two different Zn-MOF crystals had been successfully synthesized and that [NaZn(C9H3O6)(H2O)4]·1.5H2O was prepared by using this method for the first time. The influence of different parameters such as the pH value, the ratio of reactants, and reaction time on the morphology and size of the Zn-MOFs was studied. Long rod Zn-MOFs with an average size of ∼25 μm could be obtained in the ionic liquid microemulsions with a molar ratio (organic ligand to metal ion) of 1![[thin space (1/6-em)]](https://www.rsc.org/images/entities/char_2009.gif) :
:![[thin space (1/6-em)]](https://www.rsc.org/images/entities/char_2009.gif) 1 at pH 5.98 for 24 h. The crystal type and morphology of the Zn-MOFs could be controlled by the ionic liquid microemulsions at room temperature. This green synthesis method can be used to study their industrial production.
1 at pH 5.98 for 24 h. The crystal type and morphology of the Zn-MOFs could be controlled by the ionic liquid microemulsions at room temperature. This green synthesis method can be used to study their industrial production.
Introduction
Metal–organic frameworks (MOFs) are a class of crystalline material, constructed by the coordination of organic ligands to metal ions or clusters. MOFs are known for their extraordinary high surface areas, capability for catalysis, tunability of their pore sizes and shapes, diverse topologies and adjustable internal surface properties.1,2 By virtue of these merits, MOFs hold great promise in a variety of potential applications including, but not limited to, gas adsorption,3,4 catalysis,5,6 removal of dyes,7,8 drug delivery,9 biomedical imaging,10 as stationary phases for gas chromatography and liquid chromatography,11 and chemical sensors.12 Various synthetic strategies have been employed to produce MOFs, including solvothermal,13,14 microwave,15 ultrasonic,16 electrochemical,17 etc. These methods provide possibilities to synthesize MOFs, but have the obvious disadvantages of requirements for relatively harsh reaction conditions, high usage of organic solvents or additional energy demands. Thus, it is more desirable to develop facile and green synthetic routes for MOFs by maximizing the efficiency and cleanliness of chemical processes.Microemulsions are isotropic mixtures of two or more immiscible liquids that coexist in a single phase in the presence of a surfactant or surfactant/co-surfactant mixture.18,19 Due to their ability to host a variety of polar (e.g. water) and nonpolar (e.g. aliphatic hydrocarbon) species simultaneously, these thermodynamically stable dispersions provide a unique microenvironment for processing chemical reactions and particularly, a efficient way to synthesize nanomaterials.20–22 Besides, each droplet in the microemulsions can be considered as an individual nanoreactor where nanoparticles (NPs) nucleate, grow and crystallize in a confined way. Therefore, nanoparticle size and crystallinity can be better controlled, which is the key to obtain nanomaterials with appropriate and reproducible properties.23 However, the main drawback of the microemulsion method to prepare nanomaterials is the use of organic solvents as a component. For the construction of environmentally friendly systems to produce nanomaterials, ionic liquids are regarded as the ideal replacement for traditional organic solvents and form ionic liquid microemulsions because they have not only excellent solvency for both organic and inorganic compounds but also the features of non-flammability, low volatility, high chemical and thermal stability and recyclability.24,25 Such ionic liquid based microemulsion systems possess both the advantages of conventional microemulsions and ionic liquids, and have been developed as promising media for synthesizing some metal nanomaterials, such as gold NPs,26 silica NPs,27 silver NPs,28 palladium NPs,29 etc. Recently, differently shaped and sized La-metal–organic frameworks (La-MOFs) have been successfully synthesized in ionic liquid microemulsions, presenting a new route for MOF synthesis.30
Here, for the first time, two different Zn-MOF crystals were prepared using H2O/TX-100/[Bmim]PF6 microemulsions. This proposed environmentally friendly approach to synthesize Zn-MOFs is simple, requires no energy input, and operates at room temperature. Meanwhile, the influence of the ratio of reactants, the pH value, and the reaction time on the morphology of the Zn-MOFs was investigated in the ionic liquid microemulsions. The synthesis, size, morphology, crystal structures and thermal properties of the Zn-MOFs have been discussed in detail.
Results and discussion
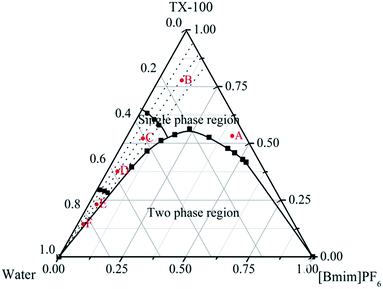
The water/TX-100/[Bmim]PF6 system could form microemulsions according to previous work by Gao et al.35 The ternary phase diagram is shown in Fig. 1. The three types of subregion including water-in-[Bmim]PF6, bicontinuous, and [Bmim]PF6-in-water respectively were divided in the single phase region by potentiometric titration. In this work, the organic ligand BTC was selected due to the presence of –COOH groups, which made the synthesis of MOFs easier at room temperature. Zn-MOFs with different crystal structures and morphologies were synthesized in different subregions of the ionic liquid microemulsions according to well established procedures, and the process is shown in Scheme 1.According to the ternary phase diagram of the water/TX-100/[Bmim]PF6 system, we synthesized the Zn-MOFs using the same ratio of reactants in different regions (A–F) of the microemulsions. The SEM images show that the Zn-MOFs prepared in the microemulsions A, B and C, and the microemulsions D, E and F were mainly granular and rod-like, respectively (Fig. 2). Therefore, the shape of the Zn-MOFs could be controlled by using different regions of the microemulsions in the synthesis.
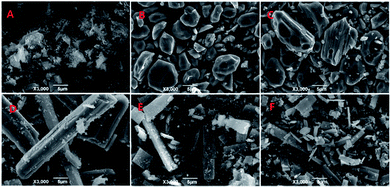 | ||
| Fig. 2 SEM images of the Zn-MOFs. A–F correspond to the Zn-MOFs prepared in the microemulsion A–F regions marked in Fig. 1, respectively. | ||
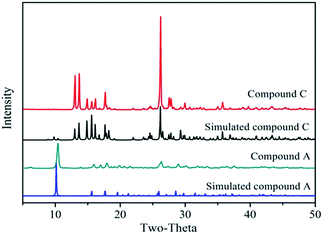
Fig. 3 shows the powder XRD patterns of the Zn-MOFs prepared in the corresponding ionic liquid microemulsions marked as A–F respectively in Fig. 1. Samples A, B and F possess different XRD patterns to samples C, D and E. By comparing the powder XRD patterns, it was confirmed that two kinds of completely different crystal structure had been prepared, and the powder XRD patterns matched very well with the simulated patterns of the respective materials (Fig. 4).
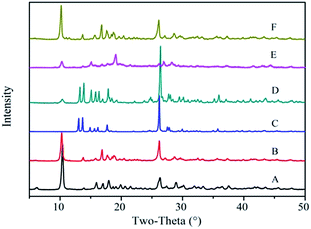 | ||
| Fig. 3 The powder XRD patterns of the Zn-MOFs prepared in the corresponding ionic liquid microemulsion A–F regions marked in Fig. 1. | ||
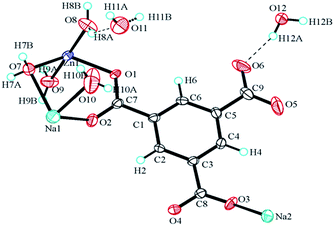
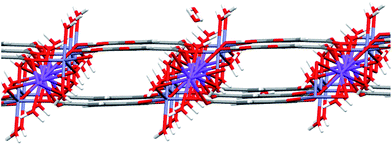
The formula of compound A is [Zn6(OH)3(C9H3O6)3(H2O)3]·7H2O (CCDC: 823406). For the first time, we successfully synthesized compound C using this method. The crystal data and structure parameters of compounds A and C are shown in Table 1. The structure of compound C was confirmed by single crystal X-ray diffraction analysis. The results suggest that compound C is in the triclinic space group P![[1 with combining macron]](https://www.rsc.org/images/entities/char_0031_0304.gif) , with the formula [NaZn(C9H3O6)(H2O)4]·1.5H2O. There are two Na+ ions, one Zn2+ ion, one BTC ligand, eight coordinated H2O molecules, and one point five free water molecules scattered at several sites in the asymmetric unit (Fig. 5). Each Zn(1) connects with two carboxyl oxygen atoms (O(1) and O(4A)) from two different BTC ligands and three oxygen atoms (O(7), O(8), and O(9)) from three coordinated H2O molecules, the lengths of the Zn–O bonds are in the range 1.978–2.213 Å. Each Na atom is six-coordinated including Na(1) and Na(2) which have different arrangements of ligands. Na(1) connects two carboxyl oxygen atoms (O(2) and O(2A)) from two BTC linkers and four oxygen atoms (O(7), O(7A), O(10), and O(10A)) from four coordinated H2O molecules. Na(2) is bound with four carboxyl oxygen atoms (O(1A), O(1B), O(3) and O(3C)) from four BTC linkers and two oxygen atoms (O(8A) and O(8B)) from two coordinated H2O molecules. Each BTC in compound C is completely deprotonated, binding to two separate Zn atoms and three Na atoms. Furthermore, the 3D porous structure of compound C is shown in Fig. 6.
, with the formula [NaZn(C9H3O6)(H2O)4]·1.5H2O. There are two Na+ ions, one Zn2+ ion, one BTC ligand, eight coordinated H2O molecules, and one point five free water molecules scattered at several sites in the asymmetric unit (Fig. 5). Each Zn(1) connects with two carboxyl oxygen atoms (O(1) and O(4A)) from two different BTC ligands and three oxygen atoms (O(7), O(8), and O(9)) from three coordinated H2O molecules, the lengths of the Zn–O bonds are in the range 1.978–2.213 Å. Each Na atom is six-coordinated including Na(1) and Na(2) which have different arrangements of ligands. Na(1) connects two carboxyl oxygen atoms (O(2) and O(2A)) from two BTC linkers and four oxygen atoms (O(7), O(7A), O(10), and O(10A)) from four coordinated H2O molecules. Na(2) is bound with four carboxyl oxygen atoms (O(1A), O(1B), O(3) and O(3C)) from four BTC linkers and two oxygen atoms (O(8A) and O(8B)) from two coordinated H2O molecules. Each BTC in compound C is completely deprotonated, binding to two separate Zn atoms and three Na atoms. Furthermore, the 3D porous structure of compound C is shown in Fig. 6.
| Compound A13 | Compound C | |
|---|---|---|
| Empirical formula | Zn6C27H32O31 | NaZnC9H14O11.5 |
| Formula weight | 1244.75 | 394.56 |
| Temperature (K) | 298 | 296(2) |
| Wavelength | 0.71073 | 0.71073 |
| Crystal system | Trigonal | Triclinic |
| Space group | R3c | P![[1 with combining macron]](https://www.rsc.org/images/entities/char_0031_0304.gif) |
| a (Å) | 30.159(4) | 7.0980(11) |
| b (Å) | 30.159(4) | 9.8000(16) |
| c (Å) | 6.9280(14) | 11.2043(17) |
| α (deg) | 90 | 66.923 |
| β (deg) | 90 | 73.598 |
| γ (deg) | 120 | 84.720 |
| Volume (Å3) | 5457.2(16) | 687.68(19) |
| Z | 6 | 2 |
| Density (g cm−3) | 2.273 | 1.88 |
| F (0 0 0) | 3732 | 402 |
| Crystal size (mm3) | 0.15 × 0.15 × 0.30 | 0.05 × 0.03 × 0.02 |
| Theta range for data collection (deg) | 2.34, 33.49 | 2.30, 32.0 |
| Absorption correction | Multi-scan | Multi-scan |
| Goodness-of-fit on F2 | 1.004 | 0.97 |
| Final R indices [I > 2sigma(I)] | 0.0519, 0.1281 | 0.0510, 0.1329 |
| R indices (all data) | 0.0619, 0.1348 | 0.0977, 0.1130 |
| Largest diff. peak and hole (Å−3) | 2.42, −0.79 | 0.79, −0.69 |
The FT-IR spectra of the Zn-MOFs are shown in Fig. S1 in the ESI.† The broad absorption bands from the asymmetric and symmetric stretching vibrations of water molecules appear at 3700–2800 cm−1. The Zn-MOFs have strong absorption bands at 1629 and 1544 cm−1, which can be attributed to the stretching vibrations and asymmetric stretching vibrations of the carboxylate groups (COOM) in the BTC ligand, respectively. The vibrations of the C–H groups in the benzene ring give adsorption bands from 763–731 cm−1. The characteristic peaks of protonated carboxyl groups (1730–1680 cm−1) are not observed in the FT-IR spectra, indicating that the BTC has been completely deprotonated in the reaction and acts as the bridging ligand to form Zn-MOFs.
The thermal stabilities of compounds A and C were measured by TGA (Fig. S2 in the ESI†) in an air atmosphere, and the related data indicated that thermal decomposition of compounds A and C proceeded with two distinct weight losses between 30 and 650 °C. The first weight loss was attributed to the departure of all the water molecules in the temperature range 80–150 °C, without further weight loss up to 400 °C. The second weight loss corresponded to the release of the organic ligands and happened from 400 to 550 °C, resulting in ZnO and Na2CO3 as the residue. The results showed that the Zn-MOFs had been prepared.
The specific surface areas of the Zn-MOFs were characterized by the N2 adsorption–desorption method, and an adsorption–desorption isotherm curve is presented in Fig. S3 in the ESI.† The BET surface area of the Zn-MOFs synthesized in the ionic liquid microemulsion C region was calculated to be 6.137 m2 g−1. Such a low surface area of the Zn-MOFs may be due to the fact that a considerable number of the open pores were blocked by the ionic liquid microemulsion during the synthesis processes.
As an example, the Zn-MOFs prepared in the microemulsion F region marked in Fig. 1 were chosen to study the effect of pH values on the morphology of the Zn-MOFs. As shown in Fig. 7, when the pH was 5.98, the morphology of the Zn-MOFs was a long rod. The higher the pH value, the more particles with small sizes were produced on the surface of the Zn-MOFs. This could be attributed to the etching effect on the surface of the Zn-MOFs under the strongly alkaline conditions.
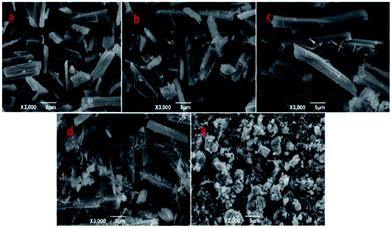 | ||
| Fig. 7 SEM micrographs of the Zn-MOFs which were prepared in the ionic liquid microemulsion F region marked in Fig. 1. (a) pH = 5.98, (b) pH = 8.51, (c) pH = 9.89, (d) pH = 12.0, and (e) pH = 13.5. | ||
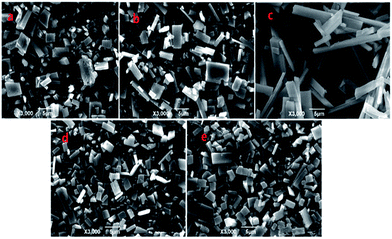
In order to evaluate whether the ratio of reactants had an effect on the morphology of the Zn-MOFs, different ratios of reactants were selected to study the morphology of the product in the microemulsion F region marked in Fig. 1. The SEM images of the Zn-MOFs show that different morphologies of the Zn-MOFs have been prepared with different ratios of reactants (Fig. 8). When the mole ratio of organic ligand (BTC) to metal ion (Zn2+) was 0.5, the morphology of the Zn-MOFs prepared was a rod. As the mole ratio increased to 2.0, the morphology of the product was a quadrangle, which could be due to the influence of excess organic ligand. Zn2+ was linked with the excess of the organic ligand to form the quadrangular structure. It can be shown from the result in Fig. 8 that the morphology of the Zn-MOFs depends strongly on the ratio of reactants.
 | ||
Fig. 8 SEM micrographs of Zn-MOFs which were prepared in the ionic liquid microemulsion F region marked in Fig. 1. (a) n (BTC)![[thin space (1/6-em)]](https://www.rsc.org/images/entities/char_2009.gif) : :![[thin space (1/6-em)]](https://www.rsc.org/images/entities/char_2009.gif) n (Zn2+) = 1 n (Zn2+) = 1![[thin space (1/6-em)]](https://www.rsc.org/images/entities/char_2009.gif) : :![[thin space (1/6-em)]](https://www.rsc.org/images/entities/char_2009.gif) 2, (b) n (BTC) 2, (b) n (BTC)![[thin space (1/6-em)]](https://www.rsc.org/images/entities/char_2009.gif) : :![[thin space (1/6-em)]](https://www.rsc.org/images/entities/char_2009.gif) n (Zn2+) = 1 n (Zn2+) = 1![[thin space (1/6-em)]](https://www.rsc.org/images/entities/char_2009.gif) : :![[thin space (1/6-em)]](https://www.rsc.org/images/entities/char_2009.gif) 1, and (c) n (BTC) 1, and (c) n (BTC)![[thin space (1/6-em)]](https://www.rsc.org/images/entities/char_2009.gif) : :![[thin space (1/6-em)]](https://www.rsc.org/images/entities/char_2009.gif) n (Zn2+) = 2 n (Zn2+) = 2![[thin space (1/6-em)]](https://www.rsc.org/images/entities/char_2009.gif) : :![[thin space (1/6-em)]](https://www.rsc.org/images/entities/char_2009.gif) 1. 1. | ||
In order to demonstrate the effect of reaction time on the size and morphology of the Zn-MOFs, different reaction times were studied. Fig. 9 shows that the size of the Zn-MOFs was the largest at 24 h and then the length of the Zn-MOFs changed from long to short with the extension of reaction time, which could be due to the effect of excessive stirring causing the long rod structures to break off after 24 h. When the reaction time was up to 24 h, the morphology of the Zn-MOFs prepared in the ionic liquid microemulsions was a long rod with an average size of ∼25 μm (Fig. 9c).
 | ||
| Fig. 9 SEM micrographs of Zn-MOFs which were prepared in the ionic liquid microemulsion F region marked in Fig. 1. (a) T = 6 h, (b) T = 12 h, (c) T = 24 h, (d) T = 36 h, and (e) T = 48 h. | ||
According to the previous literature, the shape of the MOFs depends on the shape of the droplets in the corresponding microemulsions, but the size of the final MOFs was much larger than that of the droplets in the microemulsions. Besides, the dispersed droplets in the [Bmim]PF6-in-water microemulsion are cylindrical, which produce rod-like final MOFs.30 Therefore, the rod-like Zn-MOFs prepared in the microemulsion F region ([Bmim]PF6-in-water) have a good agreement with the previous study. The mechanism for controlling the morphology could be summarized as follows: the Zn2+ dissolves in the water and the organic ligands (BTC) dissolve in the ionic liquid. Zn-MOF nuclei are formed by the coordination reaction of the Zn2+ ions and the protonated BTC ligands at the water/IL (ionic liquid) interface in the droplets of the corresponding microemulsions, and grow gradually. The shape of the droplets in the corresponding microemulsions mainly determines the shape of the final Zn-MOFs.
Conclusions
The study of the controlled morphologies of the Zn-MOFs prepared in ionic liquid microemulsions is very interesting. In this work, we have successfully synthesized metal–organic frameworks which combine a transition metal (Zn2+) and aromatic BTC ligands in ionic liquid microemulsions at room temperature and two different Zn-MOF crystal structures have also been afforded. The influence of different parameters such as the pH value, the ratio of reactants and the reaction time on the morphology and size of the Zn-MOFs was demonstrated. Although, to some extent, the low surface area of the Zn-MOFs synthesized in these ionic liquid microemulsions may restrict their application range, the synthesis of metal–organic frameworks in ionic liquid microemulsions at room temperature is simple and fits the green chemistry idea, and we believe that this method can also be widely applied in synthesizing new materials with various sizes and morphologies.Experimental
Materials
1,3,5-Benzenetricarboxylic acid (BTC) with a purity of >97% was purchased from Accela ChemBio Co., Ltd. Nonionic surfactant Triton X-100 (TX-100, polyoxyethylene (10) isooctylphenyl ether, M.W. = 646, Sinopharm Chemical Reagent Co., Ltd.,) was used without further purification. Zn(NO3)2·6H2O and NaOH were purchased from Sinopharm Chemical Reagent Co., Ltd. Water was purified with a Milli-Q 18.3 MΩ cm−1 water system. All solvents and reagents for the syntheses were used as received from commercial sources without further purification.Synthesis of the ionic liquid [Bmim]PF6
Synthesis of the ionic liquid was performed in a 250 mL round bottom flask using a procedure similar to that previously described.31–34 The ionic liquid 1-butyl-3-methylimidazolinium chloride (30.14 g, 0.172 mol) was added to react with 20% (theoretical) excess of KPF6 (37.98 g, 0.206 mol) in water (150 mL) under continuous stirring at room temperature for 12 h. The organic layer in the reaction mixture was washed with water (3 × 30 mL) after 12 hours and the product was dried under vacuum for 8 hours, the pure ionic liquid ([Bmim]PF6) was obtained and the yield was 32.45 g (0.114 mol, 66.35%). 1H NMR characterization is presented in Fig. S4 in the ESI.† 1H NMR (600 MHz, δ, ppm, DMSO): 2.442 (s), 9.048 (s, H), 7.711–7.714 (d, H), 7.645–7.647 (d, H), 3.801 (s, 3H), 4.102–4.126 (t, 2H), 1.696–1.745 (m, 2H), 1.186–1.223 (q, 2H), 0.848–0.872 (t, 3H).Preparation of the Zn-MOFs
For the experiments, the ionic liquid microemulsions with desired compositions containing water, [Bmim]PF6, and Triton X-100 were prepared using a previously reported method.35 Zn(NO3)2·6H2O (1.0 mmol), NaOH (1.0 mmol) and BTC (1.0 mmol) were added into the ionic liquid microemulsions (20 g). The mixed solution was stirred for 24 hours at room temperature. Then, the product was collected by centrifugation at 4500 rpm and washed with ethanol three times (3 × 20 mL) to remove the surfactant and [Bmim]PF6. Then, the white products were dried in a vacuum oven at 60 °C for 24 hours.Material characterization
Powder X-ray diffraction data from the studied samples were collected on a D8 ADVANCE with Cu Kα radiation (λ = 1.5418 Å). FT-IR spectra were obtained on a Bruker VERTEX70 FT-IR spectrometer using KBr pellets prepared with sample powders, and measured in the wavenumber range 4000–400 cm−1. Morphology analyses for Zn-MOFs were carried out on a NTC JSM-6390LV. Thermogravimetric (TG) analyses was performed in an air atmosphere with a heating rate of 10 °C min−1 from 25 to 600 °C, using a NETZSCH TG209C instrument. The single crystal data were collected using a Bruker SMART X-ray diffractometer, equipped with an APEX-CCD area detector.Conflicts of interest
There are no conflicts to declare.Acknowledgements
This research was financially supported by the Natural Science Foundation of Hubei Province of China (2018CFB166) and the Fundamental Research Funds for the Central Universities (2662017QD029, 2662018JC009).Notes and references
- N. L. Rosi, J. Kim, M. Eddaoudi, B. Chen, M. O’Keeffe and O. M. Yaghi, J. Am. Chem. Soc., 2005, 127, 1504 CrossRef PubMed.
- H. C. Zhou, J. R. Long and O. M. Yaghi, Chem. Rev., 2012, 112, 673 CrossRef PubMed.
- J. R. Li, J. Sculley and H. C. Zhou, Chem. Rev., 2012, 112, 869 CrossRef PubMed.
- S. Q. Ma and H. C. Zhou, Chem. Commun., 2010, 46, 44 RSC.
- X. Huang, Y. Chen, Z. Lin, X. Ren, Y. Song, Z. Xu, X. Dong, X. Li, C. Hu and B. Wang, Chem. Commun., 2014, 50, 2624 RSC.
- T. Zhang and W. Lin, Chem. Soc. Rev., 2014, 43, 5982 RSC.
- E. Haque, J. E. Lee, I. T. Jang, Y. K. Hwang, J. S. Chang, J. Jegal and S. H. Jhung, J. Hazard. Mater., 2010, 181, 535 CrossRef PubMed.
- S. Lin, Z. Song, G. Che, A. Ren, P. Li, C. Liu and J. Zhang, Microporous Mesoporous Mater., 2014, 193, 27 CrossRef.
- Z. Q. Li, A. Wang, C. Y. Guo, W. N. Hu and Y. F. Tai, Chem. J. Chin. Univ., 2013, 34, 2470 Search PubMed.
- P. Horcajada, R. Gref, T. Baati, P. K. Allan, G. Maurin, P. Couvreur, G. Ferey, R. E. Morris and C. Serre, Chem. Rev., 2012, 112, 1232 CrossRef PubMed.
- L. Xie, S. Liu, Z. Han, R. Jiang, H. Liu, F. Zhu, F. Zeng, C. Su and G. Ouyang, Anal. Chim. Acta, 2015, 853, 303 CrossRef PubMed.
- L. E. Kreno, K. Leong, O. K. Farha, M. Allendorf, R. P. Van Duyne and J. T. Hupp, Chem. Rev., 2012, 112, 1105 CrossRef PubMed.
- Y. Fu, G. Li, F. Liao, M. Xiong and J. Lin, J. Mol. Struct., 2011, 1004, 252 CrossRef.
- I. A. Ibarra, P. A. Bayliss, E. Perez, S. Yang, A. J. Blake, H. Nowell, D. R. Allan, M. Poliakoff and M. Schroder, Green Chem., 2012, 14, 117 RSC.
- F. Alosfur, M. Jumali, S. Radiman, N. Ridha, M. Yarmo and A. Umar, Nanoscale Res. Lett., 2013, 8, 1 CrossRef PubMed.
- Z. Q. Li, L. G. Qiu, T. Xu, Y. Wu, W. Wang, Z. Y. Wu and X. Jiang, Mater. Lett., 2009, 63, 78 CrossRef.
- D. Denysenko, M. Grzywa, M. Tonigold, B. Streppel, I. Krkljus, M. Hirscher, E. Mugnaioli, U. Kolb, J. Hanss and D. Volkmer, Chem.–Eur. J., 2011, 17, 1837 CrossRef PubMed.
- I. Danielsson and B. Lindman, The definition of microemulsion, Colloids Surf., A, 1981, 3, 391 CrossRef.
- L. E. Scriven, Equilibrium bicontinuous structure, Nature, 1976, 263, 123 CrossRef.
- M. P. Pileni, Nat. Mater., 2003, 2, 145 CrossRef PubMed.
- R. Zhang, J. Liu, J. He, B. Han, T. Jiang, D. Shen, J. Huang and H. Gao, Chem.–Eur. J., 2003, 9, 2167 CrossRef PubMed.
- R. P. Bagwe, C. Yang, L. R. Hilliard and W. Tan, Langmuir, 2004, 20, 8336 CrossRef PubMed.
- L. Zhang, Y. Wang, L. Tong and Y. Xia, Nano Lett., 2014, 14, 4189 CrossRef PubMed.
- X. Kang, X. Sun, X. Ma, P. Zhang, Z. Zhang, Q. Meng and B. Han, Angew. Chem., Int. Ed., 2017, 56, 12683 CrossRef PubMed.
- X. Kang, X. Sun and B. Han, Adv. Mater., 2016, 28, 1011 CrossRef PubMed.
- C. Fu, H. Zhou, D. Xie, L. Sun, Y. Yin, J. Chen and Y. Kuang, Colloid Polym. Sci., 2010, 288, 1097 CrossRef.
- M. Zhao, L. Zheng, X. Bai, N. Li and L. Yu, Colloids Surf., A, 2009, 346, 229 CrossRef.
- M. Harada, Y. Kimura, K. Saijo, T. Ogawa and S. Isoda, J. Colloid Interface Sci., 2009, 339, 373 CrossRef PubMed.
- G. Zhang, H. Zhou, J. Hu, M. Liu and Y. Kuang, Green Chem., 2009, 11, 1428 RSC.
- W. T. Shang, X. C. Kang, H. Ning, J. L. Zhang, X. G. Zhang, Z. H. Wu, G. Mo, X. Q. Xing and B. X. Han, Langmuir, 2013, 29, 13168 CrossRef PubMed.
- I. A. Shkrob, T. W. Marin, H. M. Luo and S. Dai, J. Phys. Chem. B, 2013, 117, 14372 CrossRef PubMed.
- G. A. G. Porras, J. Zeitouny, A. Gomila, B. Douziech, N. Cosquer, F. Conan, O. Reinaud, P. Hapiot, Y. L. Mest, C. Lagrost and N. L. Poul, Dalton Trans., 2014, 43, 6436 RSC.
- J. P. Chen and X. S. Zhu, Spectrochim. Acta, Part A, 2015, 137, 456 CrossRef PubMed.
- T. Endo, H. Masu, K. Fujii, T. Morita, H. Seki, S. Sen and K. Nishikawa, Cryst. Growth Des., 2013, 13, 5383 CrossRef.
- Y. N. Gao, B. S. Han, B. X. Han, G. Z. Li, D. Shen, Z. H. Li, J. M. Du, W. G. Hou and G. Y. Zhang, Langmuir, 2005, 21, 5681 CrossRef PubMed.
Footnote |
| † Electronic supplementary information (ESI) available: Characterization of the ionic liquid ([Bmim]PF6) (1H NMR) and the Zn-MOFs prepared at RT in the ionic liquid microemulsions from BTC, Zn(NO3)2·6H2O and NaOH (FT-IR, TGA and N2 isotherms). CCDC 1055450. For ESI and crystallographic data in CIF or other electronic format see DOI: 10.1039/c8ra04573a |
| This journal is © The Royal Society of Chemistry 2018 |

