 Open Access Article
Bio-sourced phosphoprotein-based synthesis of silver-doped macroporous zinc phosphates and their antibacterial properties†
Jessica Viviana Hinostroza Ramosab,
Karine Anselmeab,
Angélique Simon-Masseron*ab and
Lydie Plouxab
aUniversité de Haute-Alsace, CNRS, IS2M UMR 7361, F-68100 Mulhouse, France. E-mail: angelique.simon-masseron@uha.fr
bUniversité de Strasbourg, France
First published on 12th July 2018
Abstract
The usual sources of phosphorus for metal phosphates are obtained from phosphate rocks, of which resources are depleted. As a substitute for these mineral sources, an original method of synthesis has been developed to prepare macroporous zinc phosphates using casein phosphoprotein. This bio-sourced reactant plays during the synthesis the roles of both a phosphorus source and a reducing agent for silver nanoparticles. Thus, zinc phosphates loaded with different Ag contents (up to 6.4 wt%) are prepared via hydrothermal treatment at 100 °C. Silver nanoparticles co-crystallized with hopeite, Zn3(PO4)2 and/or Zn2P2O7. In addition, casein induces porosity within the zinc phosphate framework and provides macropores (diameter of >50 nm) during calcination. The antibacterial properties against Escherichia coli K12 bacteria of Ag-containing and Ag-free porous zinc phosphates (calcined at 750 °C) were also tested for the first time.
1. Introduction
Metal phosphates have received much attention because of their versatile applications, mainly as catalysts, molecular sieves, optical materials and anticorrosive pigments.1–3 Among these materials, zinc phosphates (amorphous phases, hopeite) have also been shown to be interesting materials in dentistry applications as luting cements owing to their strong adhesion, biocompatibility and low solubility in aqueous and biological environments.4,5 In this context, the antibacterial properties of freshly prepared zinc phosphate cements have been demonstrated against Streptococcus mutans bacteria.6–9 These were attributed to the release of zinc and were greatly reduced after the cement hardened.10–12 Moreover, materials based on zinc–calcium phosphates have been shown to promote bone regeneration in medical applications thanks to the essential function of zinc in bone tissue development.6,7,13 However, to the best of our knowledge, no study of environmental applications of porous zinc phosphates has been reported, yet zinc is an element with low toxicity to humans and the environment in comparison with other metals found in metal phosphates.11 They also have interesting properties for corrosion prevention.12–14 Both features are assets for use in the fields of biomedicine and water treatment.Phosphorus sources for the synthesis of these materials are derived from phosphate rock resources, principally sedimentary marine phosphorites.15 Approximately 82% of these phosphate rocks are exploited for the preparation of fertilizer, a few per cent for animal feed, and the rest for industrial purposes.16,17 Because of the importance of phosphorus and the constant demand for it, the level of exploitation of phosphate rocks would reach a peak in 2033 and 2034.17 Total resource exhaustion at the current rate of world consumption is expected to occur in a few hundred years.15,17 Orthophosphoric acid is the main product of the treatment of phosphate rocks. It is also the main phosphorus source used for the synthesis of metal phosphates.18 Hence, the depletion of stocks of phosphate rocks will have a direct impact on the supply of metal phosphates. Therefore, the development of bio-sourced syntheses of metal phosphates is particularly relevant.
The development of silver-supported solids, including metal phosphates, is of constant interest for biomedical and environmental applications owing to the antimicrobial activity of Ag+ ions against different Gram-positive and Gram-negative strains of bacteria.8,9,19 The bactericidal activity of Ag+ ions is attributed to a combination of different biocidal actions that lead to the death of bacteria, which include degradation of the bacterial cell wall by the interaction of Ag+ ions with the membrane and inactivation of protein synthesis and DNA replication.8,9,20,21 For this purpose, the incorporation of Ag nanoparticles into materials is an efficient method of providing antibacterial properties in an aqueous medium by allowing the release of Ag+ ions from oxidized Ag nanoparticles. When applied to porous zinc phosphates, doping with Ag nanoparticles may significantly improve the antibacterial properties of the final material. In addition, porosity may bring added value by enhancing the retention of bacteria for their further degradation.
Furthermore, the use of inorganic matrices as supports for Ag nanoparticles has attracted interest because of their advantages in terms of stability, heat resistance and safety in comparison with organic compounds. Studies have shown that inorganic structures such as zeolites, zinc oxide, titanium dioxide, phosphates, ceramics and glass are suitable carriers for the release of Ag+ ions.22–25 In this context, several studies of the synthesis of metal phosphate materials loaded with Ag nanoparticles, which mainly focused on hydroxyapatite (calcium phosphate), have been reported. The incorporation of Ag nanoparticles into hydroxyapatite coatings has shown good results in the prevention of implant-associated bacterial infections, which is attractive in medical applications owing to the biocompatible properties of hydroxyapatite.26–28 Environmental applications of hydroxyapatite have also been reported. An example is the development of a filter material composed of porous hydroxyapatite loaded with Ag nanoparticles29 as a substitute for the typical zeolite/Ag, sand/Ag, fiberglass/Ag and resin/Ag filters used in water disinfection.30–33
Porosity in metal phosphate materials is usually generated by organic molecules such as quaternary ammonium compounds or amines, of which the supply depends on oil resources. They are usually highly toxic and environmentally unfriendly. The use of new templates obtained from new raw materials represents one of the major challenges in the synthesis of porous solids. Few studies of the synthesis of bio-sourced porous and nonporous metal phosphates are available in the literature, except for the synthesis of calcium phosphate.34–36 Bio-sourced zinc phosphates were reported for the first time in a recent work published by our group.37 The present paper describes the first synthesis of bio-sourced porous zinc phosphates loaded with Ag nanoparticles with a study of their antibacterial properties. Casein phosphoprotein (CN) from bovine milk is used. It is composed of four principal types of caseins (i.e., αs1-, αs2-, β- and κ-casein), in which phosphorus is present as colloidal calcium phosphate (CCP) (inorganic phosphorus) and phosphoserine residues (SerP) (organic phosphorus). These are in the form of dispersed spherical colloidal particles known as micelles (diameter: 50–500 nm, average: 150 nm).38 Casein plays the role of a phosphorus source, generates porosity and permits the in situ synthesis of Ag nanoparticles without the use of any additional reducing agents such as commonly used hydrazine and sodium borohydride.39,40 We especially studied the influence of the calcination conditions on the composition of crystalline zinc phosphate phases (ZnPOs) prepared by this method, the sizes of Ag nanoparticles and textural properties. The solids were characterized by X-ray diffraction, scanning electron microscopy, transmission electron microscopy, energy-dispersive X-ray spectroscopy, thermal analysis, nitrogen adsorption and inductively coupled plasma atomic emission spectroscopy.
The antibacterial properties of zinc phosphates loaded or not loaded with Ag nanoparticles were investigated. A strain of Escherichia coli (E. coli) K12 was chosen as a model microorganism owing to its common use as an indicator of microbial water contamination.41 E. coli is also frequently involved in common bacterial infections related to water such as traveler's diarrhea.42 Short-term colonization and proliferation on zinc phosphate surfaces were analyzed using confocal fluorescence microscopy. These were related to the concentrations of Ag+ and Zn2+ ions released from samples of the material, which were determined by inductively coupled plasma atomic emission spectroscopy.
2. Experimental section
2.1. Preparation of zinc phosphates
A casein dispersion was prepared by adding 9.50 g (0.71 wt% of P) of casein powder from bovine milk (Sigma-Aldrich, technical grade) to 190 mL of a 3.0 mmol L−1 aqueous solution of sodium hydroxide (pH 11.5) (NaOH pellets, Sigma-Aldrich, ≥97%) under magnetic stirring for 30 min. A 0.12 mol L−1 aqueous solution of silver nitrate (AgNO3, Sigma-Aldrich, ≥99%) was then added to the casein dispersion under stirring for 20 min at room temperature. Then, 32 mL of a 0.35 mol L−1 aqueous solution of zinc nitrate (Zn(NO3)2·6H2O, Alfa Aesar, ≥99%) was added to the prepared casein/silver ion dispersion, and finally the entire reaction mixture was maintained under magnetic stirring for 20 min at room temperature. The resulting solution was transferred to a 500 mL polypropylene flask and stored at 100 °C. After heating for 6 days, the product was filtered off, washed with distilled water and dried at 70 °C overnight. All chemicals and reagents were used as received without further purification.2.2. Characterization of antibacterial properties induced by the release of silver
![[thin space (1/6-em)]](https://www.rsc.org/images/entities/char_2009.gif) 000 rpm, and the pellet was re-suspended in 4 mL of fresh M63G medium. The absorbance of a bacterial suspension containing about 5 × 10⁶ bacteria per mL measured at 600 nm (Abs600 nm) was adjusted to 0.05. This final bacterial suspension was used to perform bacterial colonization experiments on the zinc phosphate materials.
000 rpm, and the pellet was re-suspended in 4 mL of fresh M63G medium. The absorbance of a bacterial suspension containing about 5 × 10⁶ bacteria per mL measured at 600 nm (Abs600 nm) was adjusted to 0.05. This final bacterial suspension was used to perform bacterial colonization experiments on the zinc phosphate materials.Colonization by bacteria of the material samples was analyzed in situ in the last rinsing medium under a confocal laser scanning microscope (Carl Zeiss LSM700) equipped with a 63× water immersion objective (working distance of 2.4 mm).48 Fluorescence and reflection images were taken at the same time at 6 different locations on each material sample. Excitation sources at 488 nm and 405 nm, respectively, and a 490–555 nm bandpass emission filter were used for fluorescence data capture. At each location, stacks of 2D x,y images (at intervals of 1 μm in the z-direction) were acquired. In each experiment, one sample of each type of material was used. The experiment was repeated 6 times.
3. Results and discussion
3.1. Preparation and characterization of zinc phosphates loaded with Ag nanoparticles
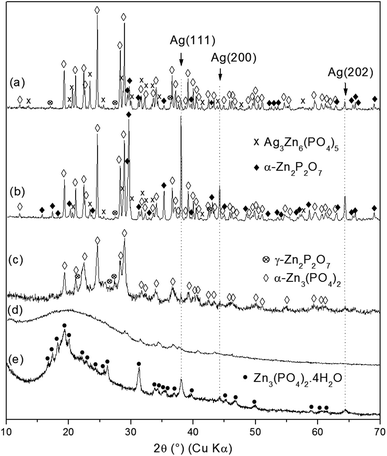
As-synthesized zinc phosphates named as ZnPO/CN/Ag (ZnPO = zinc phosphate, CN = casein, Ag = silver) and ZnPO/CN (reference) were prepared via the same procedure, and the molar compositions of the starting mixtures are reported in Table 1.Fig. 1 shows the XRD patterns of as-synthesized ZnPO/CN/Ag and ZnPO/CN. Two compounds were identified in each sample: (i) a major amorphous phase characterized by two broad peaks centered at 9° and 19° (2θ), which are ascribed to amorphous casein (Fig. 1c), and (ii) a crystalline zinc phosphate phase identified as hopeite (Zn3(PO4)2·4H2O, PDF 00-037-0465). The ZnPO/CN/Ag sample contained an additional Ag phase characterized by three peaks observed at 38.1°, 44.2° and 64.4° (2θ) (Fig. 1a), which correspond to the (111), (200) and (220) diffraction planes of face-centered cubic (fcc) silver, respectively (PDF 00-004-0783). No diffraction peaks of silver oxide or other impurities were detected. The XRD results reveal that the crystallization of Ag was not hampered by the co-crystallization of hopeite. Using the XRD Scherrer method, an average Ag crystal size of 27 nm was determined.
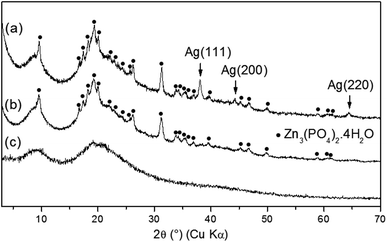 | ||
| Fig. 1 XRD patterns of as-synthesized products obtained by a hydrothermal procedure at 100 °C for 6 days: (a) ZnPO/CN/Ag, (b) ZnPO/CN and (c) casein powder. | ||
TEM images and the particle size distribution of the ZnPO/CN/Ag sample are shown in Fig. 2. The TEM observations reveal the presence of spherical Ag nanoparticles that are fairly well distributed in the solid. Their size distribution has an average value of 26.6 ± 10.4 nm, with some aggregates with sizes ranging from 40 nm to 60 nm. These results are in agreement with the value obtained by the Scherrer method.
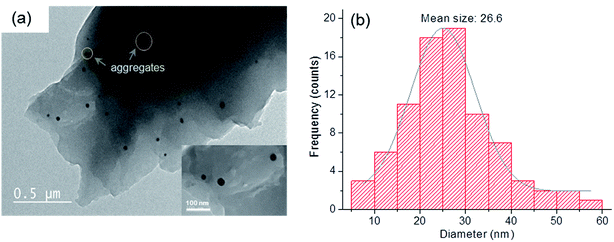 | ||
| Fig. 2 (a) TEM image of as-synthesized ZnPO/CN/Ag (inset: magnified image of Ag nanoparticles) and (b) particle size distribution of Ag in the sample. | ||
The formation of Ag nanoparticles was initially a result of the incorporation of the silver nitrate solution to disperse casein micelles in the acidic medium (pH ∼5). This involved the formation of casein–Ag+ ion complexes thanks to electrostatic interactions between Ag+ ions and functional groups of amino acids present in casein molecules such as amine (–NH2), thiol (–SH) and carboxyl (–COOH) groups.39,40 At this stage, no evident difference in color was observed between the casein/Ag+ ions dispersion and the casein dispersion (reference), which suggested that Ag particles were not immediately formed, at least at room temperature. The concentration of NaOH (i.e., 3.0 mmol L−1) may have been too low to promote the reducing capacity of casein protein, which led to incomplete reduction of Ag ions.40 The final incorporation of the zinc nitrate solution in the casein/Ag+ ions dispersion, which led to a pH of 4.2, caused the solubilization of colloidal calcium phosphate (CCP) (inorganic phosphorus) present in casein molecules.52 Released phosphate ions reacted with Zn2+ ions, which resulted in the formation of hopeite. Moreover, the dark brown color of the product obtained via synthesis at 100 °C suggests the formation of Ag particles in the solid in contrast to the brown product obtained without silver (reference sample). This suggests that previously formed casein–Ag+ ion complexes reacted in situ to provide Ag particles, which were probably stabilized by casein as previously observed by Ashraf et al.39
3.2. Calcination conditions
As-synthesized ZnPO/CN/Ag samples were calcined at different temperatures ranging from 250 °C to 750 °C to investigate thermal influences on the crystallization process (Fig. 3, Table 2). The XRD results for the sample heated at 250 °C show a broad band centered at about 20° (2θ) (casein) and a few small unidentified peaks (Fig. 3d). This indicates the transformation of hopeite via thermal treatment. The absence of a signal for crystalline silver suggests possible thermal instability of the Ag nanoparticles in the presence of casein associated with the low sensitivity of the diffractometer used for the calcined samples. The amorphous solid recrystallized at 500 °C (Fig. 3c), mainly into zinc orthophosphate (α-Zn3(PO4)2) (PDF 00-029-1390). At higher calcination temperatures ranging from 600 °C to 750 °C (Fig. 3a and b), crystallization of α-Zn2P2O7 (PDF 00-008-038) occurred, which was probably induced by phosphate groups of phosphoserine residues released during the combustion of casein. In addition, better crystallization of Ag0 was observed at 600 °C, as indicated by the sharpening and higher intensity of the Ag peaks at 38.1°, 44.2° and 64.4° (2θ). Another compound, which was probably silver zinc orthophosphate of the Ag3Zn6(PO4)5 type (PDF 00-038-0302), crystallized at and above 600 °C. This may result from either Ag nanoparticles that were oxidized by PO43− species present in the sample,53,54 as indicated by the decrease in the intensity of Ag peaks at 750 °C, or silver atoms not involved in the crystallization of Ag0 at temperatures of less than 600 °C that participated in the crystallization of this new compound. Furthermore, in the absence of Ag in the starting mixture, the same zinc phosphate phases crystallized (i.e., α-Zn3(PO4)2 and γ- and α-Zn2P2O7, hopeite).37| Sample | Temperature (°C) | Result (XRD) |
|---|---|---|
| a Major phase.b Zn3(PO4)2·4H2O.c a.p.: amorphous phase. RT: room temperature (sample before calcination). nid: not identified. | ||
| ZnPO/CN/Ag | RT | Caseina + hopeiteb + Ag |
| ZnPOs/Ag-250 | 250 | a.p.c + nid (traces) |
| ZnPOs/Ag-500 | 500 | α-Zn3(PO4)2a + γ-Zn2P2O7 (traces) + a.p.c, Ag (traces) |
| ZnPOs/Ag-600 | 600 | Ag + α-Zn3(PO4)2 + α-Zn2P2O7 + γ-Zn2P2O7 (traces) + Ag3Zn6(PO4)5 (traces) |
| ZnPOs/Ag-750 | 750 | α-Zn3(PO4)2a + α-Zn2P2O7 + Ag + γ-Zn2P2O7 (traces) + Ag3Zn6(PO4)5 |
According to chemical analyses (Table 3), the weight percentages of Ag, Zn and P in ZnPO/CN/Ag were lower than those in ZnPOs/Ag-750, as was expected owing to the predominance of casein in the sample before calcination. Because calcium cations were undetectable in the as-synthesized samples but measurable in casein (i.e., 0.15 wt%), colloidal calcium may have been almost completely solubilized and Ca2+ ions eliminated in the filtrate of the as-synthesized sample, while phosphate ions may have been used for the synthesis of hopeite. The presence of calcium in the calcined samples suggests that (i) Ca2+ ions present in the as-synthesized samples were involved in electrostatic interactions with phosphate groups of phosphoserine and (ii) Ca2+ ions compensated for some negative charges that formed in the sample calcined at 750 °C.
| Sample | Ag (%) | Ca (%) | P (%) | Zn (%) |
|---|---|---|---|---|
| ZnPO/CN | — | <0.003 | 0.84 (±0.03) | 2.41 (±0.06) |
| ZnPO/CN/Ag | 0.57 ± 0.01 | <0.003 | 1.04 (±0.41) | 3.09 (±0.06) |
| ZnPOs-750 | — | 0.063 (±0.002) | 15.60 (±0.54) | 45.64 (±1.40) |
| ZnPOs/Ag-750 | 6.39 ± 0.26 | 0.105 (±0.003) | 14.07 (±0.48) | 46.75 (±1.89) |
| Casein | — | 0.145 (±0.004) | 0.77 (±0.03) | — |
Simultaneous TG and DT analyses were performed on the as-synthesized ZnPO/CN/Ag and ZnPO/CN samples. As was expected because of the large amount of casein in the samples, the TGA and DTA curves shown in Fig. 4 have similar profiles to those of casein. The first loss of weight in the TGA curves between room temperature and 200 °C is related to physisorbed water. It is associated with the small endothermic peak centered at about 100 °C in the DTA curves. Three main weight losses that are ascribed to the decomposition of casein are observed between 200 °C and 780 °C, which are associated with the broad exothermic band with a maximum at about 520 °C. The higher values of exothermic enthalpy observed for ZnPO/CN/Ag in comparison with the ZnPO/CN sample suggest that the presence of Ag nanoparticles protected by casein led to an increase in the energy required for the decomposition of casein. The weight losses determined from the TGA curves of the as-synthesized ZnPO/CN/Ag and ZnPO/CN samples are summarized in Table 4. They indicate that the samples had similar contents of casein.
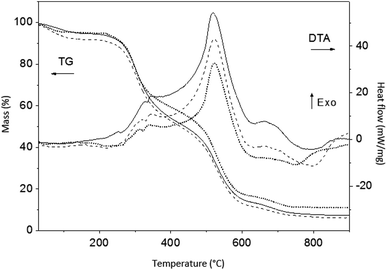 | ||
| Fig. 4 TGA and DTA results obtained under air for ZnPO/CN/Ag (black curves), ZnPO/CN (dashed black curves) and casein powder (dotted black curves). | ||
| Sample | Up to 200 °C (wt%) | From 200 °C to 780 °C (wt%) |
|---|---|---|
| ZnPO/CN/Ag | 5.7 | 86.4 |
| ZnPO/CN | 8.5 | 84.6 |
Furthermore, the influence of the calcination temperature on the particle size of silver nanoparticles was investigated by TEM (Fig. 5). Elemental mapping of Ag showed highlighted silver nanoparticles and aggregates (larger pink spots). The nanoparticle size was 9.9 ± 2.7 nm, 25.4 ± 7.5 nm and 6.4 ± 3.0 nm for the samples calcined at 500, 600 and 750 °C, respectively. The formation of aggregates of Ag nanoparticles with sizes of around 80 nm was most prominent at 600 and 750 °C. Such large aggregates were not observed in the as-synthesized sample, in which casein stabilized silver nanoparticles and prevented them from approaching each other. In contrast, they may have formed after the combustion of casein, which led to the decomposition of casein and, therefore, possible close contact between nanoparticles.
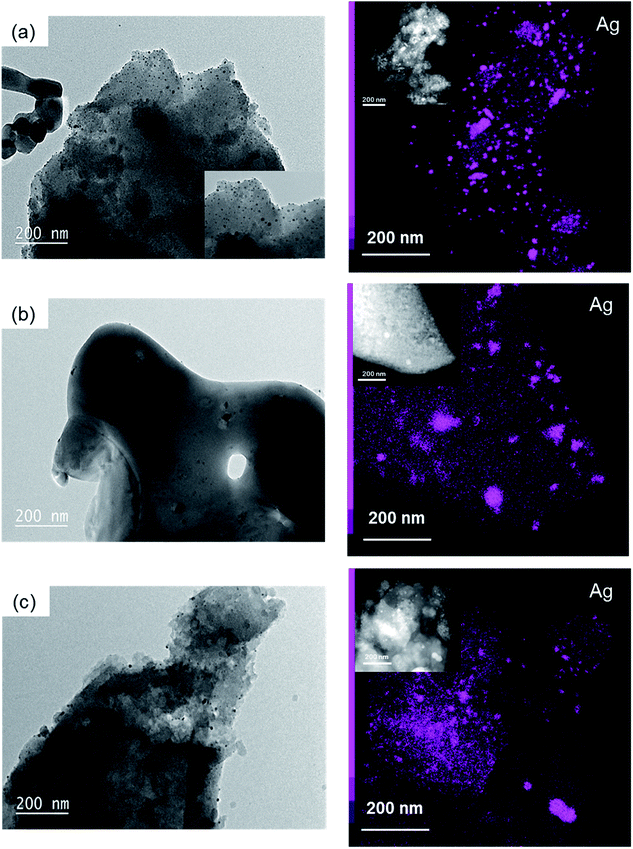 | ||
| Fig. 5 TEM images and corresponding elemental mapping images of Ag (right) of: (a) ZnPOs/Ag-750, (b) ZnPOs/Ag-600 and (c) ZnPOs/Ag-500. | ||
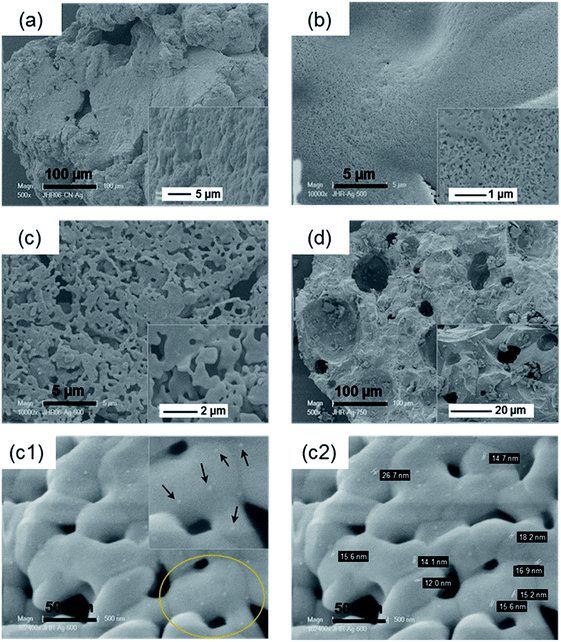
SEM analyses of the as-synthesized ZnPO/CN/Ag and ZnPOs/Ag-500, -600 and -750 samples, as shown in Fig. 6, show that the surfaces of the as-synthesized samples were composed of large irregular particles with undefined shapes and rough surfaces. At 500 °C, pores were formed (diameter: 0.05–0.2 μm). Macroporosity increased at 600 °C with a heterogeneous pore size distribution (i.e., a range of 0.10–1.70 μm) and an ill-defined pore shape. This macroporosity disappeared at 750 °C while larger quasi-spherical pores with a heterogeneous pore diameter (17 μm to 100 μm) were formed (Fig. 6d). In the case of the sample calcined at 600 °C, silver nanoparticles and aggregates are seen in the SEM images as white particles (Fig. 6c1 and c2).
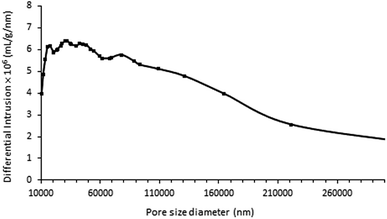
In addition, nitrogen adsorption measurements revealed that the calcined samples had very small specific surface areas (SBET < 3 m2 g−1) and did not contain any micro- or mesopores. Complementary analyses performed by Hg porosimetry on the ZnPOs/Ag-750 sample revealed a broad pore size distribution (10 to 200 μm) with an average diameter of 70 μm (Fig. 7). This is mainly attributed to the intra-particle porosity visible in SEM images. The foamy aspect of the material observed after calcination was preserved during the porosity experiments; this proves that the porosity was stable up to a pressure of 200 MPa. The Hg cumulative pore volume was 1.28 cm3 g−1.
3.3. Antibacterial activity of zinc phosphates
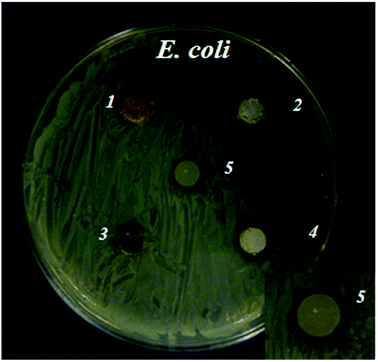
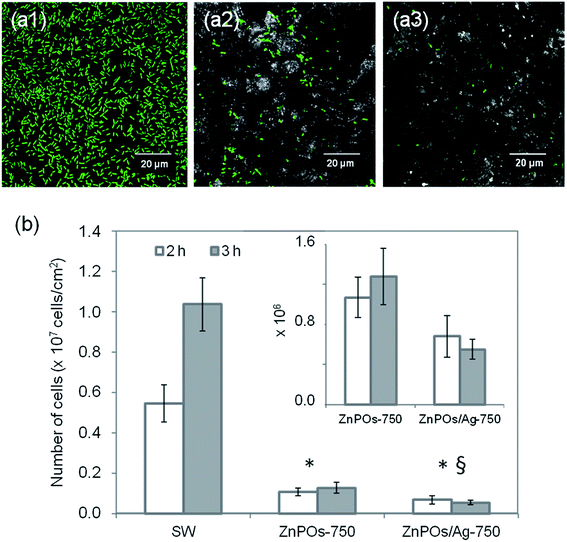
Bacterial growth in close proximity to the zinc phosphate materials was investigated by depositing samples onto agar nutrient plates inoculated with a bacterial suspension, which allowed diffusion of compounds from the material. Zones of bacterial growth inhibition were more clearly defined around the ZnPOs/Ag-750 sample (0.79 ± 0.23 cm2) in comparison with the other samples (Fig. 8). This is ascribed to the antibacterial activity of Ag+ ions that were released by the oxidation of Ag nanoparticles present in the material in contact with the liquid8,9,55 and diffused through the agar gel. In contrast, an inhibition zone was not observed for the ZnPO/CN/Ag samples, which was probably due to the lower silver content (Table 3 and ESI,† Table 1). In addition, the results indicate that the Ag-free ZnPO/CN and ZnPOs-750 samples did not release a sufficient quantity of any substance able to inhibit the growth of E. coli, such as zinc or casein. Pure casein powder, which was used as a positive control, was shown to provide a weak antibacterial effect (0.25 ± 0.16 cm2) after overnight incubation (Fig. 8), as already reported in the literature.56Bacterial colonization on the ZnPOs-750 and ZnPOs/Ag-750 materials was investigated using the E. coli K12 SCC1 strain (see ESI† for ZnPO/CN and ZnPO/CN/Ag). Fig. 9a(1–3) shows typical examples of micrographs acquired by confocal fluorescence microscopy after incubation for 3 h. Bacteria were uniformly distributed on all material surfaces and were preferentially located in surface cavities of the ZnPOs-750 and ZnPOs/Ag-750 materials, which were probably formed from macropores (pore diameter between 350 and 1000 nm).37 A quantitative view of colonization after incubation for 2 h and 3 h is given in Fig. 9b, which reveals that the number of bacteria was significantly lower on zinc phosphate surfaces in comparison with the SW control and thus shows that the zinc phosphate surfaces were unfavorable for bacterial colonization.
The capacity of zinc phosphates to affect bacterial proliferation was also investigated on the basis of a comparison between zinc phosphates in terms of colonization after the materials were exposed to bacteria for 2 h and 3 h (see ESI† for ZnPO/CN and ZnPO/CN/Ag). As shown in Fig. 9b, the number of adherent bacteria on the ZnPOs-750 material significantly increased between incubation durations of 2 h and 3 h (about +20%) (Table 5), as was expected owing to the normal growth of bacterial populations on surfaces. Nevertheless, it was significantly less than that measured on the SW control (about +87%), which is attributed to the action of ions such as Zn2+ that were released from the zinc phosphate materials (Table 5) and are known to exhibit inhibitory effects on bacteria.57,58
| Sample | % bacterial proliferation (2 h to 3 h) | [Ag+] M | [Zn2+] M |
|---|---|---|---|
| SW | +87 | — | — |
| ZnPOs-750 | +20 | — | (6.2 ± 0.1) × 10−5 |
| ZnPOs/Ag-750 | −19 | (10.0 ± 0.2) × 10−6 | (7.5 ± 0.1) × 10−5 |
Regarding potential antibacterial activity related to the Ag content of the materials, the results revealed a significant reduction in the bacterial population on an Ag-based (ZnPOs/Ag-750) in comparison with an Ag-free (ZnPOs-750) material after incubation for 2 h (Fig. 9b). A significant reduction in the number of adherent bacteria was also observed on ZnPOs/Ag-750 between incubation durations of 2 h and 3 h (∼−19%, Fig. 9b and Table 5). These results are consistent with the antibacterial activity expected for the amount of Ag+ measured after release in the M63G culture medium (10−5 M, Table 5), i.e., large enough to induce the death of E. coli bacteria and a subsequent reduction in the bacterial population (minimum inhibitory concentration of 0.6 × 10⁻⁶ M, 0.4–2.0 × 10⁻⁶ M for Ag+, i.e., AgNO3).9,59–61 However, bacterial staining by PI used as a marker of damaged E. coli K12 bacteria showed that bacteria that adhered to the ZnPOs/Ag-750 material displayed an intact membrane after incubation for 3 h, which indicates that the antibacterial activity was lower than that expected for such a released quantity of Ag+ ions (10−5 M). This is ascribed to the specific culture conditions in comparison with studies reported in the literature. In particular, the bacterial strain, culture medium and temperature are parameters known to affect bacterial sensitivity to antibacterial agents.62,63 Thus, reported studies64,65 and results obtained by our group using M63G culture medium66 have shown that the interactions of Ag+ ions with compounds in different media reduce the amount of Ag+ available for antibacterial action. Despite these interactions, however, the results reported here demonstrate that Ag+ ions were released from the ZnPOs/Ag-750 material in sufficient amounts to affect both bacterial colonization and proliferation and therefore to endow it with antibacterial properties.
4. Conclusion
In this study, bio-sourced macroporous zinc phosphates with Ag nanoparticles (ZnPOs/Ag) were successfully obtained via an original method of synthesis. This new route for the synthesis of silver-based metal phosphates is advantageous because casein (CN) acts as a bio-source of phosphorus, a stabilizer and a reducing agent for the synthesis of Ag nanoparticles. It also induces intra-particle macroporosity. During calcination of the as-synthesized compounds (ZnPO/CN/Ag), the crystallization of Ag-supported zinc phosphates was improved up to 600 °C. A study of the antibacterial activity of Ag-containing and Ag-free zinc phosphates against E. coli K12 bacteria demonstrated that porous zinc phosphates inhibited bacterial adhesion over a short incubation period. The antibacterial activity of ZnPOs/Ag-750, which was related to the release of Ag+ ions from the material, indicated significant bactericidal properties and even led to reductions in populations of already adhered E. coli K12. Growth-inhibiting and bactericidal effects were also observed against bacteria present in the environment of the ZnPOs/Ag-750 material. To the best of our knowledge, antibacterial activity of zinc phosphates against E. coli is reported here for the first time. These materials could be used, for example, in the treatment of cooling water, heating systems and wastewater.On the other hand, this work confirms the feasibility of the synthesis of (porous) metal phosphates without the use of reactants derived from phosphate rocks. In addition, such a method of synthesis could be extended to the synthesis of other metal-doped phosphates.
Conflicts of interest
There are no conflicts to declare.Acknowledgements
We thank Habiba Nouali for her assistance with mercury intrusion porosimetry.References
- Z. L. Ning, W. J. Li, C. Y. Sun, P. Che and Z. D. Chang, Trans. Nonferrous Met. Soc. China, 2013, 23, 718–724 CrossRef.
- J. Gu, B. Yang and J. Optoelectron, Adv. Mater., 2008, 2, 405–409 Search PubMed.
- M. J. Gimeno, M. Puic, S. Chamorro, J. Molina, R. March, E. Oró, P. Pérez, J. J. Gracenea and J. J. Suay, Prog. Org. Coat., 2016, 95, 46–53 CrossRef.
- L. Herschke, I. Lieberwith and G. Wegner, J. Mater. Sci.: Mater. Med., 2006, 17, 95–104 CrossRef PubMed.
- L. Herschke, J. Rottstegge, I. Lieberwith and G. Wegner, J. Mater. Sci.: Mater. Med., 2006, 17, 81–94 CrossRef PubMed.
- M. Otsuka, S. Marunaka, Y. Matsuda, A. Ito, P. Layrolle, H. Naito and N. J. Ichinose, J. Biomed. Mater. Res., 2000, 52, 819–824 CrossRef PubMed.
- Y. Sogo, T. Sakurai, K. Onuma and A. Ito, J. Biomed. Mater. Res., 2002, 62, 457–463 CrossRef PubMed.
- G. Franci, A. Falanga, S. Galdiero, L. Palomba, M. Rai, G. Morelli and M. Galdiero, Molecules, 2015, 20, 8856–8874 CrossRef PubMed.
- C. Greulich, D. Braun, A. Peetsch, J. Diendorf, B. Siebers, M. Epple and M. Köller, RSC Adv., 2012, 2, 6981–6987 RSC.
- P. Daugela, R. Oziunas and G. Zekonis, Stomatologija, 2008, 10, 16–21 Search PubMed.
- R. P. Vokus, G. J. Cisneros and M. Levi, Pediatr. Dent. J., 1998, 20, 43–48 Search PubMed.
- E. V. Dastjerdie, M. Oskoui, E. Sayanjali and F. S. Tabatabaei, Iran. J. Pharm. Res., 2012, 11, 77–82 Search PubMed.
- J. Chou, J. Hao, S. Kuroda, D. Bishop, B. Ben-Nissan, B. Milthorpe and M. Otsuka, Foraminifera Carbonate Macrospheres, Mar. Drugs, 2013, 11, 5148–5158 CrossRef PubMed.
- X. Liu, Y. Shao, M. Liu, S. Chen, F. Wang and L. Wang, RSC Adv., 2016, 6, 46479–46486 RSC.
- Phosphate Rock, U.S. Geological Survey, Mineral Commodity Summaries, January 2016, pp. 124−125 Search PubMed.
- J. D. Edixhoven, J. Gupta and H. H. G. Savenije, Earth Syst. Dynam., 2014, 5, 491–507 CrossRef.
- S. J. V. Kauwenbergh, World Phosphate Rock Reserves and Resources, International Center for Soil Fertility and Agricultural Development, 2010, vol. 75, p. 58 Search PubMed.
- J. Patarin, J. L. Paillaud and H. Kessler, in Handbook of Porous Solids, ed. F. Schüth, K. S. W. Sing and J. Weitkamp, Wiley-VCH Verlag GmbH, Germany, 2002, vol. 2, pp. 815–876 Search PubMed.
- S. Y. Liau, S. D. C. Read, W. J. Pugh, J. R. Furr and A. D. Russell, Lett. Appl. Microbiol., 1997, 25, 279–283 CrossRef PubMed.
- J. R. Morones, J. L. Elechiguerra, A. Camacho, K. Holt, J. B. Kouri, J. T. Ramirez and M. J. Jacaman, Nanotechnology, 2005, 16, 2346–2353 CrossRef PubMed.
- N. Durán, M. Durán, M. B. de Jesus, A. B. Seabra, W. J. Fávaro and G. Nakazato, Nanomedicine, 2016, 12, 789–799 CrossRef PubMed.
- D. Jiraroj and S. Tungasmita, Powder Technol., 2014, 264, 418–422 CrossRef.
- Y. Lv, H. Liu, Z. Wang, S. Liu, L. Hao, Y. Sang, D. Liu, J. Wang and R. I. Boughton, J. Membr. Sci., 2009, 331, 50–56 CrossRef.
- S. Saengmee-Anupharb, T. Srikhirin, B. Thaweboon, S. Thaweboon, T. Amornsakchai, S. Dechkunakorn and T. Suddhasthira, Asian Pac. J. Trop. Biomed., 2013, 3, 47–52 CrossRef PubMed.
- Q. Wang, H. Yu, L. Zhong, J. Liu, J. Sun and J. Shen, Chem. Mater., 2006, 18, 1988–1994 CrossRef.
- M. Diaz, F. Barba, M. Miranda, F. Guitian, R. Torrecillas and J. S. Moya, J. Nanomater., 2009, 498–505 Search PubMed.
- J. K. Liu, X. H. Yang and X. G. Tian, Powder Technol., 2008, 184, 21–24 CrossRef.
- B. Tian, W. Chen, Y. Dong, J. V. Marymont, Y. Lei, Q. Ke, Y. Guo and Z. Zhu, RSC Adv., 2016, 6, 8549–8562 RSC.
- L. Yang, X. Ning, Q. Xiao, K. Chen and H. Zhou, J. Biomed. Mater. Res., Part B, 2007, 81, 50–56 CrossRef PubMed.
- G. Nangmenyi, Z. Yue, S. Mehrabi, E. Mintz and J. Economy, Nanotechnology, 2009, 20, 495705 CrossRef PubMed.
- H. Van der Laan, D. Van Halem, P. W. M. H. Smeets, A. I. A. Soppe, J. Kroesbergen, G. Wubbels, J. Nederstigt, I. Gensburger and S. G. J. Heijman, Water Res., 2014, 51, 47–54 CrossRef PubMed.
- I. De la Rosa-Goméz, M. T. Olguín and D. Alcántara, J. Environ. Manage., 2008, 88, 853–863 CrossRef PubMed.
- L. Akhigbe, S. Ouki and D. Saroj, Chem. Eng. J., 2016, 295, 92–98 CrossRef.
- C. Qi, Y. J. Zhu, X. Y. Zhao, B. Q. Lu, Q. L. Tang, J. Zhao and F. Chen, Eur. J. Chem., 2013, 19, 981–987 CrossRef PubMed.
- C. Qi, Y. J. Zhu, B. Q. Lu, X. Y. Zhao, J. Zhao, F. Chen and J. Wu, Eur. J. Chem., 2013, 19, 5332–5341 CrossRef PubMed.
- G.-J. Ding, Y.-J. Zhu, C. Qi, T.-W. Sun, J. Wu and F. Chen, RSC Adv., 2015, 5, 40154–40162 RSC.
- J. Hinostroza-Ramos, L. Ploux, K. Anselme, L. Balan and A. Simon-Masseron, Cryst. Growth Des., 2016, 16, 4897–4904 CrossRef.
- Y. D. Livney, Curr. Opin. Colloid Interface Sci., 2010, 15, 73–83 CrossRef.
- S. Ashraf, A. Z. Abbasi, C. Pfeiffer, S. Z. Hussain, Z. M. Khalid, P. R. Gil and W. J. Parak, Colloids Surf., B, 2013, 102, 511–518 CrossRef PubMed.
- G. Ghodake, S. R. Lim and D. S. Lee, Colloids Surf., B, 2013, 108, 147–151 CrossRef PubMed.
- World Health Organization, Guidelines for Drinking-Water Quality, 4th edn, WHO Library, Geneva, 2011 Search PubMed.
- J. Tobias, E. Kassem, U. Rubinstein, A. Bialik, S. R. Vutukuru, A. Navaro, A. Rokney, L. Valinsky, M. Ephros, D. Cohen and K. Muhsen, BMC Infect. Dis., 2015, 15, 79 CrossRef PubMed.
- The International Center for Diffraction Data (ICCD), http://www.icdd.com (accessed November 2016).
- E. W. Washburn, Phys. Rev., 1921, 17, 273–283 CrossRef.
- H. Miao, S. Ratnasingam, C. S. Pu, M. M. Desai and C. C. Sze, J. Microbiol. Methods, 2009, 76, 109–119 CrossRef PubMed.
- R. Heim, D. C. Prasher and R. Y. Tsien, Proc. Natl. Acad. Sci. U. S. A., 1994, 9, 12501–12504 CrossRef.
- O. Vidal, R. Longin, C. Prigent-Combaret, C. Dorel, M. Hooreman and P. Lejeune, J. Bacteriol., 1998, 180, 2442–2449 Search PubMed.
- M. Veuillet, Doctoral dissertation, Haute-Alsace University, Mulhouse, France, 2017.
- J. Lehtinen, J. Nuutila and E. M. Lilius, Cytometry, Part A, 2004, 60, 165–172 CrossRef PubMed.
- M. D. Adhikari, B. R. Panda, U. A. Chattopadhyay and A. Ramesh, RSC Adv., 2012, 2, 1782–1793 RSC.
- W. Rasband, ImageJ, U.S. National Institutes of Health, Bethesda, Maryland, USA, 1997 Search PubMed.
- A. Gonzales, P. Thomar, T. Nicolai and J. Dittmer, Food Hydrocolloids, 2015, 51, 88–94 CrossRef.
- M. Quarton, M. T. Oumba and W. Freundlich, Rev. Chim. Miner., 1984, 21, 311–320 Search PubMed.
- D. V. Navolotskaya, H. S. Toh, C. Batchelor–McAuley and R. G. Compton, ChemistryOpen, 2015, 4, 595–599 CrossRef PubMed.
- J. Liu and R. H. Hurt, Environ. Sci. Technol., 2010, 44, 2169–2175 CrossRef PubMed.
- H. D. Zucht, M. Raida, K. Adermann, H. J. Mägert and W. G. Forssmann, FEBS Lett., 1995, 372, 185–188 CrossRef PubMed.
- R. V. Oppermann, G. Rölla, J. R. Johansen and S. Assev, Eur. J. Oral Sci., 1980, 88, 389–396 CrossRef.
- T. N. Phan, T. Buckner, J. Sheng, J. D. Baldeck and R. E. Marquis, Oral Microbiol. Immunol., 2004, 19, 31–38 CrossRef PubMed.
- M. Radzig, V. Nadtochenkoc, O. Koksharova, J. Kiwi, V. Lipasova and I. Khmel, Colloids Surf., B, 2013, 102, 300–306 CrossRef PubMed.
- M. A. Radtsig, O. A. Koksharova and I. A. Khmel, Mol. Genet., Mikrobiol. Virusol., 2009, 4, 27–31 Search PubMed.
- W. Ghandour, J. A. Hubbard, J. Deistung, M. N. Hughes and R. K. Poole, Appl. Microbiol. Biotechnol., 1988, 28, 559–565 CrossRef.
- R. M. Donlan, Emerging Infect. Dis., 2002, 8, 881–890 CrossRef PubMed.
- M. R. W. Brown and P. Gilbert, J. Appl. Microbiol., 1993, 74, 87S–97S CrossRef PubMed.
- A. Gupta, M. Maynes and S. Silver, Appl. Environ. Microbiol., 1998, 64, 5042–5045 Search PubMed.
- S. Agnihotri, S. Mukherji and S. Mukherji, Nanoscale, 2013, 5, 7328–7340 RSC.
- A. Marguier, L. Ploux, unpublished work.
Footnote |
| † Electronic supplementary information (ESI) available. See DOI: 10.1039/c8ra04438d |
| This journal is © The Royal Society of Chemistry 2018 |

