 Open Access Article
Nitrogen doped hierarchical activated carbons derived from polyacrylonitrile fibers for CO2 adsorption and supercapacitor electrodes
L. Zhengab,
W. B. Li *ab and
J. L. Chenab
aDepartment of Chemistry, Tsinghua University, Haidian District, Beijing 100084, China. E-mail: wbli@tsinghua.edu.cn; wblichem@163.com
bGraduate School at Shenzhen, Tsinghua University, University Town, Nanshan District, Shenzhen 518055, China
First published on 24th August 2018
Abstract
Nitrogen doped hierarchical activated carbons with high surface areas and different pore structures are prepared form polyacrylonitrile fibers through KOH activation by two steps. It is found that the specific surface area and porosity of the activated carbons depend strongly on the activation temperatures. The specific surface area increases from 607 m2 g−1 to 3797 m2 g−1 when the activation temperature increases from 600 °C to 800 °C, and then decreases to 3379 m2 g−1 at 900 °C. It shows that the hierarchical activated carbon prepared at a moderate activation temperature of 700 °C exhibits the largest CO2 capture amount, i.e., 5.25 and 3.63 mmol g−1 at 273 and 298 K, respectively, under the pressure of 1 bar. The excellent CO2 capture properties are due to the high specific surface area of 2146 m2 g−1 and high nitrogen content (5.2 wt%) of the obtained sample. On the other hand, when used as supercapacitor electrodes, the sample with the activation temperature at 800 °C shows the largest specific capacitance of 302 F g−1 at a current density of 1 A g−1 in 6 M KOH aqueous electrolyte, with an excellent rate capability of 231 F g−1 at 10 A g−1. Furthermore, a nearly linear relationship between nitrogen content in the nitrogen doped activated carbons and specific CO2 uptake as well as the specific capacitance were first established, indicating nitrogen doping was playing key roles in improving CO2 adsorption and supercapacitor performance. The experimental results indicate that the thus obtained nitrogen doped hierarchical activated carbons are very promising for reducing CO2 green house gas by adsorption as well as storing energy as utilized in supercapacitors.
Introduction
During the past decades, carbon materials have been wildly studied due to their excellent properties including the large surface area, tunable pore structure, chemically inert nature and high conductivity.1–3 These outstanding features make them ideal candidates for applications in energy storage,4,5 catalysis,6,7 and adsorption.8,9 Zhuo et al. fabricated hierarchical porous carbon aerogel from cellulose which exhibited a high specific capacitance of 328 F g−1 (0.5 A g−1, 1.0 M H2SO4) and a good CO2 adsorption capacity of 3.42 mmol g−1 (at 1 atm and 298 K).10 Hu et al. produce N-doped carbons with hierarchical porous structure from cellulose and it had an exceptional CO2 adsorption capacity of 4.99 mmol g−1 and a high specific capacitance of 225 F g−1 (0.5 A g−1).11 In addition, activated carbons can also be prepared by H2O and CO2 activation.12,13For adsorption applications, commercial activated carbons are cost-effective, but they normally have a small adsorption capacity of less than 3.0 mmol g−1 for CO2 at 273 K and 1 bar.14 The incorporation of nitrogen atoms into the carbon framework is a very effective way to improved adsorption/absorption for CO2.15 Wei et al. synthesize ordered mesoporous carbon with high surface area and high N content via solvent evaporation induced self-assembly process, and it shows excellent performance as absorbents for CO2 capture (2.8–3.2 mmol g−1, 298 K, 1.0 bar).16 Wang et al. prepared a series of nitrogen doping templated carbon by post-doping ammonia treatment.17 Although these porous carbons have higher CO2 uptakes than commercial activated carbons, the carbon resources are expensive, and synthesis processes are complicated. Therefore, it is quite important to produce high-performance activated carbon in a simple and cost-effective way.
Based on the charge-storage mechanism, supercapacitors can be divided into electrical double-layer capacitor (EDLC) and pseudocapacitor. EDLCs require electrode materials with high specific surface area and suitable pore size.18 Liu et al. prepared carbon aerogels from nanoparticles of resorcinol–formaldehyde polymers, and obtained a material with the specific surface area and high supercapacitance values.19 Wang et al. created interconnected partially graphitic carbon nanosheets which has a high specific surface area about 2000 m2 g−1, it maintains a remarkable capacitance of 106 F g−1 at a current density of 10 A g−1.20 Pseudocapacitors depend on reversible redox reactions occurring on the surface of the electrodes. The incorporation of heteroatoms such as nitrogen18 into carbon materials can considerably improve the specific capacitance, because the nitrogen-containing functional groups can induce pseudocapacitive effects and improve the wettability of carbon materials to electrolyte solution.21,22
To improve the supercapacitor performance and CO2 adsorption capacity, porous carbon with high surface area and high nitrogen content would be highly desirable. Furthermore, inexpensive carbon materials with the high-performances from easily accessible and renewable sources are also required to meet the demand of broad range of applications. Polyacrylonitrile (PAN), which is widely used as precursors for carbon fiber, typically undergoes a graphitization process at relatively low temperature.8 It has a good conductivity and high specific surface area after activation. Moreover, ultra high nitrogen content may contribute to the high performance of CO2 adsorption and supercapacitor.23
In this work, a series of hierarchically activated carbons with large surface area and ultra high nitrogen content were developed from polyacrylonitrile by two steps. These nitrogen doped activated carbons show a surface area ranging from 607 m2 g−1 to 3797 m2 g−1 with large pore volume of 0.3–2.1 cm3 g−1, which allow for high CO2 adsorption, i.e., 5.25 and 3.63 mmol g−1 at 273 and 298 K, respectively. Moreover, the porous carbons show an outstanding high specific capacitance up to 302 F g−1 at a current density of 1 A g−1 in 6 M KOH aqueous electrolyte. It turns out that the excellent performance is due to the synergistic properties of high specific surface area and high nitrogen content of the porous carbon materials.
Experimental
1. Sample preparation
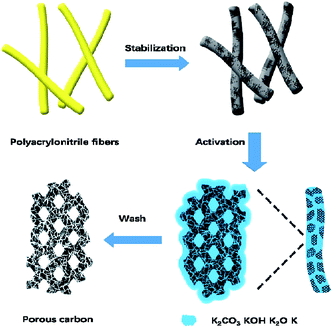
The starting materials were PAN-based fibers with an average diameter around 10 μm. Hierarchical activated carbons were obtained from PAN-based fibers by stabilization and activation. The coarse PAN-based fibers were stabilized in air by raising the temperature from 20 to 270 °C at 3 °C min−1 and holding them at 270 °C for 2 hour, which prevented fibers from sticking to each other during the further treatment at a higher temperature.The stabilized fiber sample was then activated by KOH with KOH/PAN weight ratio of 2 at a temperature from 600 °C to 900 °C. Take the activation with KOH/PAN at 600 °C for example. Typically, 3 g of stabilized fiber was impregnated with a fixed amount of aqueous solution containing 6 g KOH, followed by an evaporation at 120 °C in an oven. The activation process was carried out by heat treatment at 600 °C for 1 h in a tubular furnace under N2 atmosphere with a heating rate of 3 °C min−1. Afterwards, the samples were washed with 1 M HCl and distilled water until the pH value of the filtrate was approximately 7. The final porous carbons were obtained after drying at 80 °C for 24 h (Fig. 1), and named for PC-600. Similarly, the other resultant porous carbons through chemical activation were obtained and denoted as PC-X, where X is the activation temperature.
2. Characterization
Microstructure characterization of the porous carbons was carried out by nitrogen adsorption–desorption isotherms measured at 77 K on an ASAP 2010 Micromeritics instrument (Micrometrics Company, USA). The specific surface area was measured on F-Sorb 2400 analyzer. Before each test, all samples were degassed at 175 °C for 3 h. The pore size distribution of the porous carbons was calculated by the density functional theory (DFT) method. The total pore volumes (Vtotal) were estimated in terms of the adsorption amount obtained at a relative pressure P/P0 of 0.99. The micropore surface (Vmic) area and micropore volume (Smic) (pore size < 2 nm) were obtained via a t-plot analysis. Powder X-ray diffraction (XRD) patterns were analyzed on a Rigaku D/MAX-2500/PC from 2θ value of 10° to 60°. Energy Dispersive Spectrometer and Scanning electron microscopy (SEM) images were obtained on Hitachi S-4800. Raman spectroscopy system (in Via-Reflex, Renishaw, Co., UK), was used for analyzing graphitization degree of the carbon materials.3 Electrochemical measurements
All the electrochemical measurements were carried out on an electrochemical workstation (Model RST5200, Siruisi instrumental technology Co., Ltd) in a standard three-electrode cell system at room temperature.24 Platinum wire and Ag/AgCl electrode were used as the counter and reference electrode, respectively. An aqueous solution of 6 M KOH was used as the electrolyte. The working electrode was prepared by mixing active materials with acetylene black and polytetrafluoroethylene in a mass ratio of 8![[thin space (1/6-em)]](https://www.rsc.org/images/entities/char_2009.gif) :
:![[thin space (1/6-em)]](https://www.rsc.org/images/entities/char_2009.gif) 1
1![[thin space (1/6-em)]](https://www.rsc.org/images/entities/char_2009.gif) :
:![[thin space (1/6-em)]](https://www.rsc.org/images/entities/char_2009.gif) 1, and then pressing onto nickel foam under a pressure of 10 MPa. Each working electrode contained about 4 mg of active materials with a geometric surface area of about circular 1 cm.2 The cyclic voltammetry and galvanostatic charge/discharge measurements were carried out in a potential window between −1.1 and −0.1 V. The electrochemical impedance measurements were performed in a frequency range from 105 and 0.1 Hz with an AC amplitude of 10 mV.
1, and then pressing onto nickel foam under a pressure of 10 MPa. Each working electrode contained about 4 mg of active materials with a geometric surface area of about circular 1 cm.2 The cyclic voltammetry and galvanostatic charge/discharge measurements were carried out in a potential window between −1.1 and −0.1 V. The electrochemical impedance measurements were performed in a frequency range from 105 and 0.1 Hz with an AC amplitude of 10 mV.
The specific capacitances were calculated basing on the galvanostatic charge/discharge curves according to the following equation:11,25
| C = I × Δt/(ΔV × m) |
4. CO2 adsorption measurements
CO2 adsorption measurements were performed on a specially designed Sieverts-type apparatus at 298 K and 273 K.9,26 Prior to adsorption measurements, all samples were heated at 200 °C for at least 3 h under vacuum.Results and discussion
1. Morphology and structure
In order to investigate the development of porosity by KOH activation, the nitrogen adsorption–desorption isotherms of porous carbons were performed, the results are summarized in Fig. 2 and Table 1. In Fig. 2a. The adsorption and desorption isotherms of PC-600 °C, PC-700 °C and PC-800 °C were similar to Type I. PC-900 °C show mixed features of both Type I and Type IV. The steep increase of adsorption amount at the low pressure region indicates the existence of micropores. PC-900 show obvious H4 hysteresis loop occurred at the relative pressure from 0.4 to 0.9, which is a mesoporous capillary condensation phenomenon, and shows the typical features of Type IV isotherm, proving the activation temperatures being an important parameter for controlling the development of porosity. The adsorption isotherms imply that high CO2 adsorption performances might be achieved on the samples, since it has been reported that the CO2 uptake under ambient conditions correlates directly with the presence of ultramicropores.27–30 The PC-600 displayed a micropore diameter of 1.22 nm without other obvious mesopores peak as the PC-700 sample did.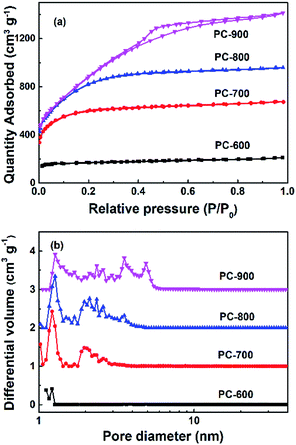 | ||
| Fig. 2 (a) Nitrogen adsorption–desorption isotherms of the carbon materials at 77 K, and (b) pore size distribution curves calculated by DFT. | ||
| Sample | SBET (m2 g−1) | Vt (cm3 g−1) | Vultra (cm3 g−1) | CO2 uptake at 1 bar (mmol g−1) 273 K and 298 K | Nitrogen content(wt%) | ID/IG | |
|---|---|---|---|---|---|---|---|
| PC-600 | 607 | 0.31 | 0.21 | 3.35 | 2.55 | 15.3 | 1.22 |
| PC-700 | 2146 | 1.00 | 0.39 | 5.25 | 3.63 | 5.2 | 1.07 |
| PC-800 | 3797 | 1.42 | 0.31 | 4.22 | 2.56 | 3.1 | 1.00 |
| PC-900 | 3314 | 2.1 | 0.16 | 4.01 | 2.59 | 2.0 | 0.97 |
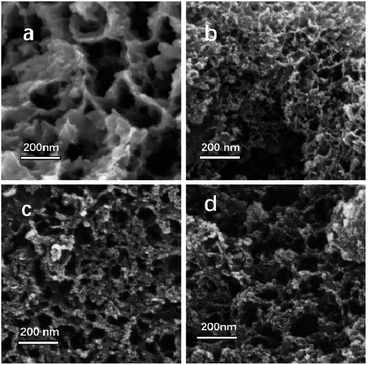
PC-800 and PC-900 exhibit abundant mesopores structures and the mesoporous structures were fully developed as the temperature increased as shown in Fig. 3. The SEM images revealed that the resulting porous carbons show different morphologies from the PC-600 to PC-900 (Fig. 3a–d). PC-600 possesses a lamellar structure with many large pores, the fluffy foam structure and porosity was observed for PC-700, PC-800 and PC-900. The pore arrangement is disordered and the hierarchical pores are enlarged as the activation temperature increased from 700 °C to 900 °C as demonstrated in the PSD and SEM images. Such hierarchical structure is desirable for CO2 capture and energy storage, since the mesopores and macropores facilitate the fast diffusion of either gas CO2 or the electrolyte, while the small pores provided much higher specific surface areas, are therefore favourable for high CO2 uptake and supercapacitors performance.
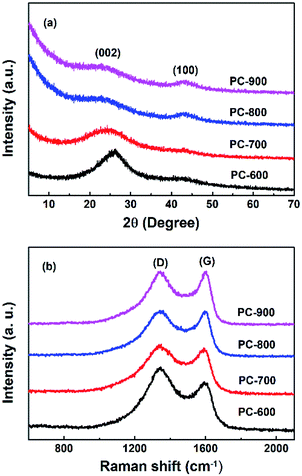
The porosity increases obviously at higher activation temperature, as reflected by the SBET and Vt results in Table 1 and Fig. 2. It is also noted that the highest SBET of 3797 m2 g−1 are achieved on the sample PC-800. The successful doping of nitrogen into the carbon materials is confirmed by EDS analysis. As the activation temperature increased from 600 °C to 900 °C, the nitrogen content was decreased from 15.3 wt% to 2.0 wt%. The crystalline carbon materials were determined by XRD and Raman characterizations, which are shown in Fig. 4a and b, respectively. As the activation temperature increased, the (002) peak intensity of the porous carbons has a markedly reduced and is broadened dramatically. It should ascribe to the etching reaction between KOH and carbon framework that consumes the carbon framework and creates much more pores. A large increase in the low-angle scatter from PC-600 to PC-900 is also noted, which is consistent with the presence of a high density of pore.31 In addition, the (002) peak moved to the left as the activation degree increased, which may contribute to the metallic potassium penetrates between graphitic layers, and the removal of intercalated potassium result in the expansion of the pore network.32 The d (002) was determined to be 3.41, 3.7, 3.82 and 3.95 nm for PC-600, PC-700, PC-800 and PC-900, respectively. Raman spectra of carbon materials shown in Fig. 4b and Table 1 reveal a decrease of ID/IG, which suggests a decrease of disorder structure and an increase of graphitic structure, which is in good agreement with the XRD profiles.
2. Gas adsorption
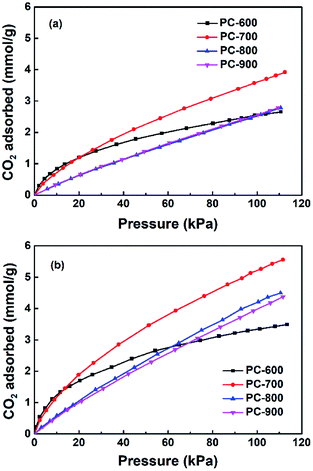
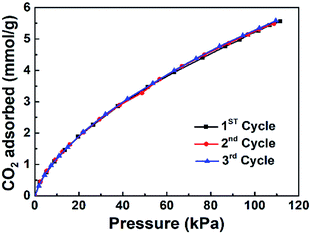
The CO2 uptakes of the porous carbons were measured up to 1 bar at 273 and 298 K. As the activation temperature increased from 600 °C to 800 °C, the specific surface areas of the porous carbons increased from 607 to 3797 m2 g −1. The CO2 uptake increases with the activation temperature first, reaching the maximum for the PC-700 sample, i.e., 5.25 and 3.63 mmol g−1 at 273 and 298 K, respectively, then decreases for the PC-800 sample at higher activation temperature of 800 °C. It is clear that the CO2 adsorption amount at ambient pressure is not linearly related with the specific surface area on these polyacrylonitrile-derived activated carbons, indicating some other factors are possibly involved in the CO2 adsorption process on these nitrogen doped activated carbon materials (Fig. 5).It has been pointed out that narrow micropores play an important role in CO2 adsorption,30,33–35 the CO2 uptake under 1 bar at 298 K and 273 K versus narrow micropore volume with micropore size below 1 nm is plotted in Fig. 6a and b, which indicated that narrow micropores is closely related with the adsorption of CO2. In addition, Fig. 7 and Table 1 shows the nitrogen doping effect on CO2 adsorption. The specific CO2 uptake per square meter, i.e., U0, defined as mmol m−2 of the surface area of the nitrogen doped carbon materials, is given here, and calculated as following: U0 (mmol m−2) = U0 g (mmol g−1)/SBET (m2 g−1), it can be inferred from Fig. 7 that for the nitrogen content in the nitrogen doped carbons has a critical influence on the specific CO2 uptake. Therefore, in order to improve CO2 adsorption capacity, porous carbon materials with high nitrogen content and a high surface area would be highly desirable. In addition, Fig. 8 indicates that the CO2 adsorption can be easily regenerated by vacuum from the PC-700 sample, and CO2 adsorption amount remain almost unchanged after running for three adsorption–desorption cycles, indicating the obtained nitrogen doped activated carbon materials have a strong potential in the capture of CO2 in term of reducing green house gasses.
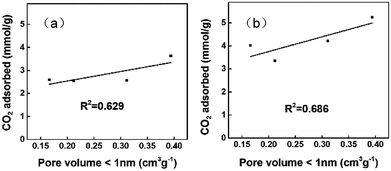 | ||
| Fig. 6 The relationship between the CO2 uptake and narrow micropore volume under 1 bar at 298 K (a) and 273 K (b). | ||
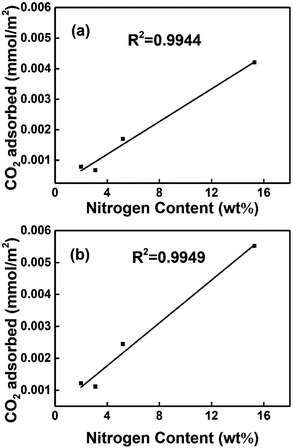 | ||
| Fig. 7 The relationship between the specific CO2 uptake and the nitrogen content at 298 K (a) and 273 K (b). | ||
3. Electrochemical studies
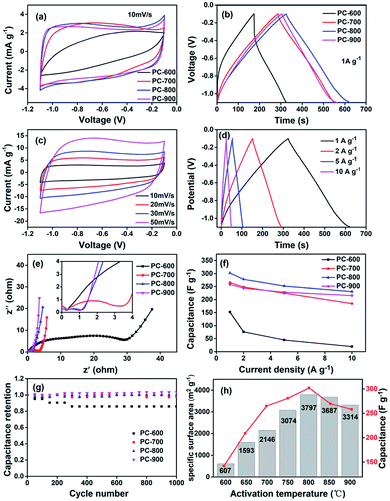
Typical cyclic voltammograms for the prepared porous carbons in 6 M KOH aqueous electrolyte are shown in Fig. 9. The CV curves for these porous carbons at a scan rate of 10 mV s−1 are presented in Fig. 9a, which shows a gradual change from a fusiformis shape to a quasi-rectangular shape. The CV curves of PC-800 and PC-900 are almost rectangular, indicative of excellent candidates as electrode materials. Moreover, PC-800 shows the largest encircled area, suggesting that the hierarchical porous carbons have a better supercapacitive behavior. PC-700 exhibits a broad peak in addition to the rectangular shape, which is due to pseudocapacitive reactions from nitrogen on the interior surface of the porous carbon material.Galvanostatic charge–discharges were performed at a constant current density of 1 A g−1 (Fig. 9b), and PC-800 shows the largest specific capacitance of 302 F g−1, which is in good agreement with the CV profiles. Meanwhile, PC-700 exhibits non-linear charging behavior which represent a pseudocapacitive reactions, it also has an specific capacitance of 225 F g−1 although its SSA is only about half of PC-800, which is possibly due to the high nitrogen content in the sample.
Fig. 9c presents the CV curves for PC-800 at various scan rates changing from 10 to 50 mV s−1. As the scan rate increased, the CV curves became gradually depressed but still maintained a rectangular shape. This means that the PC-800 electrode would be suitable for quick charge–discharge operations. The charge–discharge curve (Fig. 9d) of the PC-800 electrode based devices is close to a linear line within the potential window, showing a typical electrochemical double layer supercapacitive behavior.
To estimate the conductivity and ion transport/diffusion ability, we used the EIS technique. Nyquist plots for the four samples at frequencies between 105 and 0.1 Hz was shown in Fig. 9e. The impedance plots show one semicircle in the high-frequency region, a sloped straight line in the low frequency region, and a Warburg slope of 45° in the middle frequency region between the semicircle and the straight line. The internal resistances of all three samples are sequentially 0.25, 0.26, 0.29 and 0.30 Ω for PC-600, PC-700, PC-800 and PC-900, which indicate that PC-900 has the most effective ion transport of the electrolyte in the process of charge–discharge. The expanded semicircle diameter presents the magnitude of RCT,36 PC-900 shows the smallest semicircle diameter among the samples.
Fig. 9e shows that with the increase of the activation temperature, the internal resistance and the charge transfer resistance decrease in the sequence of PC-600 > PC-700 > PC-800 > PC-900, which can be ascribed to the increased conductivity because of an increased graphitization degree as confirmed by the Raman spectra in Fig. 4b.
Fig. 9f shows the specific capacitance as a function of current density for all the samples. It is clear that the specific capacitances of all the samples decrease with an increase in the current densities from 1 to 10 A g−1; among all the samples the specific capacitances of PC-800 has the highest value, i.e., 231 F g−1 at 10 A g−1, which is a very attractive value with a high rate capacity for supercapacitors. It has to be mentioned that although the specific capacitances of PC-700 are higher than those of PC-900 at low current densities, PC-900 exhibits a better capacitive performance at high current densities. The specific capacitance of PC-900 can remain at 216 F g−1 at a current density of 10 A g−1, while the value of PC-700 is 185 F g−1. At the current density of 10 A g−1, the capacitance retention ratios are 84% 76% 70% and 13% for PC-900, PC-800, PC-700 and PC-600, respectively, with a decreasing tendency when increasing the activation temperature, which is due to increased graphitization degree as well as the decrease in the internal resistance and the charge transfer resistance as mentioned above.
The cycling stability is also a crucial parameter for the supercapacitor electrode materials, especially if pseudocapacitance exists. To investigate the cycling stability, the galvanostatic charge/discharge cycling of carbon materials was performed at a current density of 5 A g−1 as shown in Fig. 9g. After 1000 cycles, the capacitance retention ratios are 103% 100% 97% and 86% for PC-900, PC-800, PC-700 and PC-600, respectively. The improved cycling stability of porous carbon may be due to the increased graphitization degree as the activation temperature increased. In addition, the nitrogen content decreases with an increase in carbonization temperature as shown in Table 1, and surface functional groups strongly bonding with the carbon and keeping stable during these cycling. The relationship between specific surface area and specific capacitance are shown in Fig. 9h and 10a. The results indicate that both values reached a maximum point when the activation temperature rose to 800 °C, and the high specific surface area is closely related with the supercapacitive performances. PC-700 has a very high specific capacitance of 225 F g−1, although its SSA is about a half of PC-800. In addition, it exhibits a kind of broad peaks in the rectangular shape as shown in Fig. 9a, which indicates pseudocapacitive reactions from nitrogen on the interior surface of the porous carbon. The specific capacitance at 1 A g−1, Co, defined as F m−2 of carbon surface area, calculated by the ratio Co (F m−2) = Co (F g−1)/SBET (m2 g−1), varies between 0.07 and 0.23 F m−2 for a 6 M KOH electrolyte as shown in Fig. 10b. Centeno et al. also find that specific capacitance at low current densities, Co, in F m−2 of carbon surface area varies between 0.06 and 0.22 F m−2 for a 5 M KOH electrolyte.37 It is clear that nitrogen content has a critical influence on the specific capacitance on the nitrogen doped carbons, and it is suggested that both the high nitrogen content and high surface area would significantly contribute to the improvement of the supercapacitive performances on these carbon materials.
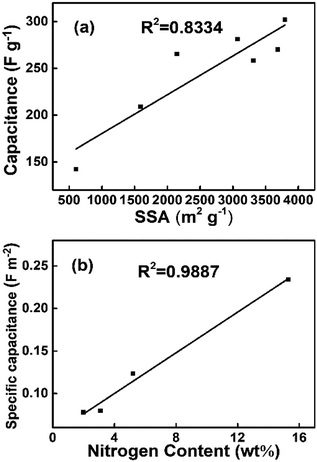 | ||
| Fig. 10 The relationship between the capacitance at 1 A g−1 and SSA and the relationship between the specific capacitance at 1 A g−1 and nitrogen content. | ||
Conclusions
In summary, nitrogen doped hierarchically activated carbons with a large surface area are prepared through KOH activation of polyacrylonitrile-based pre-oxidized fiber. PC-700 displays a moderate SSA of 2146 m2 g−1 and an exceptionally CO 2 uptake ability of 5.25 and 3.63 mmol g −1 at 273 K and 298 K, respectively. The experiment results confirmed that the presence of high surface area was playing a key role in achieving high CO2 adsorption capability, which could be further enhanced by nitrogen doping. PC-800 could be one of the best candidates for supercapacitors with a high specific capacitance of 302 F g −1 at 1 A g −1, and good cycling stability of 100% capacitance retention over 1000 cycles. Benefiting from the high nitrogen content, high surface areas and high graphitization degree, it is likely that the nitrogen doped porous carbons are very promising for CO2 gas adsorption and the supercapacitor materials for energy storage.Conflicts of interest
There are no conflicts to declare.Acknowledgements
The authors acknowledge the financial supports from the National Key Basic Research Program No. 2013CB933103 funded by MOST and the Program for the Fundamental Research Supported by Shenzhen Science and Technology Innovations Council of China (Grant No. JSF201006300047A, No. JC201105201126A, and No. ZDSY20120619140933512).Notes and references
- T. Otowa, Y. Nojima and T. Miyazaki, Development of KOH activated high surface area carbon and its application to drinking water purification, Carbon, 1997, 35(9), 1315–1319 CrossRef.
- N. Grossiord, J. Loos, L. van Laake, M. Maugey, C. Zakri, C. E. Koning and A. J. Hart, High-Conductivity Polymer Nanocomposites Obtained by Tailoring the Characteristics of Carbon Nanotube Fillers, Adv. Funct. Mater., 2008, 18(20), 3226–3234 CrossRef.
- H. Zhang, O. Noonan, X. Huang, Y. Yang, C. Xu, L. Zhou and C. Yu, Surfactant-Free Assembly of Mesoporous Carbon Hollow Spheres with Large Tunable Pore Sizes, ACS Nano, 2016, 10(4), 4579–4586 CrossRef PubMed.
- Y. S. Yun, M. H. Park, S. J. Hong, M. E. Lee, Y. W. Park and H. J. Jin, Hierarchically porous carbon nanosheets from waste coffee grounds for supercapacitors, ACS Appl. Mater. Interfaces, 2015, 7(6), 3684–3690 CrossRef PubMed.
- K. Brousse, P. Huang, S. Pinaud, M. Respaud, B. Daffos, B. Chaudret, C. Lethien, P. L. Taberna and P. Simon, Electrochemical behavior of high performance on-chip porous carbon films for micro-supercapacitors applications in organic electrolytes, J. Power Sources, 2016, 328, 520–526 CrossRef.
- H. W. Liang, X. Zhuang, S. Bruller, X. Feng and K. Mullen, Hierarchically porous carbons with optimized nitrogen doping as highly active electrocatalysts for oxygen reduction, Nat. Commun., 2014, 5, 4973 CrossRef PubMed.
- J. L. Chen, W. B. Li and B. Q. Xu, Nitrogen-rich Fe-N-C materials derived from polyacrylonitrile as highly active and durable catalysts for the oxygen reduction reaction in both acidic and alkaline electrolytes, J. Colloid Interface Sci., 2017, 502, 44–51 CrossRef PubMed.
- N. P. Wickramaratne, J. Xu, M. Wang, L. Zhu, L. Dai and M. Jaroniec, Nitrogen Enriched Porous Carbon Spheres: Attractive Materials for Supercapacitor Electrodes and CO2 Adsorption, Chem. Mater., 2014, 26(9), 2820–2828 CrossRef.
- D. Li, W. B. Li, J. S. Shi and F. W. Xin, Influence of doping nitrogen, sulfur, and phosphorus on activated carbons for gas adsorption of H2, CH4 and CO2, RSC Adv., 2016, 6(55), 50138–50143 RSC.
- H. Zhuo, Y. Hu, X. Tong, L. Zhong, X. Peng and R. Sun, Sustainable hierarchical porous carbon aerogel from cellulose for high-performance supercapacitor and CO2 capture, Ind. Crops Prod., 2016, 87, 229–235 CrossRef.
- Y. Hu, X. Tong, H. Zhuo, L. Zhong, X. Peng, S. Wang and R. Sun, 3D hierarchical porous N-doped carbon aerogel from renewable cellulose: an attractive carbon for high-performance supercapacitor electrode and CO2 adsorption, RSC Adv., 2016, 6(19), 15788–15795 RSC.
- M. Yu, Y. Han, J. Li and L. Wang, CO2-activated porous carbon derived from cattail biomass for removal of malachite green dye and application as supercapacitors, Chem. Eng. J., 2017, 317, 493–502 CrossRef.
- E. Taer, Apriwandi, Yusriwandi, W. S. Mustika, Zulkifli, R. Taslim, Sugianto, B. Kurniasih, Agustino and P. Dewi, Comparative study of CO2 and H2O activation in the synthesis of carbon electrode for supercapacitors, AIP Conf. Proc., 2018, 1927(1), 030036 CrossRef.
- S. Choi, J. H. Drese and C. W. Jones, Adsorbent materials for carbon dioxide capture from large anthropogenic point sources, ChemSusChem, 2009, 2(9), 796–854 CrossRef PubMed.
- G. Sethia and A. Sayari, Comprehensive study of ultra-microporous nitrogen-doped activated carbon for CO2 capture, Carbon, 2015, 93, 68–80 CrossRef.
- J. Wei, D. Zhou, Z. Sun, Y. Deng, Y. Xia and D. Zhao, A Controllable Synthesis of Rich Nitrogen-Doped Ordered Mesoporous Carbon for CO2Capture and Supercapacitors, Adv. Funct. Mater., 2013, 23(18), 2322–2328 CrossRef.
- L. Wang and R. T. Yang, Significantly Increased CO2 Adsorption Performance of Nanostructured Templated Carbon by Tuning Surface Area and Nitrogen Doping, J. Phys. Chem. C, 2012, 116(1), 1099–1106 CrossRef.
- J. W. F. To, Z. Chen, H. Yao, J. He, K. Kim, H.-H. Chou, L. Pan, J. Wilcox, Y. Cui and Z. Bao, Ultrahigh Surface Area Three-Dimensional Porous Graphitic Carbon from Conjugated Polymeric Molecular Framework, ACS Cent. Sci., 2015, 1(2), 68–76 CrossRef PubMed.
- N. Liu, J. Shen and D. Liu, Activated high specific surface area carbon aerogels for EDLCs, Microporous Mesoporous Mater., 2013, 167, 176–181 CrossRef.
- H. Wang, Z. Xu, A. Kohandehghan, Z. Li, K. Cui, X. Tan, T. J. Stephenson, C. K. King’ondu, C. M. B. Holt, B. C. Olsen, J. K. Tak, D. Harfield, A. O. Anyia and D. Mitlin, Interconnected Carbon Nanosheets Derived from Hemp for Ultrafast Supercapacitors with High Energy, ACS Nano, 2013, 7(6), 5131–5141 CrossRef PubMed.
- Y. Li, G. Wang, T. Wei, Z. Fan and P. Yan, Nitrogen and sulfur co-doped porous carbon nanosheets derived from willow catkin for supercapacitors, Nano Energy, 2016, 19, 165–175 CrossRef.
- G. Hasegawa, T. Deguchi, K. Kanamori, Y. Kobayashi, H. Kageyama, T. Abe and K. Nakanishi, High-Level Doping of Nitrogen, Phosphorus, and Sulfur into Activated Carbon Monoliths and Their Electrochemical Capacitances, Chem. Mater., 2015, 27(13), 4703–4712 CrossRef.
- Y. Wang, B. Fugetsu, Z. Wang, W. Gong, I. Sakata, S. Morimoto, Y. Hashimoto, M. Endo, M. Dresselhaus and M. Terrones, Nitrogen-doped porous carbon monoliths from polyacrylonitrile (PAN) and carbon nanotubes as electrodes for supercapacitors, Sci. Rep., 2017, 7, 40259 CrossRef PubMed.
- Y. C. Wang, W. B. Li, L. Zhao and B. Q. Xu, MOF-derived binary mixed metal/metal oxide @carbon nanoporous materials and their novel supercapacitive performances, Phys. Chem. Chem. Phys., 2016, 18(27), 17941 RSC.
- S. Wang, Z. Ren, J. Li, Y. Ren, L. Zhao and J. Yu, Cotton-based hollow carbon fibers with high specific surface area prepared by ammonia etching for supercapacitor application, RSC Adv., 2014, 4(59), 31300–31307 RSC.
- J. Shi, W. Li and D. Li, Synthesis, Nickel Decoration, and Hydrogen Adsorption of Silica-Templated Mesoporous Carbon Material with High Surface Area, J. Phys. Chem. C, 2015, 119(41), 23430–23435 CrossRef.
- J. W. To, J. He, J. Mei, R. Haghpanah, Z. Chen, T. Kurosawa, S. Chen, W. G. Bae, L. Pan, J. B. Tok, J. Wilcox and Z. Bao, Hierarchical N-Doped Carbon as CO2 Adsorbent with High CO2 Selectivity from Rationally Designed Polypyrrole Precursor, J. Am. Chem. Soc., 2016, 138(3), 1001–1009 CrossRef PubMed.
- J. Han, G. Xu, B. Ding, J. Pan, H. Dou and D. R. MacFarlane, Porous nitrogen-doped hollow carbon spheres derived from polyaniline for high performance supercapacitors, J. Mater. Chem. A, 2014, 2(15), 5352–5357 RSC.
- H. Wei, S. Deng, B. Hu, Z. Chen, B. Wang, J. Huang and G. Yu, Granular bamboo-derived activated carbon for high CO(2) adsorption: the dominant role of narrow micropores, ChemSusChem, 2012, 5(12), 2354–2360 CrossRef PubMed.
- M. Sevilla and A. B. Fuertes, Sustainable porous carbons with a superior performance for CO2 capture, Energy Environ. Sci., 2011, 4(5), 1765 RSC.
- Y. Zhu, S. Murali, M. D. Stoller, K. J. Ganesh, W. Cai, P. J. Ferreira, A. Pirkle, R. M. Wallace, K. A. Cychosz, M. Thommes, D. Su, E. A. Stach and R. S. Ruoff, Carbon-Based Supercapacitors Produced by Activation of Graphene, Science, 2011, 332(6037), 1537–1541 CrossRef PubMed.
- J. Romanos, M. Beckner, T. Rash, L. Firlej, B. Kuchta, P. Yu, G. Suppes, C. Wexler and P. Pfeifer, Nanospace engineering of KOH activated carbon, Nanotechnology, 2012, 23(1), 015401 CrossRef PubMed.
- M. Sevilla, J. B. Parra and A. B. Fuertes, Assessment of the role of micropore size and N-doping in CO2 capture by porous carbons, ACS Appl. Mater. Interfaces, 2013, 5(13), 6360–6368 CrossRef PubMed.
- V. Presser, J. McDonough, S.-H. Yeon and Y. Gogotsi, Effect of pore size on carbon dioxide sorption by carbide derived carbon, Energy Environ. Sci., 2011, 4(8), 3059 RSC.
- C. Xu, C. Q. Ruan, Y. Li, J. Lindh and M. Strømme, High-Performance Activated Carbons Synthesized from Nanocellulose for CO2 Capture and Extremely Selective Removal of Volatile Organic Compounds, Adv. Sustainable Syst., 2017, 2(2), 1700147 CrossRef.
- Y. Qiu, X. Zhang and S. Yang, High performance supercapacitors based on highly conductive nitrogen-doped graphene sheets, Phys. Chem. Chem. Phys., 2011, 13(27), 12554–12558 RSC.
- T. A. Centeno and F. Stoeckli, On the specific double-layer capacitance of activated carbons, in relation to their structural and chemical properties, J. Power Sources, 2006, 154(1), 314–320 CrossRef.
| This journal is © The Royal Society of Chemistry 2018 |

