 Open Access Article
Detection of chymase activity using a specific peptide probe conjugated onto gold nanoparticles†
Hui-Fang Chang‡
ab,
Yu-Ling Sun‡c,
Fang-Yuan Yeha,
I-Hua Tseng a,
Chia-Chu Changdefgh and
Chih-Sheng Lin
 *a
*a
aDepartment of Biological Science and Technology, National Chiao Tung University, Hsinchu, Taiwan. E-mail: lincs@mail.nctu.edu.tw; Tel: +886-3-5131338
bDivision of Endocrinology, Department of Internal Medicine, Hsinchu Mackay Memorial Hospital, Hsinchu, Taiwan
cAquatic Technology Laboratories, Agricultural Technology Research Institute, Hsinchu, Taiwan
dDepartment of Internal Medicine, Changhua Christian Hospital, Changhua, Taiwan
eDepartment of Environmental and Precision Medicine Laboratory, Changhua Christian Hospital, Changhua, Taiwan
fSchool of Medicine, Chung-Shan Medical University, Taichung, Taiwan
gDepartment of Internal Medicine, Kuang Tien General Hospital, Taichung, Taiwan
hDepartment of Nutrition, Hungkuang University, Taichung, Taiwan
First published on 14th August 2018
Abstract
Gold nanoparticles (AuNPs) can be applied in biosensors using fluorescence resonance energy transfer (FRET) technique. Based on this technique, we have established a sensitive and efficient biosensing method by modifying a peptide-probe onto AuNPs to detect proteinase enzyme activity in this study. This biosensing method was designed for chymase activity detection and applied in kidney disease diagnosis. In this study, 16 nm-AuNPs were used to construct the AuNPs-based fluorescence peptide probe (named AuNPs-peptide probe) for chymase activity determination. The peptide sequence is FITC-Acp-DRVYIHPFHLDDDDDC, which comprises a fluorophore at the N-terminal end, an enzyme (chymase) substrate (DRVYIHPFHL), a spacer (DDDDD) and cysteine (C) to conjugate to AuNPs surface. When the enzyme catalyzes the substrate sequence, the fluorophore drifts away from AuNPs and the fluorescence emitting signal can be excited at 495 nm and detected at 515 nm. The results indicate that the time required for the AuNPs-peptide probe for activity detection of chymase was only 15 min, and a linear correlation from 10 to 100 ng mL−1 of chymase was acquired. The chymase reaction would be significantly inhibited by addition of specific chymase inhibitor chymostatin. The AuNPs-peptide probe was tested for the detection of high concentrations of trypsin and chymotrypsin, but only minor emitted fluorescence intensity was detected. According to these results, sensitivity and specificity of the AuNPs-peptide probe for chymase detection have been confirmed. AuNPs-peptide probe was successfully used for the detection of renal chymase activity; and the results indicate the pathogenically increased chymase activity in kidney tissue of nephropathic mice from aristolochic acid I treatment.
Introduction
Recently, combining nanotechnology with biology has been a popular strategy and several types of nanoparticles have been applied in biosensing and biomedicine fields.1–3 Among nanoparticles, gold nanoparticles (AuNPs) have unique physical characteristics that make them the most commonly used nanoparticles in biosensing for diagnosis of diseases.4,5 AuNPs can be applied in biosensing platforms with the attribute of fluorescence resonance energy transfer (FRET).6–8 FRET is a physical phenomenon where energy created by fluorescence excitation of one molecule is transferred to an adjacent molecule. Based on the FRET technique, numerous biosensor platforms have been developed.9,10 AuNPs have been employed to establish biosensing platforms through conjugation with several types of biomolecules, such as nucleic acids, peptides, antibodies and enzymes.11–13 In these molecules, peptides with specific sequences are the most common choice because of convenience of design and manipulation.13–16The bioactivity of chymase is similar to that of angiotensin-converting enzyme (ACE) that converts angiotensin I (Ang I) to angiotensin II (Ang II) in the renin-angiotensin system (RAS) to activate Ang II/AT1R (Ang II type I receptor) axis-related signaling pathways.17 Chymase belongs to the chymotrypsin family of serine proteinases.18 In previous studies, chymase expression increased in renal tissue in various kidney diseases.19–21 This high level of chymase may be expressed from mast cells in the diseased tissue of kidneys.22,23 Several chymase assays have been commonly used, including spectrophotometric, fluorophotometric and high-performance liquid chromatographic (HPLC) methods.24–26 However, they are often time consuming, expensive, or have low sensitivity. With the rise of nanotechnology, several types of nanoparticles have been widely used in biosensors, among which AuNPs are the most popular. Owing to their unique physical attribute of conjugating with small molecules, we established an AuNPs-based fluorescence biosensor platform, which modified the FITC-labeled peptide onto AuNPs as the proteinase substrate.7 Due to the quenching effect of AuNPs, once the enzyme catalyzes the substrate, the labeled FITC drifts away from the AuNPs surface, thus recovering the fluorescence signal (ESI Fig. S1†). In the present study, the platform was modified and extensively applied in the detection of chymase in tissue homogenate. Additionally, the platform was used to study chronic kidney disease induced by aristolochic acid I (AAI), which found in a Chinese herb.
Materials and methods
Chemicals
All chemicals were of analytical grade. Sodium citrate (C6H5Na3O7·2H2O), sodium chloride (NaCl), hydrogen tetrachloroaurate (III) (HAuCl4·3H2O), aristolochic acid I (AAI; #A5512), chymotrypsin (#C4129), trypsin (#T4665), chymostatin (#C7268), chymase (#C8118), and DL-dithiothreitol (DTT; #D5545) were purchased from Sigma-Aldrich (St. Louis, MO, USA). Chymase antibody (#GTX105829) and β-actin (GTX109639) were purchased from GeneTex (Irvine, CA, USA). Horseradish peroxidase (HRP) labeled secondary antibody (goat anti-rabbit IgG, #sc2004) was purchased from Santa Cruz Biotechnology (Santa Cruz, CA, USA).Peptide substrates
Fluorescein isothiocyanate (FITC) labeled peptide was commercially synthesized by Genesis Biotech (Taipei, Taiwan) and used for self-assembled AuNPs biosensing platform. The sequence of this FITC labeled peptide is FITC-Acp-DRVYIHPFHLDDDDDC. The peptide substrate (DRVYIHPFHL) detects chymase and its sequence is the same as Ang I. This peptide substrate was conjugated with Acp as a spacer and FITC as fluorophore at the N-terminal. Five negatively charged aspartic acid molecules (D) decrease the steric barrier and enhance the signal. The last residue, viz., cysteine at the C-terminal, conjugates to AuNPs surface through Au–S bond. The pI of the peptide was calculated by the free online tool, Peptide Property Calculator. The peptide (pI = 3.98) can be conjugated onto AuNPs in self-assembly manner at room temperature and pH 5.6 to form AuNPs-peptide probe (ESI Table S1†).Synthesis of AuNPs
AuNPs were prepared by citrate reduction method according to the reported protocol.12 A 50 mL aqueous solution in a conical flask containing 1.0 mM chloroauric acid was heated to a vigorous boil with stirring. Then, 38.8 mM sodium citrate solution (5 mL) was rapidly added to the solution. The solution was boiled for another 15 min and the color changed from pale yellow to deep red. The solution was cooled to room temperature with continuous stirring.Sizes of AuNPs were measured by BI-200SM Goniometer, which is a dynamic light scattering (DLS) system (Brookhaven Instruments Corporation, Holtsville, NY, USA). DLS is a technique that can be used to determine the size distribution profile of small particles in solution. Brownian motion of small particles causes a Doppler shift in the frequency of incident light, which can be related to size of the particles. Absorbance of the as-synthesized AuNPs was recorded by a UV-Vis spectrophotometer (SpectraMax 190, Molecular Devices Corporation, Sunnyvale, CA, USA) from 400 to 700 nm at 1 nm intervals. The as-produced 15–17 nm citrate-stabilized AuNPs were preserved at 4 °C until further application.
Preparation of AuNPs-peptide probe
The FITC-labeled peptide was immobilized on AuNPs through the thiol group (–SH) of cysteine (Cys) at C-terminal. The optical density of the as-produced 15–17 nm AuNPs solution was measured at 520 nm (OD520) and then, the optical density was adjusted with sterilized water to OD520 = 1.0. Then, 980 μL of 2.5 nM AuNPs was mixed with 10 μL of 1 mg mL−1 FITC-labeled peptide and 10 μL of 0.01 M phosphate buffer containing 0.1% SDS and 0.3 M NaCl. The AuNPs-peptide probe solution was shaken for 12 h at 40 rpm at room temperature in the dark. Then, 10 μL of 0.1 mM 6-mercaptohexan-1-ol (MCH) was added for another 2 h with constant shaking.27 Before using the AuNPs-peptide probe, it was centrifuged (10![[thin space (1/6-em)]](https://www.rsc.org/images/entities/char_2009.gif) 000 rpm, 20 min at 4 °C) to exclude excess FITC-labeled peptide that was not modified onto AuNPs. The supernatant was carefully removed and 1000 μL sterilized water was added.
000 rpm, 20 min at 4 °C) to exclude excess FITC-labeled peptide that was not modified onto AuNPs. The supernatant was carefully removed and 1000 μL sterilized water was added.
Gel electrophoresis of AuNPs
Gel electrophoresis was performed to confirm the change in color of AuNPs after modification and enzyme digestion.12 Visible color changes in AuNPs red band and UV light excited fluorescence band could be observed. Furthermore, 1.5% agarose gel was prepared with working TBE buffer (45 mM Tris-borate/1 mM EDTA). All samples were prepared with 35% glycerol at ratio of 7![[thin space (1/6-em)]](https://www.rsc.org/images/entities/char_2009.gif) :
:![[thin space (1/6-em)]](https://www.rsc.org/images/entities/char_2009.gif) 1 for increasing the density. Furthermore, a small amount of 10% SDS (1 μL) was added to the bare AuNPs to help the AuNPs move toward the positive electrode. Horizontal electrophoresis system was used, and the gel was run for 30 min at 110 V in working TBE buffer. Images were collected by digital camera under both white light and UV light.
1 for increasing the density. Furthermore, a small amount of 10% SDS (1 μL) was added to the bare AuNPs to help the AuNPs move toward the positive electrode. Horizontal electrophoresis system was used, and the gel was run for 30 min at 110 V in working TBE buffer. Images were collected by digital camera under both white light and UV light.
Confirmation of peptide substrates conjugated onto AuNPs
In order to calculate conjugation efficiency of FITC-labeled peptide onto AuNPs, it is necessary to utilize a compound that can displace the FITC-labeled peptide immobilized on AuNPs. DTT is widely used for AuNPs-based platforms to separate molecules or ligands from the AuNPs surface28 because DTT is a small, compact molecule with very high affinity towards AuNPs owing to the two thiol groups (–SH) that allow it to easily penetrate and conjugate to AuNPs. It is believed that DTT added in excess can completely displace most molecules or ligands immobilized on AuNPs.In this study, the FITC-labeled peptide was quantified by measuring the fluorescence intensity using a fluorescence spectrophotometer (F-2700; Hitachi, Tokyo, Japan). DTT displacement experiment was conducted by adding 500 μL DTT (50 mg mL−1, dissolved in 0.1 M PB buffer (pH 6.5)), to AuNPs-peptide probe sediment (0.625 nM) for 12 h at room temperature. The fluorescence intensity of a certain volume FITC-labeled peptide was recorded with desired dilutions, and a linear correlation between concentration of FITC-labeled peptide and fluorescence intensity was obtained. The supernatant was centrifuged and the AuNPs-peptide probe sediment after DTT-displacement was processed by the same procedures to obtain the linear correlation. Fluorescence intensity was detected at 515 nm with excitation wavelength of 495 nm (ex./em. = 495/515 nm).
Chymase activity assay by AuNPs-peptide probe
The chymase activity assay was conducted using a total volume of 250 μL, comprising AuNPs-peptide probe (FITC-Acp-DRVYIHPFHLDDDDDC-AuNPs; 125 μL), reactive buffer (TTC buffer; 50 mM Tris, 10 mM CaCl2, 150 mM NaCl and 0.05% Brij 35, pH 8), and sample containing chymase, proteinase or kidney tissue homogenate. The samples were incubated for 15 min at 37 °C. Fluorescence intensity was recorded and analyzed at 515 nm with excitation wavelength of 495 nm (ex./em. = 495/515 nm) by a fluorescence spectrophotometer.Chymase inhibition assay
The inhibition study was carried out with chymostatin, a chymase inhibitor, in total volume of 250 μL, containing AuNPs-peptide probe, reactive buffer (TTC buffer, pH 8), chymase and chymostatin. Different concentrations of chymostatin (5 to 50 μM) were added to the reaction solution and incubated for 15 min at 37 °C. Fluorescence intensity was recorded (ex./em. = 495/515 nm) by a fluorescence spectrophotometer and then, the inhibition rate of chymase activity was calculated.Animal study of AAI-induced kidney injury
C57BL/6 mice were divided into 2 groups (n = 9 in each group): a group with disease development from AAI treatment and a group of Sham control. The mice in AAI group were treated with a dose of 10 mg per kg per 3 days AAI (accumulated dose of 100 mg kg−1) via i.p. injection for a period of 28 days (0–4 weeks), and then sacrificed after another 28 days (total of 8 weeks for experiment). The Sham control mice were treated with pH 7.4 PBS and sacrificed on day 56. The experimental protocols conformed to the Guide for the Care and Use of Laboratory Animals published by National Institutes of Health (NIH Publication, 8th edition, 2011) and were approved by the animal welfare committees of National Chiao Tung University, Taiwan. The number of mice used in this study was evaluated and minimized with best effort.Mice urine was collected in a metabolism cage for 24 h before animals were sacrificed. After experiments, the mice were sacrificed after anesthetization by injection of avertin (250 mg kg−1), and blood was collected by direct cardiac puncture. The blood samples without adding heparin were centrifuged (3000g, 15 min at 4 °C) to acquire serum (supernatants). The kidney tissues were excised after perfusion with 0.9% NaCl solution. All of the urine, serum and tissue samples were stored at −80 °C until use. To evaluate renal function of the experimental mice, the levels of creatinine, albumin and blood urea nitrogen in urine and serum were measured using a Fujifilm clinical chemical analyzer (Dri-Chem 3500i; Fujifilm, Tokyo, Japan).
Tissue protein extraction and Western blot
Weighed kidney samples (200 mg) were homogenized with lysis buffer PRO-PREP™ Protein Extraction Solution (iNtRON Biotechnology, Kyungki-Do, Korea). The samples were centrifuged (12![[thin space (1/6-em)]](https://www.rsc.org/images/entities/char_2009.gif) 000g, 10 min at 4 °C) to separate supernatants from pellets. The obtained supernatants were used for assays of chymase expression by Western blot and chymase enzyme activity. Protein concentration of the homogenous extract was measured by Bradford dye binding assay (Bio-Rad Laboratories, Hercules, CA, USA) with bovine serum albumin (BSA) as the standard.
000g, 10 min at 4 °C) to separate supernatants from pellets. The obtained supernatants were used for assays of chymase expression by Western blot and chymase enzyme activity. Protein concentration of the homogenous extract was measured by Bradford dye binding assay (Bio-Rad Laboratories, Hercules, CA, USA) with bovine serum albumin (BSA) as the standard.
Western blot for chymase protein expression was conducted as per our previous report.29 Aliquots containing 10 μg kidney tissue proteins were electrophoresed on 10% SDS-PAGE gels and then, the gels were transferred to polyvinylidene fluoride membranes (Immobilon-P™, Millipore, Bedford, MA, USA). Primary antibodies against protein were diluted 1![[thin space (1/6-em)]](https://www.rsc.org/images/entities/char_2009.gif) :
:![[thin space (1/6-em)]](https://www.rsc.org/images/entities/char_2009.gif) 2000 for chymase and β-actin and secondary antibodies were diluted 1
2000 for chymase and β-actin and secondary antibodies were diluted 1![[thin space (1/6-em)]](https://www.rsc.org/images/entities/char_2009.gif) :
:![[thin space (1/6-em)]](https://www.rsc.org/images/entities/char_2009.gif) 4000. An enhanced chemiluminescent substrate for HRP detection was used (Western Lighting Plus-ECL, Enhanced Chemiluminescent Substrate; PerkinElmer, Boston, MA, USA) and the membranes were exposed to Lumi-Film Chemiluminescent Detection Film (Roche, Indianapolis, IN, USA). Bands on the images were detected at the anticipated locations based on size. The band intensity was quantified using Scion Image software (Scion, Frederick, MD, USA). The amounts of chymase were expressed relative to amount of β-actin (as internal standard) in detection.
4000. An enhanced chemiluminescent substrate for HRP detection was used (Western Lighting Plus-ECL, Enhanced Chemiluminescent Substrate; PerkinElmer, Boston, MA, USA) and the membranes were exposed to Lumi-Film Chemiluminescent Detection Film (Roche, Indianapolis, IN, USA). Bands on the images were detected at the anticipated locations based on size. The band intensity was quantified using Scion Image software (Scion, Frederick, MD, USA). The amounts of chymase were expressed relative to amount of β-actin (as internal standard) in detection.
Statistical analysis
All values were expressed as mean ± standard deviation (SD). Statistical significance between the two groups was assessed by Student's t-test. For the p value less than 0.05, the differences were considered statistically significant.Results
Characteristics of synthesized AuNPs and AuNPs-peptide probe
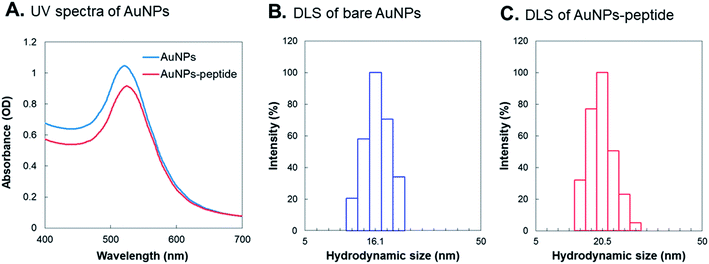
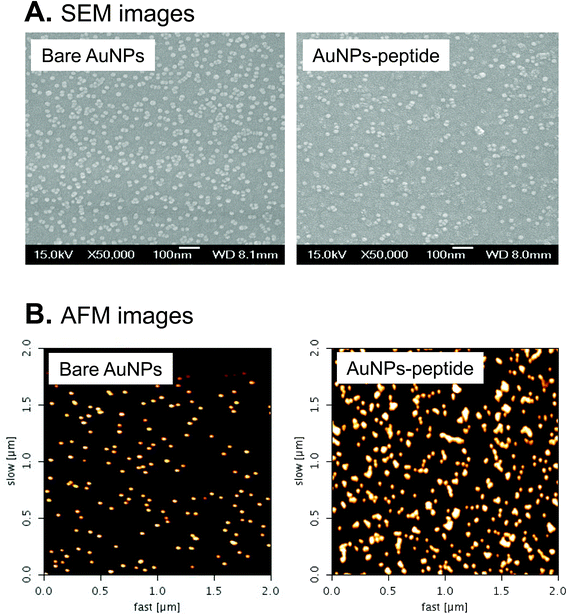
The 15–17 nm AuNPs were synthesized by citrate reduction method in this study. The original OD520 of the as-synthesized bare AuNPs was around 2; the OD520 was adjusted to about 1.0 for further peptide modification (Fig. 1A). Spectra of the as-synthesized AuNPs were recorded by a UV spectrophotometer, and showed the SPR peak at 520 nm. The size and morphology of the as-synthesized AuNPs were examined by DLS and microscopy techniques. After conjugation of peptides onto AuNPs, the wavelength of maximum absorption shifted to a longer wavelength with respect to that of AuNPs (from 520 to 525 nm) as a result of the capping of AuNPs surface with peptide molecules (Fig. 1A). Fig. 1B and C show that the average hydrodynamic diameters of bare AuNPs and AuNPs-peptide probes were about 16.1 nm and 20.5 nm, respectively. Sizes and morphologies of AuNPs and AuNPs-peptide were checked by scanning electron microscopy (SEM) (Fig. 2A) and atomic force microscopy (AFM) (Fig. 2B). To confirm the conjugation of peptide onto AuNPs, DTT-based displacement was used to permute the peptide conjugated onto AuNPs. The conjugation rate of the peptide onto AuNPs surface was generally >50% for each preparation of AuNPs-peptide probe.Gel electrophoresis analysis of AuNPs
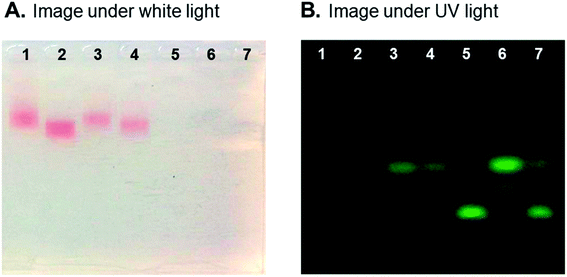
To study the morphology change of AuNPs after specific peptide modification and proteinase activation, the horizontal electrophoresis system was used to observe the change under white light and UV light. Fig. 3A shows different migration positions of bare AuNPs, AuNPs-peptide probe and the probe reacted with proteinase and proteinase inhibitor in white light. The observation under UV light (Fig. 3B) reveals that the pure peptide shows stronger excited fluorescence intensity than those modified onto AuNPs. The quenching effect of AuNPs is observed on lane 2 in Fig. 3B (AuNPs-peptide probe), and only slight fluorescence intensity appeared. However, significant fluorescence intensity was observed when AuNPs-peptide probe reacted with chymase (lane 3 in Fig. 3B). In addition, fluorescence intensity of lane 3 was stronger than the fluorescence intensity of lane 4, indicating that the chymase inhibitor indeed worked effectively.Optimal reaction conditions of AuNPs-peptide probe
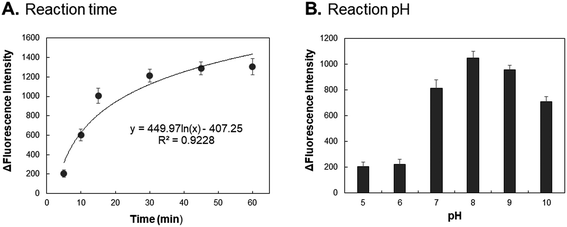
Fig. 4A shows the AuNPs-peptide probe (1.0 nM) incubated with 100 ng mL−1 chymase for different times (5, 10, 15, 30, 45, and 60 min) at 37 °C and pH 8.0. With incubation time of 15 min, the increase in fluorescence intensity was about 1100-fold. However, with the incubation time longer than 15 min, the fluorescence intensity does not increase significantly. Fig. 4B shows the increased fluorescence intensity of AuNPs-peptide probe (1.0 nM) incubated with 100 ng mL−1 chymase at different pH values (5 to 10) for 15 min at 37 °C. The highest activity was detected at pH 8, indicating that pH 8 is the optimal pH condition for incubation. Therefore, the results indicate that the optimal reaction conditions for AuNPs-peptide probe treated with chymase are 37 °C for 15 min at pH 8.Chymase activity assay by AuNPs-peptide probe
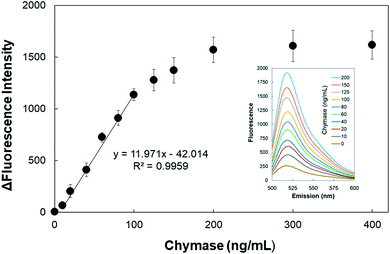
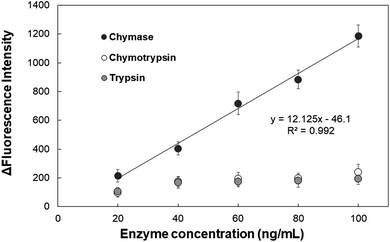
The detection limit of the AuNPs-peptide probe was tested by incubating the probe with various concentrations of chymase (0, 10, 20, 40, 60, 80, 100, 125, 150, 200, 300, and 400 ng mL−1) for 15 min at 37 °C and pH 8.0. Fig. 5 shows the clear linear correlation between 10 and 100 ng mL−1 chymase, for which y = 11.971x − 42.014 and R2 = 0.9959. Additionally, the detection limit of the AuNPs-peptide probe was calculated to be about 5 ng mL−1 (signal/background noise (S/N) ≥ 3).Specificity test was performed using other serine proteinases, namely, chymotrypsin and trypsin. AuNPs-peptide probe was incubated with various concentrations of proteinases (20, 40, 60, 80, and 100 ng mL−1) for 15 min at 37 °C and pH 8.0. The results in Fig. 6 show that fluorescence intensity significantly increases only after incubation with chymase. The increment in fluorescence intensity of AuNPs-peptide probe incubated with chymase increased was about 1250-fold. However, the increment in fluorescence intensities of AuNPs-peptide probe incubated with chymotrypsin and trypsin was not significant.
Chymase inhibition assay with AuNPs-peptide probe
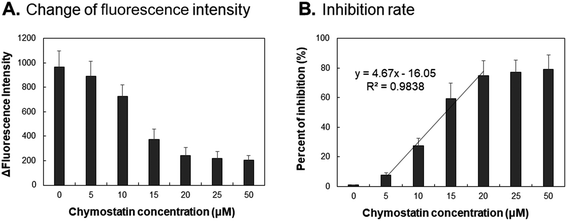
To study the inhibitory effect of chymase, the chymase inhibitor chymostatin was used in this experiment. AuNPs-peptide probe was incubated with 80 ng mL−1 chymase and various concentrations of chymostatin (0, 5, 10, 15, 20, 25 and 50 μM) for 15 min at 37 °C and pH 8.0. The results in Fig. 7A show that 80 ng mL−1 chymase was significantly inhibited by 15 μM chymostatin. However, Fig. 7B shows that only 80% chymase activity could be inhibited even when a high concentration of chymostatin (50 μM) was added. The calculated IC50 value was approximately 12.5 μM of chymostatin for inhibition of chymase activity.Detection of chymase activity in kidney tissue
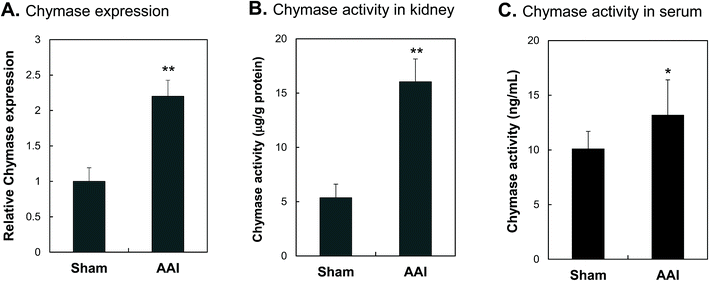
Animal study of AAI-induced kidney injury was performed; urine, serum, and kidney tissue were sampled for observing the development of progressive nephropathic disease. The levels of serum creatinine were significantly increased in mice with AAI administration. Increased urine protein and serum BUN levels were also observed in mice after AAI treatment (ESI Fig. S2†). In the kidney tissue, significantly infiltrating inflammatory cells, intrarenal fibrosis and severe interstitial tissue damage in AAI treated mice were observed (ESI Fig. S3†). These results indicate that nephropathy of mice was successfully induced by AAI administration. Increased renal chymase activity in AAI-treated mice was detected along with the increased chymase expression in the kidney tissue. Renal chymase protein expression (Fig. 8A), chymase activity in kidney (Fig. 8B) and chymase activity in blood (Fig. 8C) displayed 2.2-, 3.0- and 1.3-fold increase, respectively, in mice treated with AAI compared with those in the Sham control group.Discussion
In this study, we successfully constructed a self-assembled AuNPs fluorescent peptide probe (AuNPs-peptide probe), which comprises a specific fluorophore (FITC-labeled) peptide and a quencher (AuNPs).9,30 The detection time of this AuNPs-peptide probe for activity detection of chymase is only 15 min, and a linear correlation from 10 to 100 ng mL−1 of chymase was acquired. Moreover, the detection limit of the AuNPs-peptide probe is about 5 ng mL−1. The detection sensitivity is comparable to those of a label-free fluorometric detection of chymotrypsin activity using AuNPs, graphene oxide/DNA-stabilized silver nanoclusters, and 1,8-naphthalimide-based ratiometric fluorescence probe.7,31,32AuNPs with size of around 10–20 nm and having potentially high quenching ability were applied to conjugate with the designed fluorescent peptide probe.6–8 Length and charge of the peptide were considered based on the negatively charged surface of the citrate-capped AuNPs.7,33 It is well known that conjugating with adequate ligands can improve the stability of AuNPs, and the stabilizing effect can be increased with the increase in length of the peptide. However, longer peptides may be broken easily, causing increased background for detection. Suitable length and charge are needed for stability and sensitivity of AuNPs-peptide probe. Moreover, the length of substrate sequence and hydrophobicity may affect the efficiency of target hydrolysis and the stability of peptide conjugation with AuNPs.6,8
In the design of AuNPs-peptide probe, the desired peptides usually comprise an anchoring group to conjugate to AuNPs surface, a spacing group to enhance the signals of detection, a backbone (usually the substrate sequence), and a terminal functional group (such as fluorophores).15 The thiol group has strong affinity with AuNPs and cysteine (C) is most commonly used to conjugate with AuNPs.16,31 As evidenced by the results of our previous study,7 the spacing group of a designed peptide can significantly enhance the detection sensitivity. Five negatively charged amino acid molecules, namely aspartic acid (D) molecules, conjugated onto the AuNPs colloid, could increase the stability of the peptide-capped AuNPs and avoid AuNPs aggregation by increasing electrostatic repulsion between the peptides.13,33 Moreover, negative charge on the spacer peptide could allow a well packed layer of peptides on the AuNP surface to increase enzyme access to the cleavage site.
Electrophoresis of agarose gel is a useful tool to easily monitor the AuNPs modified with biological molecules, such as nucleic acids, antibodies and proteins.34–36 Based on the negatively charged AuNPs and peptide, the results of gel electrophoresis showed that migration of the peptide sequence cleaved by chymase was shorter than that of the original peptide (Fig. 3). Mobility of citrate-capped AuNPs increased upon modification with negatively charged peptides (AuNPs-peptide probe). The predicted cleavage site in the original peptide was Phe (F)-|-His (H), which divided the peptide into two. Without the negatively charged spacer, the remaining peptide, whose charge increased but was still negative, migrated a shorter distance compared with the original peptide. The quenching ability of AuNPs was also observed in this experiment. The original peptide conjugated onto AuNPs without enzyme catalysis did not show a fluorescence band in the gel.
Overall peptide charge is also considered based on the Derjaguin–Landau–Verwey–Overbeek (DLVO) theory. This theory describes the stability of nanoparticles in a suspension depending on surface charge and the effects of electrostatic repulsion and van der Waals attraction forces between nanoparticles.37,38 The double layer of counter ions formed results from the surface charge of nanoparticles, which prevents aggregation between nanoparticles. It is found that only negatively charged peptides modified onto AuNPs remain stable because the surface charge of AuNPs synthesized by citrate method is negative.38,39 Modifying cationic peptides onto AuNPs causes aggregation due to the bridging effect with citrate ions.40
In order to investigate the practicability in experimental as well as clinical studies, we used the as-synthesized AuNPs-peptide probe to detect chymase activity in kidney tissue of experimental animals. Though the detectable range of chymase was only from 10 to 100 ng mL−1, it was sufficient for us to detect chymase activity in kidney tissue. The AuNPs-peptide probe could also be used to detect chymase activity of various visceral tissue homogenates and blood (ESI Table S2†). Normal renal chymase activity was about 5 μg g−1 protein of tissue homogenate and 10 ng mL−1 of blood, and chymase activity in kidney tissue and blood significantly increased in the mice treated with AAI. The physiological and biochemical determinations indicated that nephropathy was induced in mice treated with AAI. In kidney tissue sections, high amounts of inflammatory cells and fibrosis in interstitial tissue were observed. Most importantly, there was significantly increased chymase activity in kidney tissues of AAI-treated mice. The present results demonstrate that renal chymase might play an important role in ACE-independent Ang II generation in nephropathy progression.19–21 Additionally, we have established a useful and sensitive method to detect cellular and tissue chymase activity, which is desirable given the multifunctional role of chymase in acute and chronic tissue injury as well as remodeling of human diseases.41
Conclusion
In this study, an AuNPs-based fluorescence peptide probe was successfully synthesized and applied in detection of chymase activity in kidney tissue. The peptide was designed to be negatively charged for stability. Due to the negative surface charge of citrate-synthesized AuNPs, negatively charged peptides could prevent the aggregation between AuNPs and decrease the spatial barrier for enzyme catalyzation. Increased length of peptide enhances the fluorescence signal and increases stability. Moreover, the negatively charged spacer has been proved more suitable than a positively charged or neutral spacer. Furthermore, the established biosensing strategy can be extended to other proteinases by use of different peptide substrates, i.e., by changing the substrate sequence of amino acids. Thus, the technique of AuNPs-peptide probe can be applied for several purposes, such as drug targeting methodology and diagnosis of diseases.Author contributions
H. F. and Y. L. prepared the article and discussed the experimental data. F. Y. and I. H. performed the laboratory and animal experiments. C. C. and C. S. designed the study and supervised the project, and reviewed the article.Conflicts of interest
The authors declare no competing financial interest.Acknowledgements
This work was supported by the grant of MOST 104-2313-B-009-001-MY3 and MOST 107-2313-B-009-002-MY3 from the Ministry of Science and Technology (MOST), Taiwan. This work was supported by the grant of MMH-CT-10702 from the Hsinchu Mackay Memorial Hospital, Taiwan. This work was also financially supported by the “Center For Intelligent Drug Systems and Smart Bio-devices (IDS2B)” from The Featured Areas Research Center Program within the framework of the Higher Education Sprout Project of the National Chiao Tung University and Ministry of Education (MOE), Taiwan.References
- J. Wolfram, M. Zhu, Y. Yang, J. Shen, E. Gentile, D. Paolino, M. Fresta, G. Nie, C. Chen, H. Shen, M. Ferrari and Y. Zhao, Curr. Drug Targets, 2015, 16, 1671–1681 CrossRef PubMed.
- M. Rai, A. P. Ingle, S. Birla, A. Yadav and C. A. Santos, Crit. Rev. Microbiol., 2016, 42, 696–719 CrossRef PubMed.
- Q. Liu, N. Li, M. Wang, L. Wang and X. Su, Anal. Chim. Acta, 2018, 1013, 71–78 CrossRef PubMed.
- H. Jans and Q. Huo, Chem. Soc. Rev., 2012, 41, 2849–2866 RSC.
- L. Nie, F. Liu, P. Ma and X. Xiao, J. Biomed. Nanotechnol., 2014, 10, 2700–2721 CrossRef PubMed.
- H. Y. Hu, S. Gehrig, G. Reither, D. Subramanian, M. A. Mall, O. Plettenburg and C. Schultz, Biotechnol. J., 2014, 9, 266–281 CrossRef PubMed.
- F. Y. Yeh, I. H. Tseng, S. H. Chuang and C. S. Lin, RSC Adv., 2014, 4, 22266–22276 RSC.
- Q. Wang, W. Hu, Q. Feng, X. H. Cao, W. Chai, C. Yi and M. J. Li, RSC Adv., 2015, 5, 43824–43830 RSC.
- Principles of Fluorescence Spectroscopy, ed. J. R. Lakowicz, Springer Science & Business Media, 2013, pp. 443–475 Search PubMed.
- J. Shi, C. Chan, Y. Pang, W. Ye, F. Tian, J. Lyu, Y. Zhang and M. Yang, Biosens. Bioelectron., 2015, 67, 595–600 CrossRef PubMed.
- Y. H. Lin, S. H. Chen, Y. C. Chuang, Y. C. Lu, T. Y. Shen, C. A. Chang and C. S. Lin, Biosens. Bioelectron., 2008, 23, 1832–1837 CrossRef PubMed.
- Y. C. Chuang, W. T. Huang, P. H. Chiang, M. C. Tang and C. S. Lin, Biosens. Bioelectron., 2012, 32, 24–31 CrossRef PubMed.
- G. Chen, Y. Xie, H. Zhang, P. Wang, H. Y. Cheung, M. Yang and H. Sun, RSC Adv., 2014, 4, 6560–6563 RSC.
- D. Aili, K. Enander, J. Rydberg, I. Nesterenko, F. Björefors, L. Baltzer and B. Liedberg, J. Am. Chem. Soc., 2008, 130, 5780–5788 CrossRef PubMed.
- E. Oh, K. Susumu, A. J. Mäkinen, J. R. Deschamps, A. L. Huston and I. L. Medintz, J. Phys. Chem. C, 2013, 117, 18947–18956 CrossRef.
- X. Liu, M. Marrakchi, D. Xu, H. Dong and S. Andreescu, Biosens. Bioelectron., 2016, 80, 9–16 CrossRef PubMed.
- S. Park, B. J. Bivona, S. M. Jr Ford, S. Xu, H. Kobori, L. de Garavilla and L. M. Harrison-Bernard, Hypertension, 2013, 61, 465–471 CrossRef PubMed.
- J. N. Lorenz, Am. J. Physiol.: Renal, Fluid Electrolyte Physiol., 2010, 298, F35–F36 Search PubMed.
- X. R. Huang, W. Y. Chen, L. D. Truong and H. Y. Lan, J. Am. Soc. Nephrol., 2003, 7, 1738–1747 CrossRef.
- Y. Konishi, T. Morikawa, N. Okada, I. Maeda, C. Kitabayashi, K. Yoshioka, M. Okumura, A. Nishiyama, M. Ueda, S. Takai, M. Miyazaki and M. Imanishi, Hypertens. Res., 2008, 8, 1517–1524 CrossRef PubMed.
- P. C. Cristovam, A. K. Carmona, C. P. Arnoni, E. Maquigussa, L. G. Pereira and M. A. Boim, Exp. Biol. Med., 2012, 8, 985–992 CrossRef PubMed.
- Y. Li, L. Zhou, F. Liu, Y. Peng, J. Li, L. Sun, S. Duan, G. Ling, X. Chen, W. Jiang and Y. Xia, Kidney Blood Pressure Res., 2010, 33, 240–248 CrossRef PubMed.
- H. Wasse, N. Naqvi and A. Husain, Curr. Hypertens. Rev., 2012, 8, 15–23 CrossRef PubMed.
- M. N. Greco, M. J. Hawkins, E. T. Powell, H. R. Jr Almond, L. de Garavilla, J. Hall, L. K. Minor, Y. Wang, T. W. Corcoran, E. Di Cera, A. M. Cantwell, S. N. Savvides, B. P. Damiano and B. E. Maryanoff, J. Med. Chem., 2007, 50, 1727–1730 CrossRef PubMed.
- Y. Soga, S. Takai, T. Koyama, Y. Okamoto, T. Ikeda, K. Nishimura, M. Miyazaki and M. Komeda, J. Thorac. Cardiovasc. Surg., 2004, 127, 72–78 CrossRef PubMed.
- K. Fujimi, Y. Uehara, S. Abe, A. Kawamura, S. Devarajan, S. Miura, K. Saku and H. Urata, Hypertens. Res., 2010, 33, 149–154 CrossRef PubMed.
- Y. C. Chuang, J. C. Li, S. H. Chen, Y. U. Liu, C. H. Kuo, W. T. Huang and C. S. Lin, Biomaterials, 2010, 31, 6087–6095 CrossRef PubMed.
- D. H. Tsai, M. P. Shelton, F. W. DelRio, S. Elzey, S. Guha, M. R. Zachariah and V. A. Hackley, Anal. Bioanal. Chem., 2012, 404, 3015–3023 CrossRef PubMed.
- Y. H. Hung, W. Y. Hsieh, J. S. Hsieh, F. C. Liu, C. H. Tsai, L. C. Lu, C. Y. Huang, C. L. Wu and C. S. Lin, Int. J. Biol. Sci., 2016, 12, 454–465 CrossRef PubMed.
- E. Dulkeith, M. Ringler, T. A. Klar, J. Feldmann, A. Munoz Javier and W. J. Parak, Nano Lett., 2005, 5, 585–589 CrossRef PubMed.
- S. Li, Y. Fu, X. Ma and Y. Zhang, Biosens. Bioelectron., 2017, 88, 210–216 CrossRef PubMed.
- Y. Chen, J. Cao, X. Jiang, Z. Pan and N. Fu, Sens. Actuators, B, 2018, 273, 204–210 CrossRef.
- J. A. Tullman, W. F. Finney, Y. J. Lin and S. W. Bishnoi, Plasmonics, 2007, 2, 119–127 CrossRef.
- S. H. Chen, K. I. Lin, C. Y. Tang, S. L. Peng, Y. C. Chuang, Y. R. Lin, J. P. Wang and C. S. Lin, IEEE Trans. Nanobioscience, 2009, 8, 120–131 Search PubMed.
- F. Y. Yeh, T. Y. Liu, I. H. Tseng, C. W. Yang, L. C. Lu and C. S. Lin, Biosens. Bioelectron., 2014, 61, 336–343 CrossRef PubMed.
- Y. C. Chuang, W. T. Huang, P. H. Chiang, M. C. Tang and C. S. Lin, Biosens. Bioelectron., 2012, 32, 24–31 CrossRef PubMed.
- B. Derjaguin and L. Landau, Prog. Surf. Sci., 1993, 43, 30–59 CrossRef.
- K. D. Lee, S. Nir and D. Papahadjopoulos, Biochemistry, 1993, 32, 889–899 CrossRef PubMed.
- Ş. Kalay, C. Blanchet and M. Culha, Turk. J. Chem., 2014, 38, 686–700 CrossRef.
- Ž. Krpetić, P. Nativo, F. Porta and M. Brust, Bioconjug. Chem., 2009, 20, 619–624 CrossRef PubMed.
- L. J. Dell'Italia, J. F. Collawn and C. M. Ferrario, Circ. Res., 2018, 122, 319–336 CrossRef PubMed.
Footnotes |
| † Electronic supplementary information (ESI) available. See DOI: 10.1039/c8ra04322a |
| ‡ These authors contributed equally to the manuscript. |
| This journal is © The Royal Society of Chemistry 2018 |

