 Open Access Article
Folate-targeted selenium nanoparticles deliver therapeutic siRNA to improve hepatocellular carcinoma therapy†
Yu Xia,
Mingqi Zhao,
Yi Chen,
Liang Hua,
Tiantian Xu,
Changbing Wang,
Yinghua Li and
Bing Zhu *
*
Virus Laboratory, Guangzhou Institute of Paediatrics, Guangzhou Women and Children’s Medical Center, Guangzhou Medical University, Guangzhou 510120, China
First published on 19th July 2018
Abstract
To obtain a tumor targeting siRNA delivery vehicle for hepatocellular carcinoma treatments, functionalized selenium nanoparticles, Se–PEI–FA, were first prepared by decorating selenium nanoparticles with polycationic polymers, polyethylenimine (PEI), linked with folic acid (FA). FA functions as the tumor-targeted molecule to enhance tumor targeting activity, and PEI conjugates FA and siRNA. Se–PEI–FA@siRNA entered HepG2 cells principally via clathrin-mediated endocytosis. Due to the active tumor targeting effectiveness of FA, Se–PEI–FA@siRNA has significantly higher cellular uptake and gene silencing efficiency, and more apparent cytotoxicity, in HepG2 cells compared with Se–PEI@siRNA. The silencing of HES5 by Se–PEI–FA@siRNA could induce HepG2 cells arrest at G0/G1 phase possibly via inhibiting protein expression of CDK2, cyclinE, and cyclinD1, and up-regulating the protein expression of p21. More importantly, Se–PEI–FA@siRNA exhibits more significant antitumor efficacy compared with Se–PEI@siRNA in vivo. Additionally, Se–PEI–FA@siRNA exhibits low toxicity to the important organs of tumor-bearing mice. This research provides an effective strategy for the design of tumor-targeted nanodrugs against hepatocellular carcinoma.
Introduction
Hepatocellular carcinoma (HCC) is one of the most prevalent malignancies and has become the third main cause of cancer death.1 Due to the high tumor recurrence rates and low percentage of HCC patients who are suitable for operative treatments, chemotherapy still remains one of the most common approaches for most HCC patients.2 A large number of traditional chemotherapy drugs (doxorubicin, paclitaxel, 5-fluorouracil and so on) have been used in clinical cancer treatments, but most have been proven to be ineffective.3,4 In the past decade, small interfering RNA (siRNA) technology has attracted attention due to its improved anticancer efficacy and low cytotoxicity towards healthy cells.5,6 Traditionally viruses are used as gene vectors.7 However, virus-like vectors are easily prone to insertional mutagenesis and immunogenicity.8 Thus non-viral gene vectors exhibit tremendous potential for safer gene therapy.9 The ideal non-viral vector should have advantages such as good biocompatibility, small size below 200 nm, good stability and so on. Cationic polymers such as polyethylenimine, polylysine and dendrimers, which complex and condense negatively charged DNA into small nanoparticles for gene delivery, are some of the most studied non-viral vectors.10–12Selenium nanoparticles (SeNPs) have attracted increased attention in cancer therapy.13–15 SeNPs as a gene delivery vector exhibited some advantages, for example they have easily regulated size, controlled release, low cytotoxicity and enhanced anticancer efficacy.16–18 Previous literature demonstrates that SeNPs can conjugate with siRNA to obtain improved anticancer efficacy.19,20 However, some deficiencies should be improved, such as the lack of tumor-targeting ability.21,22 In tumor-targeted delivery systems, folic acid (FA) is used as a tumor targeting moiety because of its high affinity to folate receptors, which are overexpressed in many tumors, including liver cancer.23 In addition, the polycationic polymer, polyethylenimine (PEI), with positive charge was conjugated with SeNPs so that siRNA could be loaded.24
HES5 as a DNA-binding transcription factor is able to inhibit the transcription of Hash1, and repress the differentiation of cells.25 Previous research shows that HES5 plays a crucial role in the initiation/development of various cancers, and has become an important therapeutic target in cancer therapy.26 Thus, in this study, HES5-siRNA was linked to the surface of SeNPs modified with PEI and FA, Se–PEI–FA@siRNA, which could silence HES5 genes to inhibit the growth of tumors (Scheme 1). As expected, Se–PEI–FA@siRNA accumulates in tumor sites, and provides enhanced gene silencing ability and antitumor activity. Therefore, SeNPs delivering HES5-siRNA holds great potential in HCC treatments.
Materials and methods
Materials
PEI with a molecular weight of 25 kDa, ascorbic acid (vitamin C, Vc), sodium selenite (Na2SeO3) and FA were purchased from Guangzhou Chemical Reagent Factory (Guangzhou, China). Cy5.5 and TUNEL assay kits were purchased from Beyotime Biotechnology (Shanghai, China). siRNA was acquired from Ribobio Co., Ltd (Guangzhou, China), and the sequence of HES5-siRNA was shown as 5′-AAGGCTACTCGTGGTGCCT-3′. All antibodies were purchased from Cell Signaling Technology (Massachusetts, US).Synthetic scheme of Se–PEI–FA@siRNA
FA was conjugated to SeNPs using PEI that contains a free primary amine. Briefly, 4 mM of ascorbic acid was doped into 1 mM of sodium selenite at the same volume under magnetic stirring for 2 h to fabricate SeNPs. 0.001% PEI (MW-25 kDa) solution was reacted with SeNP solution overnight to give a Se–PEI nanoparticles solution. FA was activated by reacting 1 mL of 0.1 M FA with 0.2 M EDC solution at pH 5.5 for 30 min at room temperature to prepare amine reactive succinimidyl ester. Then 0.5 mL of NHS (0.5 M) solution was dropped to the EDC–FA solutions and then reacted for 6 h. Then Se–PEI was reacted with the amine reactive FA–NHS ester for 2 h to obtain the stable amide bond that contributed to the formation of Se–PEI–FA nanoparticles. Se–PEI–FA@siRNA nanoparticles were then prepared according to the following protocol: Se–PEI–FA was dissolved with DNase/RNase-free water, and subsequently vortexed with solution containing the siRNA for 1 h to prepare Se–PEI–FA@siRNA complexes. The acquired nanoparticles were characterized by FTIR and TEM. EDX was used to determine the elemental composition. The potential and average size of various nanoparticles was examined by a Zetasizer APS analyzer (Malvern Instrument Ltd., UK).The calibration curve about FAM-siRNA was established to determine the loading capability of siRNA. The tests were carried out using a multimode plate reader (Ex, 465 nm; Em, 520 nm). The loading contents and efficiency of siRNA were calculated as reported before.6
Gel electrophoresis assay
Se–PEI–FA@siRNA nanoparticles with various weight rates of Se–PEI–FA/siRNA were prepared. Then Se–PEI–FA@siRNA complexes were added to 1% agarose gel electrophoresis at 120 mV, after 15 min gel imaging was obtained using a UV gel imaging system. The electrophoretic migration assay of Se–PEI–FA@siRNA complexes was performed to test whether Se–PEI–FA was capable of protecting siRNA under conditions containing FBS.Cell lines and cultures
The cells (HepG2 and Lo2 cells) were obtained from the ATCC and cultured in DMEM media with 10% FBS at 37 °C in 5% CO2 atmosphere.Study of cellular uptake
HepG2 cells at density 4 × 10⁴ cells per well were incubated in a 24-well plate for 12 h. Then the HepG2 cells were exposed to various formulations of siRNA loaded with FAM at the siRNA dose of 100 nM for 4 h. Subsequently the cells were washed with cold PBS and observed using fluorescence microscope. The quantitative cellular uptake was tested using a flow cytometer.The cellular uptake mechanism of Se–PEI–FA@siRNA
The cellular uptake of Se–PEI–FA@siRNA in the presence of different uptake inhibitors was determined in HepG2 cells that were incubated without inhibitors for 30 min at 4 °C or with 3 mg mL−1 NaN3 + 50 mM 2-deoxy-D-glucose (DOG), amiloride (10 μg mL−1), chlorpromazine (5 μg mL−1) and nystatin (5 μg mL−1) in serum-free media for 30 min at 37 °C. Then, Se–PEI–FA@FAM-siRNA was added to the media and incubated for another 2 h. The cells were washed with PBS and tested using flow cytometry.Quantitative real-time PCR (qPCR)
The expression levels of mRNA were determined by qPCR. The HepG2 cells were seeded in a six-well plate to reach about 70% confluence and subsequently transfected by various formulations of siRNA at 100 nM siRNA concentrations for 48 h. Then, the total cell RNA was extracted using TRIzol® reagent. The concentrations of RNA were tested using a NanoDrop™ 1000 Spectrophotometer. The StepOne™ PCR System was used to analyze the data using the 2−(ΔΔCT) method. The sequences of primer are as follows: forward 5′-GGAATTCCAATGGCCCCCAGCACTGTG-3′ and reverse 5′-GGGTACCCCACGGCCACAGTGCTGG-3′ for HES5; and forward 5′-ATCCCATCACCATCTTCCAG-3′ and reverse 5′-ATGAGTCCTTCCACGATACC-3′ for glyceraldehyde 3-phosphate dehydrogenase.MTT assay
The cytotoxicity was tested by MTT. The cells were cultured in a 96-well plate to reach 60% confluence and subsequently exposed to various formulations of siRNA at different concentrations for 48 h. Further treatment was performed according to the reported literature.4Flow cytometer analysis
Flow cytometry was utilized to detect cell cycle distribution and cell apoptosis. In brief, HepG2 cells were cultured in a 12-well plate overnight to reach about 50% confluence. After that, the various formulations of siRNA at 100 nM were added to the cells, respectively, and then incubated for 24 h. The cells were washed with PBS and collected for staining with PI or annexin V/PI for 0.5 h, and finally were detected using a flow cytometer (BD Bioscience, San Jose, CA, USA).Western blot analysis
The protein expressions were tested by western blot assay. HepG2 cells were seeded in a 6-well plate and incubated to reach about 70% confluence, and then exposed to Se–PEI–FA@siRNA at various siRNA concentrations for 24 h. After that, the cells were harvested and prepared for further tests as previously reported.27In vivo imaging of nanoparticles
The animal experiments were approved by the Ethics Committee of Guangzhou Medical University and carried out on the basis of the guidelines of the Experimental Animal Center of Guangzhou Medical University. Female BALB/c nude mice (5 weeks old age) were obtained from Guangdong Medical Laboratory Animal Center and were fed in the Experimental Animal Center of Guangzhou Medical University. HepG2 cells (0.2 mL saline at the cell density of 5 × 10⁷ cells per mL) were subcutaneously injected in the abdomens of mice. The mice were intravenously injected with Se–PEI–FA@cy5.5-siRNA or Se–PEI@cy5.5-siRNA (0.5 mg kg−1 siRNA equivalent dose) when the tumors grew to ∼300 mm3. After 6 h of intravenous injection, the fluorescence imaging of the tumors and organs of mice were photographed using an IVIS imaging system.Xenograft mouse model
BALB/c nude mice (5–6 weeks old age) were applied to study the antitumor efficacy in vivo. HepG2 cells (1 × 10⁷ cells/150 μL) were subcutaneously injected in the abdomens of mice. The mice were randomly divided into four groups after the volume of tumors grew up to ∼100 mm3. Saline (control group) and various formulations of siRNA (0.5 mg kg−1 siRNA equivalent dose) were intravenously injected into the tumor-bearing mice once every other day. The volume of tumors were calculated by the formula,The tissues of tumors and main organs were fixed (3.7% paraformaldehyde), and then the tissues were sectioned into 6 μm slices. Histologic sections were prepared for hematoxylin and eosin (H&E) staining. The imaging of sections were photographed by a Leica DMi8 digital microscope.
Statistical analysis
All the data represented mean ± standard deviations (S.D.). The statistical differences between two groups were analyzed via Student’s t-test. The differences were judged to be significant and highly significant at *p < 0.05 and **p < 0.01, respectively.Results and discussion
The characterization of nanoparticles
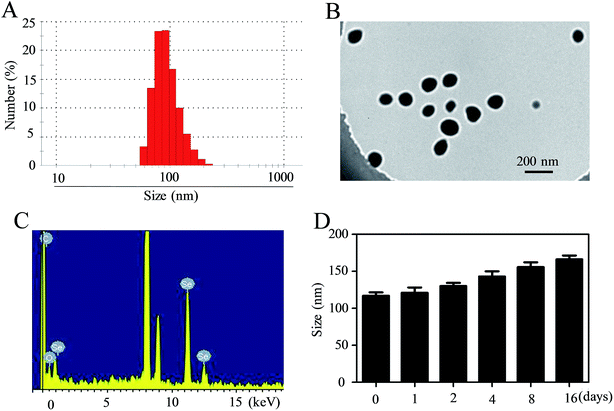
In this tumor-targeted delivery system, selenite was reduced to selenium via redox reaction and the Se atom gradually accumulated to form SeNPs. The functionalized SeNPs, Se–PEI–FA, were fabricated by modifying SeNPs with PEI that was conjugated with FA. The Se–PEI–FA nanoparticles were characterized by TEM, EDX and Nano ZS particle analyzer. As shown in Fig. 1A, the average size of Se–PEI–FA nanoparticles was ∼115 nm. The TEM image further shows that Se–PEI–FA shows good monodisperse nanoparticles with small size ranges of 70 nm to 130 nm (Fig. 1B). The obvious signals of C atom and O atom were observed, indicating that FA was conjugated to the SeNPs (Fig. 1C). Furthermore, the size distribution of the Se–PEI–FA nanoparticles stayed stable (<180 nm) after 16 days (Fig. 1D). The advantageous stability of Se–PEI–FA nanoparticles supports their potential application in the field of nanomedicine.Evaluation of siRNA loading ability and serum stability
The zeta potential of the nanoparticles are shown in Fig. 2A, the potential of SeNPs changed from about −20.3 mV to +19.4 mV after PEI was conjugated onto their surfaces, which is favourable for the loading of negatively charged siRNA. Gel electrophoresis was further performed to test the siRNA loading capacity of Se–PEI–FA nanoparticles. Complete siRNA migration retardation was observed at Se–PEI–FA/siRNA weight rate of 8![[thin space (1/6-em)]](https://www.rsc.org/images/entities/char_2009.gif) :
:![[thin space (1/6-em)]](https://www.rsc.org/images/entities/char_2009.gif) 1 (Fig. 2B), indicating that Se–PEI–FA nanoparticles could bind siRNA to block degradation. RNAse in serum could cause degradation of siRNA, therefore good stability of siRNA in serum is very crucial for enhancing the intracellular transfection efficiency of siRNA.28 In order to evaluate the ability of Se–PEI–FA nanoparticles to protect siRNA from degradation, Se–PEI–FA@siRNA was incubated in the media containing 50% FBS, then the stability of Se–PEI–FA@siRNA in serum was determined using a gel retardation experiment. Fig. S1† shows that naked siRNA degraded after 1 h of incubation in the media containing 50% FBS and complete degradation of the naked siRNA was observed after incubation for 4 h. However, siRNA from Se–PEI–FA@siRNA was significantly protected after 1 h incubation under the same conditions. After 2 h of incubation, a small amount of siRNA was released from Se–PEI–FA@siRNA nanoparticles. This finding indicates that the Se–PEI–FA is capable of providing effective protection of the siRNA from nuclease-mediated degradation.
1 (Fig. 2B), indicating that Se–PEI–FA nanoparticles could bind siRNA to block degradation. RNAse in serum could cause degradation of siRNA, therefore good stability of siRNA in serum is very crucial for enhancing the intracellular transfection efficiency of siRNA.28 In order to evaluate the ability of Se–PEI–FA nanoparticles to protect siRNA from degradation, Se–PEI–FA@siRNA was incubated in the media containing 50% FBS, then the stability of Se–PEI–FA@siRNA in serum was determined using a gel retardation experiment. Fig. S1† shows that naked siRNA degraded after 1 h of incubation in the media containing 50% FBS and complete degradation of the naked siRNA was observed after incubation for 4 h. However, siRNA from Se–PEI–FA@siRNA was significantly protected after 1 h incubation under the same conditions. After 2 h of incubation, a small amount of siRNA was released from Se–PEI–FA@siRNA nanoparticles. This finding indicates that the Se–PEI–FA is capable of providing effective protection of the siRNA from nuclease-mediated degradation.
Studies of cellular uptake
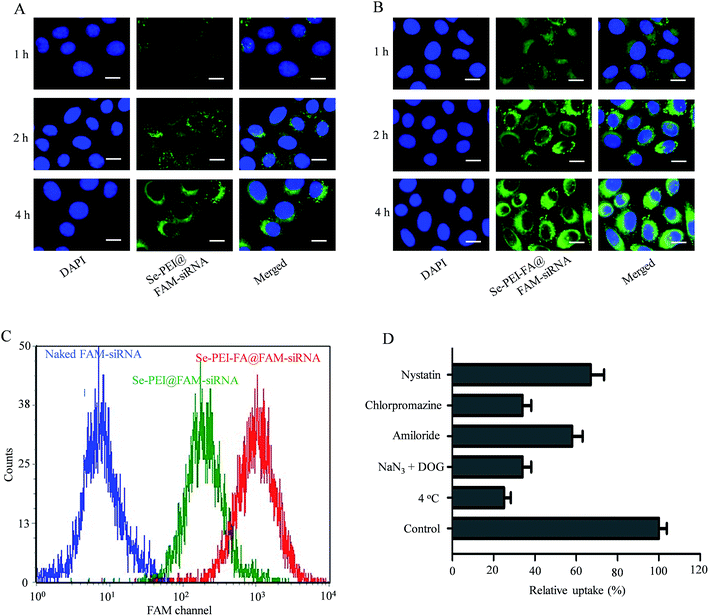
siRNA delivery efficiency is closely related to cellular uptake. High cellular uptake of siRNA usually results in effective gene silencing. Herein, the cellular uptake of active tumor-targeting nanoparticles Se–PEI–FA@FAM-siRNA, and passive tumor-targeting nanoparticles Se–PEI@FAM-siRNA, was investigated in HepG2 cells using a fluorescence microscope. Green fluorescence from FAM-siRNA was observed in HepG2 cells exposed to Se–PEI–FA@FAM-siRNA or Se–PEI@FAM-siRNA after 1 h incubation (Fig. 3A and B), suggesting that such nanoparticles could enter the cells irrespective of the active targeting moiety. The intensity of fluorescence in both Se–PEI–FA@FAM-siRNA- and Se–PEI@FAMsiRNA-treated groups increased as the incubation time prolonged to 4 h. Interestingly, exposure of the HepG2 cells to Se–PEI–FA@FAM-siRNA resulted in greater cellular uptake compared to Se–PEI@FAM-siRNA, presumably because of FA-mediated specific endocytosis. In order to accurately assess the cellular uptake efficiency of siRNA in various formulations of siRNA, HepG2 cells were exposed to naked FAM-siRNA (control group), Se–PEI–FA@FAM-siRNA and Se–PEI@FAM-siRNA at siRNA concentrations of 100 nM for 24 h, and the cellular uptake of the siRNA was tested using flow cytometry. As shown in Fig. 3C, the cells exposed to Se–PEI–FA@FAM-siRNA for 4 h exhibited stronger fluorescence intensity compared with the Se–PEI@FAM-siRNA group, indicating the Se–PEI–FA@FAM-siRNA have higher cellular uptake efficiency.Previous research indicates that nanoparticles can enter cells via energy-dependent endocytosis.29 Incubation of HepG2 cells at 4 °C pretreated with NaN3/2-deoxy-D-glucose (NaN3/DOG, cell energy metabolism inhibitors) markedly decreases the cellular uptake of nanoparticles (Fig. 3D), indicating that the endocytosis of Se–PEI–FA@siRNA nanoparticles is an active energy-dependent process. Different endocytosis inhibitors were used to research the cellular internalization mechanisms of the nanoparticles. Amiloride, chlorpromazine and nystatin are supposed to inhibit micropinocytosis endocytosis, clathrin-associated and caveolae-mediated cellular uptake, respectively. The cellular uptake of nanoparticles was decreased ∼41.4% and 33.2% after pretreating with amiloride and nystatin, respectively. Nevertheless, the cellular uptake of nanoparticles was decreased ∼65.2% after pretreatment with chlorpromazine, suggesting that the clathrin-mediated endocytosis route is crucial for cellular uptake of Se–PEI–FA@siRNA nanoparticles in HepG2 cells.
Silencing the HES5 gene
Se–PEI–FA was used to deliver siRNA into HepG2 cells to knock down the expression of HES5. The mRNA level of HES5 in HepG2 cells was evaluated using qPCR after 24 h transfection. As shown in Fig. 4A, Se–PEI–FA@siNC as a negative control failed to silence the expression of HES5, and Se–PEI@siRNA exhibited moderate inhibition of HES5 mRNA expression level. While Se–PEI–FA@siRNA obviously silenced the expression of HES5 in HepG2 cells.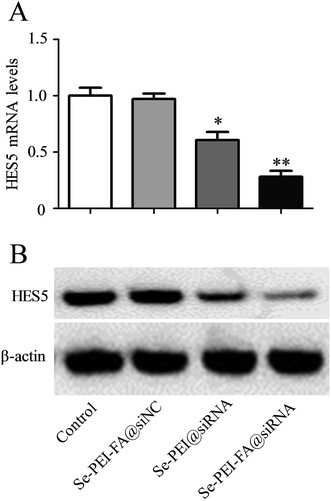 | ||
| Fig. 4 (A) Relative mRNA expression of HES5 was assessed by quantitative RT-PCR. (B) The expression level of HES5 protein was detected using western blotting assay. | ||
The protein level of HES5 was analyzed by western blot assay. Fig. 4B shows that delivery of HES5-siRNA by Se–PEI–FA provides higher activity to suppress the protein expression of HES5 in comparison with Se–PEI. Nevertheless, Se–PEI–FA@siNC did not exhibit obvious influence on the expression of HES5, indicating that no nonspecific gene silence occurred in such gene delivery system. The results of qPCR and western blot both demonstrate that Se–PEI–FA@siRNA is capable of silencing the expression of HES5.
Cellular cytotoxicity of the nanoparticles
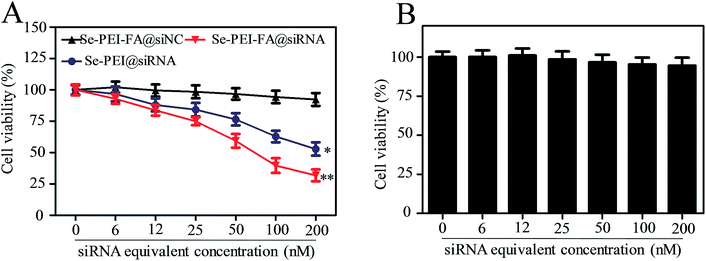
The cellular cytotoxicity of the nanoparticles against HepG2 cells and Lo2 cells was investigated using an MTT assay. As shown in Fig. 5A, the viability of HepG2 cells exposed to Se–PEI–FA@siNC remained at ∼91.9%, suggesting no nonspecific toxicity from such a gene delivery system. Cytotoxicity of Se–PEI–FA@siRNA nanoparticles on HepG2 cells was further analyzed at various siRNA doses, and Se–PEI–FA@siRNA exhibited significantly greater cytotoxicity in comparison to Se–PEI@siRNA, indicating Se–PEI–FA nanoparticles exhibit good advantages for use as gene delivery carriers. This result may be due to the higher cellular uptake of Se–PEI–FA@siRNA nanoparticles mediated by tumor-targeted FA. The cellular toxicity of Se–PEI–FA@siRNA against Lo2 cells (a normal liver cell) was assessed via MTT assay. As shown in Fig. 5B, the viability of Lo2 cells exposed to Se–PEI–FA@siRNA (200 nM siRNA equivalent dose) for 48 h remained about 94.6%, indicating low levels of toxicity and side effects.Flow cytometry studies
The cell cycle distribution of HepG2 cells after exposure to various formulations of siRNA were determined using flow cytometry. As shown in Fig. 6, cell populations at the S and G2/M phases were obviously reduced after the cell was exposed to the Se–PEI–FA@siRNA, meanwhile the Se–PEI–FA@siRNA-treatments resulted in a remarkable G0/G1 phase cycle arrest. Se–PEI–FA@siRNA nanoparticles exhibited a little higher activity on the cell cycle arrest in comparison with Se–PEI@siRNA. This study reveals that the silencing of HES5 may inhibit the proliferation of HepG2 cells by inducing the G0/G1 phase cell cycle arrest. | ||
| Fig. 6 Representative flow cytometry histograms of cell cycle analysis of HepG2 cells after incubation with various formulations of siRNA for 24 h. | ||
Western blotting analysis
CyclinD1 is highly expressed in various kinds of cancer cells and regulates the progression of cell cycles by G1/S restriction points.30 The activation of CDK2/cyclin E complexes can regulate the transition from G1 to S phases.31 p21 as a proliferation inhibitor plays one crucial role in the G1 arrest by inhibiting the activity of CDK–cyclin complexes.32 In order to investigate the antiproliferative mechanism of Se–PEI–FA@siRNA, the cell cycle-related protein levels of p21, cyclinD1, CDK2 and cyclinE in Se–PEI–FA@siRNA-treated HepG2 cells were determined by western blotting. As shown in Fig. 7, the protein levels of cyclinD1, CDK2 and cyclinE in the Se–PEI–FA@siRNA-treated cells were distinctly decreased, while the protein level of p21 slightly increased. The western blot results indicate that Se–PEI–FA@siRNA caused HepG2 cells to arrest at the G1 phase, possibly by inhibiting the protein expressions of cyclinD1, cyclinE, CDK2 and enhancing the protein level of p21.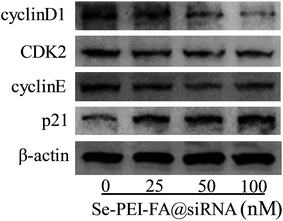 | ||
| Fig. 7 The protein expressions of cyclinD1, CDK2, cyclinE and p21 in HepG2 cells treated with Se–PEI–FA@siRNA. | ||
In vivo imaging of nanoparticles
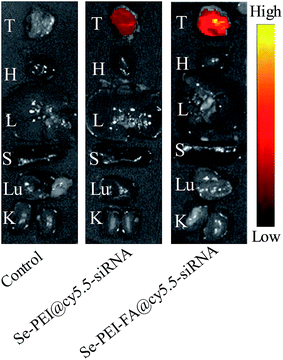
Effective tumor targeting delivery systems should have the ability to deliver the gene to the tumor site for high-efficiency cancer therapy. The in vivo distribution of Se–PEI–FA@cy5.5-siRNA and Se–PEI@cy5.5-siRNA nanoparticles in tumors and organs were evaluated using ex vivo fluorescence imaging at 6 h post-injection. The tumor and organs of mice not injected with nanoparticles were set as a control group, in which no obvious fluorescence signal was observed (Fig. 8), indicating that there was no auto-fluorescence in the tumor site and organs. However, evident fluorescence signal was captured in the tumor after 6 h post-injection with Se–PEI–FA@cy5.5-siRNA or Se–PEI@cy5.5-siRNA, and a significantly stronger fluorescence signal was captured after 6 h post-injection with Se–PEI–FA@cy5.5-siRNA in comparison with Se–PEI@cy5.5-siRNA. The fluorescence signal of nanoparticles was not observed in the liver and spleen, due to the rapid metabolism of liver and spleen. Such observation shows that the active tumor-targeting functionalized SeNPs, Se–PEI–FA@cy5.5-siRNA, accumulation more in the tumor of mice after systemic administration, possibly because of the specific binding between FA and its receptors in cancerous cells.In vivo antitumor efficacy
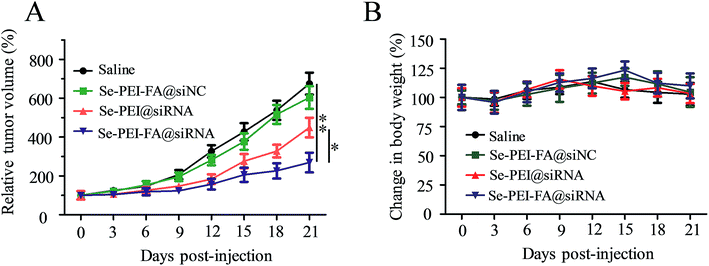
The antitumor efficacy of Se–PEI–FA@siRNA was assessed by a HepG2 tumor xenograft model. Briefly, the tumor-bearing mice were intravenously administered saline and different formulations of siRNA to assess the antitumor efficacy, respectively. The rapid tumor growth during administration periods in various treatment groups are shown in Fig. 9A. Se–PEI–FA@siNC shows similar influence on tumor growth compared with the saline-treated group. The active tumor-targeting Se–PEI–FA@siRNA shows more effective antitumor efficacy in comparison with Se–PEI@siRNA. The mice were also weighed every other day during the treatment period. As shown in Fig. 9B, no evident loss of body weight was observed after various kinds of treatment, suggesting very low toxicity and side effects of the drug at the treatment dose. In order to investigate whether the down-regulation of HES5 induced by Se–PEI–FA@siRNA contributed to the tumor growth inhibition, the protein expression of HES5 in tumors was analyzed by western blot experiments. As shown in Fig. S2,† Se–PEI–FA@siRNA shows higher activity to down-regulate the protein expression level of HES5 in comparison with Se–PEI@siRNA. Nevertheless, no distinct down-regulation of HES5 expression was observed after Se–PEI–FA@siNC-treatment. These results indicate that the tumor growth inhibition might be due to the down-regulation of HES5 gene.In vivo toxicity assessment
Apart from the antitumor effect, the in vivo toxic and side effects is important for cancer treatment. H&E staining was used to analyze the histological pattern of the main organs. As shown in Fig. 10, no dramatic difference was observed in Se–PEI–FA@siRNA, Se–PEI–FA@siNC or Se–PEI@siRNA-treated groups in comparison with the saline-treated group. The above data verifies that Se–PEI–FA@siRNA is well-tolerated in vivo at the dose used in this study. Thus, Se–PEI–FA@siRNA exhibits great potential as a tumor targeting delivery system for effective HCC treatment with low toxicity and side effects.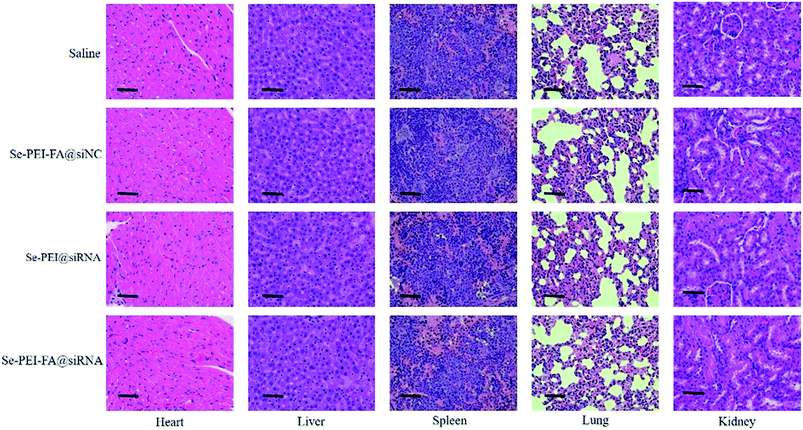 | ||
| Fig. 10 H&E analyses of heart, liver, spleen, lung and kidney after treatment with saline, Se–PEI–FA@siNC, Se–PEI@siRNA and Se–PEI–FA@siRNA, respectively. The scale bar is 50 μm. | ||
Conclusion
In summary, functionalized SeNPs conjugated with PEI and FA (Se–PEI–FA) were fabricated to deliver HES5-siRNA for HCC treatment. Se–PEI–FA@siRNA nanoparticles entered HepG2 cells by clathrin-mediated endocytosis. The Se–PEI–FA@siRNA nanoparticles exhibited enhanced cellular uptake and efficiently silenced the expressions of HES5 in vitro and in vivo. Moreover, Se–PEI–FA@siRNA could inhibit the proliferation of the HepG2 cells and induce HepG2 cell arrest at G0/G1 phase. Se–PEI–FA@siRNA nanoparticles were capable of accumulating in the tumor and led to enhanced antitumor effects. Furthermore, no distinct toxic effect was detected in the main organs of the Se–PEI–FA@siRNA-treated mice, indicating the good biocompatibility of such a gene delivery system. Taken together, these findings provide an alternative strategy for cancer gene treatments.Conflicts of interest
There are no conflicts to declare.Acknowledgements
This work was supported by the China Postdoctoral Science Foundation (No. 2017M612632), the Technology Planning Project of Guangdong Province (No. 2014A020212024), the Technology Planning Project of Guangzhou City (No. 201607010120) and the Technology Planning Project of Guangzhou (No. 201804010183).References
- J. Qu, X. Zhao and P. X. Ma, Acta Biomater., 2017, 58, 168–180 CrossRef PubMed.
- K. Huang, B. Shi and W. Xu, Acta Biomater., 2015, 27, 179–193 CrossRef PubMed.
- F. Li, T. Li and W. Cao, Biomaterials, 2017, 133, 208–218 CrossRef PubMed.
- Y. Xia, Z. Lin and Y. Li, J. Mater. Chem. B, 2017, 5, 6941–6952 RSC.
- Y. Li, M. Guo and Z. Lin, Int. J. Nanomed., 2016, 11, 6693–6702 CrossRef PubMed.
- Y. Xia, T. Xu and C. Wang, Int. J. Nanomed., 2018, 13, 143–159 CrossRef PubMed.
- C. J. Kowalczewski and J. M. Saul, Acta Biomater., 2015, 25, 109–120 CrossRef PubMed.
- Y. Xia, C. Wang and T. Xu, RSC Adv., 2018, 8, 1917–1926 RSC.
- J. Wang, B. Dou and Y. Bao, Mater. Sci. Eng., C, 2014, 34, 98–109 CrossRef PubMed.
- B. Zhao, Z. Zhou and Y. Shen, Chin. J. Polym. Sci., 2016, 34, 94–103 CrossRef.
- W. Zhang, N. Xu and Z. Yao, Chin. J. Org. Chem., 2016, 36, 2039–2052 CrossRef.
- Y. Cheng, Acta Polym. Sin., 2017, 8, 1234–1245 Search PubMed.
- Q. Chen, M. Xu and W. Zheng, ACS Appl. Mater. Interfaces, 2017, 9, 6712–6724 CrossRef PubMed.
- Y. Li, Z. Lin and M. Guo, Int. J. Nanomed., 2017, 12, 5733–5743 CrossRef PubMed.
- M. Guo, Y. Li and Z. Lin, RSC Adv., 2017, 7, 52456–52464 RSC.
- Q. Chen, Q. Yu and Y. Liu, Nanomedicine, 2015, 11, 1773–1784 CrossRef PubMed.
- W. Zheng, T. Yin and Q. Chen, Acta Biomater., 2016, 31, 197–210 CrossRef PubMed.
- Y. Xia, P. You and F. Xu, Nanoscale Res. Lett., 2015, 10, 349–353 CrossRef PubMed.
- Y. Li, Z. Lin and M. Zhao, Int. J. Nanomed., 2016, 11, 3065–3076 CrossRef PubMed.
- W. Zheng, C. Cao and Y. Liu, Acta Biomater., 2015, 11, 368–380 CrossRef PubMed.
- Y. Xia, M. Guo and T. Xu, Int. J. Nanomed., 2018, 13, 1539–1552 CrossRef PubMed.
- M. Chen, Y. Zhang and Z. Chen, Acta Biomater., 2017, 49, 444–455 CrossRef PubMed.
- M. H. Lee, E. J. Kim and H. Lee, J. Am. Chem. Soc., 2016, 138, 16380–16387 CrossRef PubMed.
- T. Wakasaki, H. Niiro and T. S. Jabbarzadeh, BMC Neurosci., 2017, 18, 64 CrossRef PubMed.
- Z. Yang, L. Wang and X. Wang, Mol. Med. Rep., 2016, 14, 3841–3847 CrossRef PubMed.
- L. Sun, J. Ke and Z. He, J. Cancer, 2017, 8, 2802–2808 CrossRef PubMed.
- Y. Xia, Q. Chen and X. Qin, New J. Chem., 2013, 37, 3706–3715 RSC.
- K. Rahme, J. Guo and J. D. Holmes, Colloids Surf., B, 2015, 135, 604–612 CrossRef PubMed.
- M. Benfer and T. Kissel, Eur. J. Pharm. Biopharm., 2012, 80, 247–256 CrossRef PubMed.
- X. Guo, Y. Yang and L. Liu, J. Ocul. Pharmacol. Ther., 2017, 33, 366–374 CrossRef PubMed.
- B. Xin and L. Rui, J. Otol., 2012, 7, 19–24 CrossRef.
- X. Li, Q. Zhang and K. Fan, Int. J. Mol. Sci., 2016, 17, 437 CrossRef PubMed.
Footnote |
| † Electronic supplementary information (ESI) available. See DOI: 10.1039/c8ra04204g |
| This journal is © The Royal Society of Chemistry 2018 |


