
 Open Access Article
 This Open Access Article is licensed under a Creative Commons Attribution-Non Commercial 3.0 Unported Licence
Synthesis of TiO2–ZnS nanocomposites via sacrificial template sulfidation and their ethanol gas-sensing performance
Yuan-Chang Liang * and
Nian-Cih Xu
* and
Nian-Cih Xu
Institute of Materials Engineering, National Taiwan Ocean University, Keelung 20224, Taiwan. E-mail: yuanvictory@gmail.com
First published on 19th June 2018
Abstract
TiO2–ZnS core–shell composite nanorods were synthesized by using ZnO as a sacrificial shell layer in a hydrothermal reaction. ZnO thin films of different thicknesses were sputter-deposited onto the surfaces of TiO2 nanorods as templates for hydrothermally synthesizing TiO2–ZnS core–shell nanorods. Structural analysis revealed that crystalline TiO2–ZnS composite nanorods were formed without any residual ZnO phase after hydrothermal sulfidation in the composite nanorods. The thickness of the ZnO sacrificial shell layer affected the surface morphology and sulfur-related surface defect density in hydrothermally grown ZnS crystallites of TiO2–ZnS composite nanorods. Due to the distinctive core–shell heterostructure and the heterojunction between the TiO2 core and the ZnS shell, TiO2–ZnS core–shell nanorods exhibited ethanol gas-sensing performance superior to that of pristine TiO2 nanorods. An optimal ZnO sacrificial shell layer thickness of approximately 60 nm was found to enable the synthesis of TiO2–ZnS composite nanorods with satisfactory gas-sensing performance through sulfidation. The results demonstrated that hydrothermally derived TiO2–ZnS core–shell composite nanorods with a sputter-deposited ZnO sacrificial shell layer are promising for applications in gas sensors.
Introduction
TiO2 semiconductors are widely used in gas sensors due to their low cost and high stability in harsh environments. In particular, TiO2 nanostructures are considered promising candidates for gas sensor materials because of the high surface-to-volume ratio of one-dimensional (1D) nanomaterials.1,2 Synthesizing a 1D TiO2 nanostructure is important for fabricating high-performance gas sensors. Numerous methods have been proposed for fabricating 1D TiO2 nanostructures with various low-dimensional morphologies.3–5 Among these, the hydrothermal method is a promising and low-cost method for synthesizing 1D TiO2 with various morphologies. Nowadays, the hydrothermal synthesis of 1D TiO2 nanostructures typically yields a large amount of 1D TiO2 nanostructures from a solution at a lower process temperature than that of vapor deposition processes.6 However, a single-TiO2-phase gas sensor's response performance requirements must be satisfied to deliver high efficiency in practical applications. Assembling a secondary phase on the surfaces of 1D TiO2 nanostructures can preserve their high charge transfer ability, increase the number of active sites, and even change basic sensing properties. Gas sensors based on two components have been explored to improve the gas-sensing performance of low-dimensional TiO2 oxide systems.1,7 Therefore, it is crucial to explore new synthesis methods and material systems of 1D TiO2 composites for fabricating TiO2-based gas sensors with high gas-sensing performance.Recently, various 1D ZnS nanostructures have been synthesized successfully, and various ZnS-nanostructure-based nanoscale gas sensors have been fabricated.8,9 Moreover, ZnS has been decorated onto various oxide materials to improve their gas-sensing performance. Liu et al. fabricated ZnO–ZnS core–shell nanorods with high H2S gas sensing performances.10 Zhang et al. reported a facile and mild two-step hydrothermal strategy for synthesizing 1D ZnO–ZnS core–shell microrods using the low-cost inorganic salt Na2S as a sulfurizing agent.11 Gas-sensing measurement results demonstrated that ZnO–ZnS core–shell composite sensors showed excellent gas-sensing performance for ethanol and acetone vapors. The decoration of adequate ZnS spheres onto the surfaces of low-dimensional TiO2 flowers enhanced the gas-sensing response to ethanol gas.7 These studies have demonstrated that ZnS is a promising candidate for use as an additive to low-dimensional oxides to form heterostructures and to improve the gas-sensing performance of these oxides. However, few studies have focused on 1D TiO2-based core–shell composites with ZnS shell layers for gas-sensing device applications because of their complex synthesis strategies. In this study, a ZnO shell layer was initially used as a sacrificial layer by using thioacetamide (TAA) as a sulfurizing reagent to form TiO2–ZnS core–shell composite nanorods. This is a simple and facile route for synthesizing 1D TiO2–ZnS structures. Furthermore, the structure-dependent gas-sensing performance of 1D TiO2–ZnS nanostructures was investigated to explore whether the sulfidation, chemical conversion, and cation exchange processes of sacrificial ZnO are feasible for fabricating gas sensors based on TiO2–ZnS composite nanorods with high gas-sensing performance.
Experiments
TiO2 nanorods coated with various thicknesses of ZnO are subjected to sulfidation to form TiO2–ZnS composite nanorods. The TiO2 nanorods were grown on glass substrates using a hydrothermal method in this study. An amount of 7.4 mL of deionized water was mixed with 12.6 mL of concentrated HCl (35%) in a Teflon-lined digestion autoclave. The mixture was stirred at ambient conditions for 5 min and after that, 0.25 mL of TiCl4 was added into the mixed solution for preparation of the TiO2 nanorods. The hydrothermal synthesis was conducted at 180 °C for 3 h. After the synthesis reaction, the autoclave was cooled down to room temperature. Then the samples were removed, washed with deionized water, and air dried. TiO2–ZnO composite nanorods were fabricated by sputtering ZnO thin films onto the surfaces of the hydrothermally derived TiO2 nanorod templates. During growth of the ZnO thin films, the radio-frequency sputtering power of ZnO target was fixed at 90 W. The thin-film growth temperature was maintained at 375 °C with an Ar/O2 ratio of 20![[thin space (1/6-em)]](https://www.rsc.org/images/entities/char_2009.gif) :5. The working pressure during sputtering thin-film deposition was fixed at 20 mTorr. TiO2–ZnO core–shell composite nanorods with different ZnO shell layer thicknesses (20–60 nm) were fabricated. The ZnO shell layer was further used as sacrificial layer by employing thioacetamide (TAA) as a sulfurizing reagent to form TiO2–ZnS core–shell nanostructures. The as-synthesized TiO2–ZnO nanorods were further immersed in a Teflon autoclave containing 0.05 M TAA aqueous solution. The reaction system was heated to 130 °C and kept for 5 h to grow TiO2–ZnS composite nanorods. Finally, the reaction system was cooled to room temperature naturally, and then the final samples washed in deionized water and dried in an oven. The TiO2–ZnS-1, TiO2–ZnS-2, and TiO2–ZnS-3 represent TiO2–ZnS composite nanorods formed after sulfidation with 20, 40, and 60 nm-thick ZnO sacrificial shell layers, respectively.
:5. The working pressure during sputtering thin-film deposition was fixed at 20 mTorr. TiO2–ZnO core–shell composite nanorods with different ZnO shell layer thicknesses (20–60 nm) were fabricated. The ZnO shell layer was further used as sacrificial layer by employing thioacetamide (TAA) as a sulfurizing reagent to form TiO2–ZnS core–shell nanostructures. The as-synthesized TiO2–ZnO nanorods were further immersed in a Teflon autoclave containing 0.05 M TAA aqueous solution. The reaction system was heated to 130 °C and kept for 5 h to grow TiO2–ZnS composite nanorods. Finally, the reaction system was cooled to room temperature naturally, and then the final samples washed in deionized water and dried in an oven. The TiO2–ZnS-1, TiO2–ZnS-2, and TiO2–ZnS-3 represent TiO2–ZnS composite nanorods formed after sulfidation with 20, 40, and 60 nm-thick ZnO sacrificial shell layers, respectively.
Crystal structures of the TiO2–ZnS composite nanorods were investigated by X-ray diffraction (XRD). The surface morphologies of the samples were characterized by scanning electron microscopy (SEM), and high-resolution transmission electron microscopy (HRTEM) was used to investigate the detailed microstructures of the composite nanorods. The attached energy dispersive X-ray spectroscopy (EDS) was used to investigate the compositions of the TiO2–ZnS composite nanorods. X-ray photoelectron spectroscopy (XPS) analysis was used to determine the chemical binding status of constituent elements of the samples. The gas-sensing responses of the gas sensors made from the TiO2–ZnS composites nanorods to ethanol vapor with concentrations of 50–1000 ppm are defined as the Ra/Rg. Ra is the sensor electrical resistance in the absence of target gas and Rg is that in the target gas.
Results and discussion
Fig. 1(a) shows an SEM image of as-synthesized TiO2 nanorods. The figure shows that the as-synthesized TiO2 nanorods have a rectangular cross-section. The TiO2 nanorods have lengths and diameters of 400–600 nm and 80–100 nm, respectively, and they have smooth surfaces. Fig. 1(b)–(d) show SEM images of TiO2 nanorods coated with ZnO layers of various thicknesses and subjected to sulfidation. These TiO2 nanorods had rough surfaces. Small spherical crystallites formed on the TiO2 nanorods after the ZnO thin-film shell layer had been subjected to sulfidation; this can be attributed to the ZnO thin-films being converted to spherical ZnS crystallites through ion exchange during sulfidation.9,12 The diameters of the composite nanorods increased with ZnO shell thickness after sulfidation, revealing thicker ZnS crystallite masses on the TiO2 nanorod surfaces. The SEM observations indicate that the surface morphology of the TiO2–ZnS composite nanorods can be controlled by changing the thickness of the ZnO sacrificial layer. | ||
| Fig. 1 SEM images of various nanorods: (a) TiO2, (b) TiO2–ZnS-1, (c) TiO2–ZnS-2, and (d) TiO2–ZnS-3. | ||
Fig. 2(a) shows the XRD pattern of the as-synthesized TiO2 nanorods. The intense Bragg reflections originating from the sample can be indexed to a rutile phase of TiO2 (JCPDS no. 021-1276). Fig. 2(b)–(d) show the XRD patterns of the TiO2 nanorods coated with various thicknesses of ZnO shell layers and treated with sulfidation. Notably, in addition to Bragg reflections from TiO2 nanorods, no Bragg reflection originated from the hexagonal ZnO phase was detected herein. Instead, tiny Bragg reflection centered at approximately 28.56°, which is indexed to the (111) plane of the cubic ZnS structure appeared (JCPDS no. 005-0566). The XRD patterns revealed that the ZnS crystallites formed on the surfaces of TiO2 nanorods after sulfidation.11 The intensity of ZnS (111) increased with the initially coated ZnO shell layer thickness, revealing an increased ZnS crystallite thickness with ZnO sacrificial layer thickness after sulfidation. The XRD analysis results are in consistent with the observation of SEM images. The crystalline TiO2–ZnS composite nanorods are successfully synthesized through sulfidation of sputtering assisted synthesis of TiO2–ZnO composite nanorods in this study.
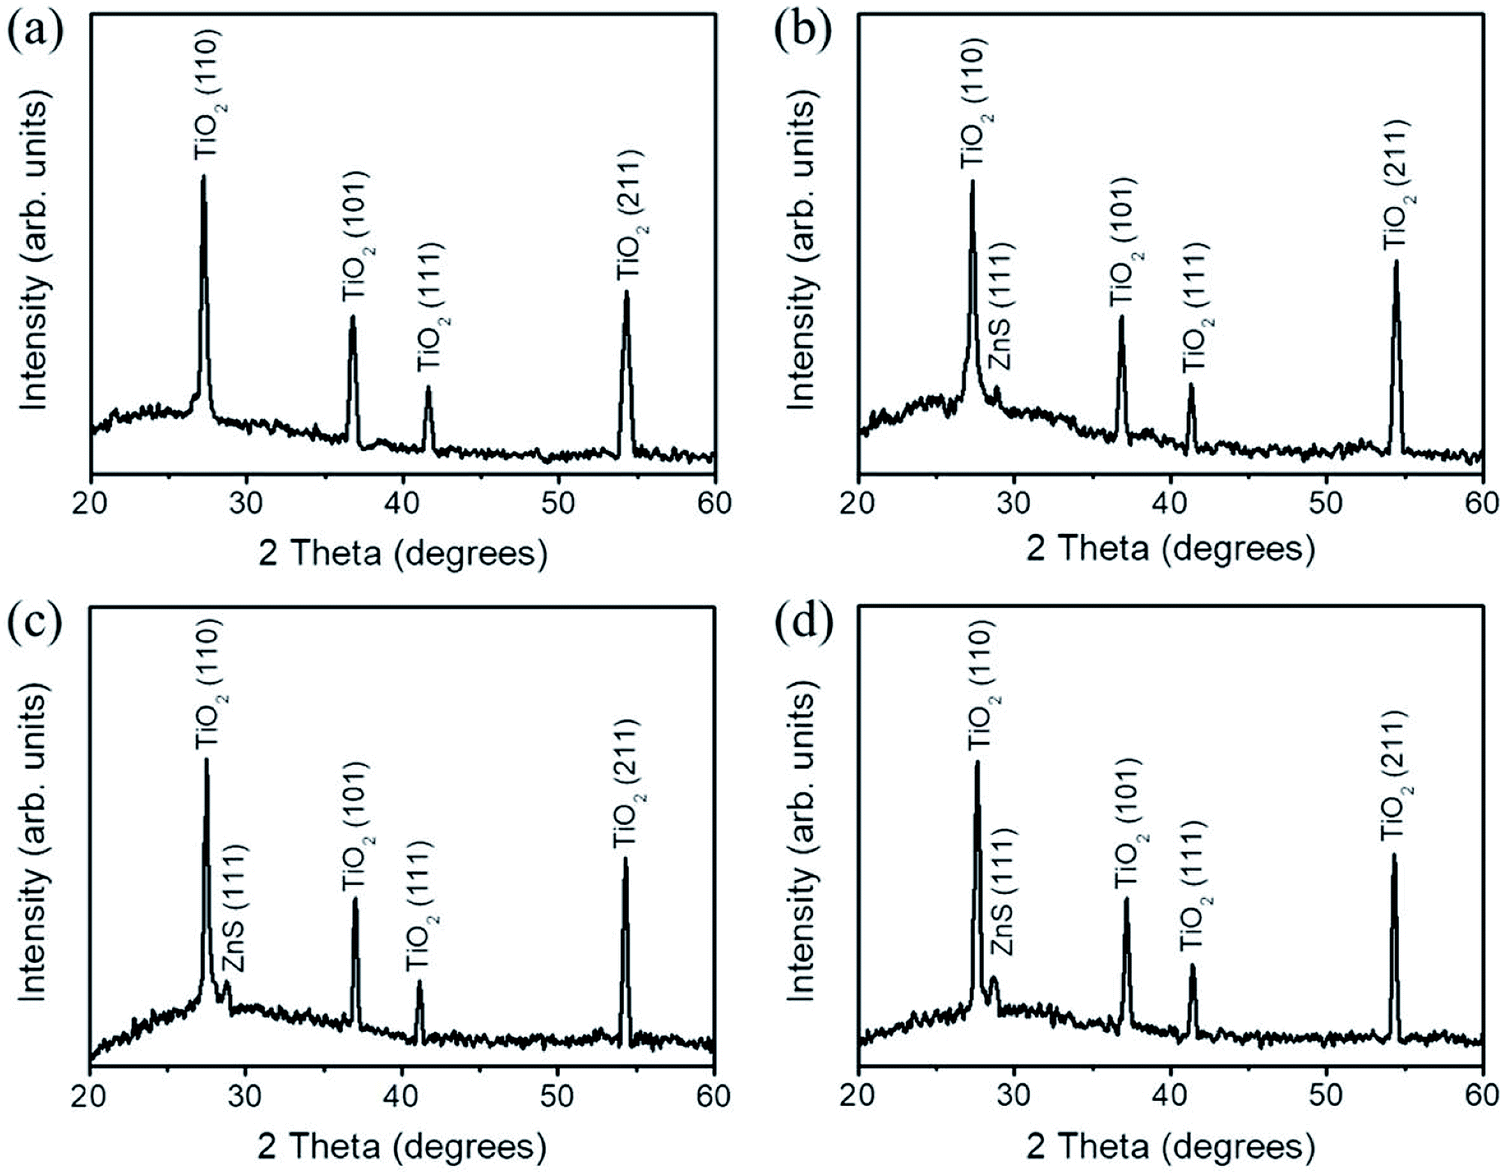 | ||
| Fig. 2 XRD patterns of various nanorods: (a) TiO2, (b) TiO2–ZnS-1, (c) TiO2–ZnS-2, and (d) TiO2–ZnS-3. | ||
Fig. 3(a) shows a low-magnification TEM image of a TiO2 nanorod coated with an ultrathin 20 nm-thick ZnO sacrificial layer after sulfidation. The surface of the TiO2 nanorod consisted of randomly oriented nanoparticles and aggregates that measured 12–23 nm. Some regions of the TiO2 nanorod surface were not fully covered with nanoparticles and aggregates. Fig. 3(b) and (c) show high-resolution TEM (HRTEM) images taken from the outside regions of the composite nanorod. The nanoparticles or aggregates exhibited clear lattice fringes; however, they were randomly oriented and exhibited a polycrystalline structure of particle-like crystallites decorated on the TiO2 nanorod surface. The EDS line-scanning profiles in Fig. 3(d) across the composite nanorod prove that the composite nanorod comprised Ti, Zn, O, and S. The O signal was mainly confined within the core region for the TiO2 nanorod, and marked Zn and S signals were found in the TiO2 outer area, indicating that the particle-like crystallites mainly comprised Zn and S.
 | ||
| Fig. 3 TEM analyses of the TiO2–ZnS-1 nanorod: (a) low-magnification TEM image, (b) and (c) HRTEM images taken from various regions of the nanorod (d) EDS line-scanning profiles across the composite nanorod. | ||
Fig. 4(a) illustrates a low-magnification TEM image of the TiO2 nanorod coated with a 40 nm-thick ZnO sacrificial layer after sulfidation. The sharp interface between the core and shell after sulfidation clearly evinces that the TiO2 nanorod was fully sheathed by a ZnS crystallite layer along its entire length. The shell layer thickness after sulfidation was 33–42 nm. The HRTEM images in Fig. 4(b) and (c) provide further insights into the morphologies and microstructures of the shell layer. The surface of the shell layer consisted of particle-like crystallites and was rugged. Fig. 4(d) depicts the selected area electron diffraction (SAED) pattern recorded from several composite nanorods. The concentric rings could be attributed to diffraction from the (110), (101), (111), and (211) planes corresponding to the rutile phase of TiO2 and the (111) plane corresponding to the cubic ZnS structure. The SAED analysis agrees with the XRD pattern, revealing that crystalline TiO2–ZnS composite nanorods formed. The EDS spectrum in Fig. 4(e) proves that Ti, Zn, O, and S were present in the selected composite nanorod.
 | ||
| Fig. 4 TEM analyses of the TiO2–ZnS-2 nanorod: (a) low-magnification TEM of the TiO2–ZnS-2 nanorod, (b) and (c) HRTEM images taken from various regions of the nanorod, (d) SAED pattern of several TiO2–ZnS-2 nanorods, (e) EDS spectrum of the nanorod. | ||
Fig. 5(a) presents a low-magnification TEM image of the composite nanorod coated with a 60 nm-thick sacrificial ZnO shell layer after sulfidation. The dark/bright contrast along the radial direction of the nanorod indicates that the TiO2 nanorod was covered by ZnS nanoparticles or aggregates after sulfidation. In the HRTEM images (Fig. 5(b) and (c)) of the TiO2–ZnS nanorod, the thickness of the ZnS shell layer on the surface of the TiO2 nanorod was inhomogeneous and was approximately 63 nm at its thickest extent. The distinct lattice fringes with interplanar distance of 0.31 nm in the HRTEM images can be assigned to the (111) plane of cubic ZnS, confirming the formation of highly crystalline ZnS particles. Fig. 5(d) shows the corresponding SAED pattern taken from several composite nanorods showing a crystalline TiO2–ZnS composite structure. No diffraction signal from ZnO was detected, indicating full conversion of the ZnO phase into a ZnS phase after sulfidation. The EDS spectrum (Fig. 5(e)) taken from the composite nanorod proves that Ti, Zn, O, and S were the primary elements in the as-formed composite nanorod.
 | ||
| Fig. 5 TEM analyses of the TiO2–ZnS-3 nanorod: (a) low-magnification TEM of the TiO2–ZnS-3 nanorod, (b) and (c) HRTEM images taken from various regions of the TiO2–ZnS-3 nanorod, (d) SAED patterns of several TiO2–ZnS-3 nanorods, and (e) EDS spectrum of the TiO2–ZnS-3 nanorod. | ||
Fig. 6(a)–(c) show high-resolution XPS spectra at the Zn2p core level. The binding energy of Zn2p3/2 located at 1021.9 eV and that of Zn2p1/2 located at 1044.9 eV indicated a normal oxidation valence state of Zn2+ in ZnS.11 The spin–orbit splitting of approximately 23 eV between the two core level components of Zn2p3/2 and Zn2p1/2 was in good agreement with the reported literature value; this confirmed their bivalent state.13 The high-resolution XPS spectra of S2p in Fig. 6(d)–(f) indicated an asymmetric feature, and each S2p spectrum was fitted into two subpeaks of different intensities located at approximately 161.5 and 162.6 eV, corresponding to S2p3/2 and S2p1/2, respectively, which were related to Zn–S bonding.14 Increased bonding states of sulfur-related surface defects in hydrothermally grown ZnS crystallites have been proven to decrease the intensity ratio of the spin–orbit splitting peaks for S2p3/2 and S2p1/2 and cause it to deviate from 2:1.12 From the analysis of the S2p XPS spectra, the intensity ratio of the spin–orbit splitting peaks for S2p3/2 and S2p1/2 decreased with an increase in the sacrificial ZnO shell layer's thickness; the intensity ratio decreased from approximately 2:1 to 1:1 as the sacrificial ZnO shell layer's thickness was increased from 20 to 60 nm. The initially thicker sacrificial ZnO shell layer on the TiO2 nanorods engendered the formation of additional surface crystal defects on the hydrothermal sulfidation growth shell layers of TiO2–ZnS composite nanorods.
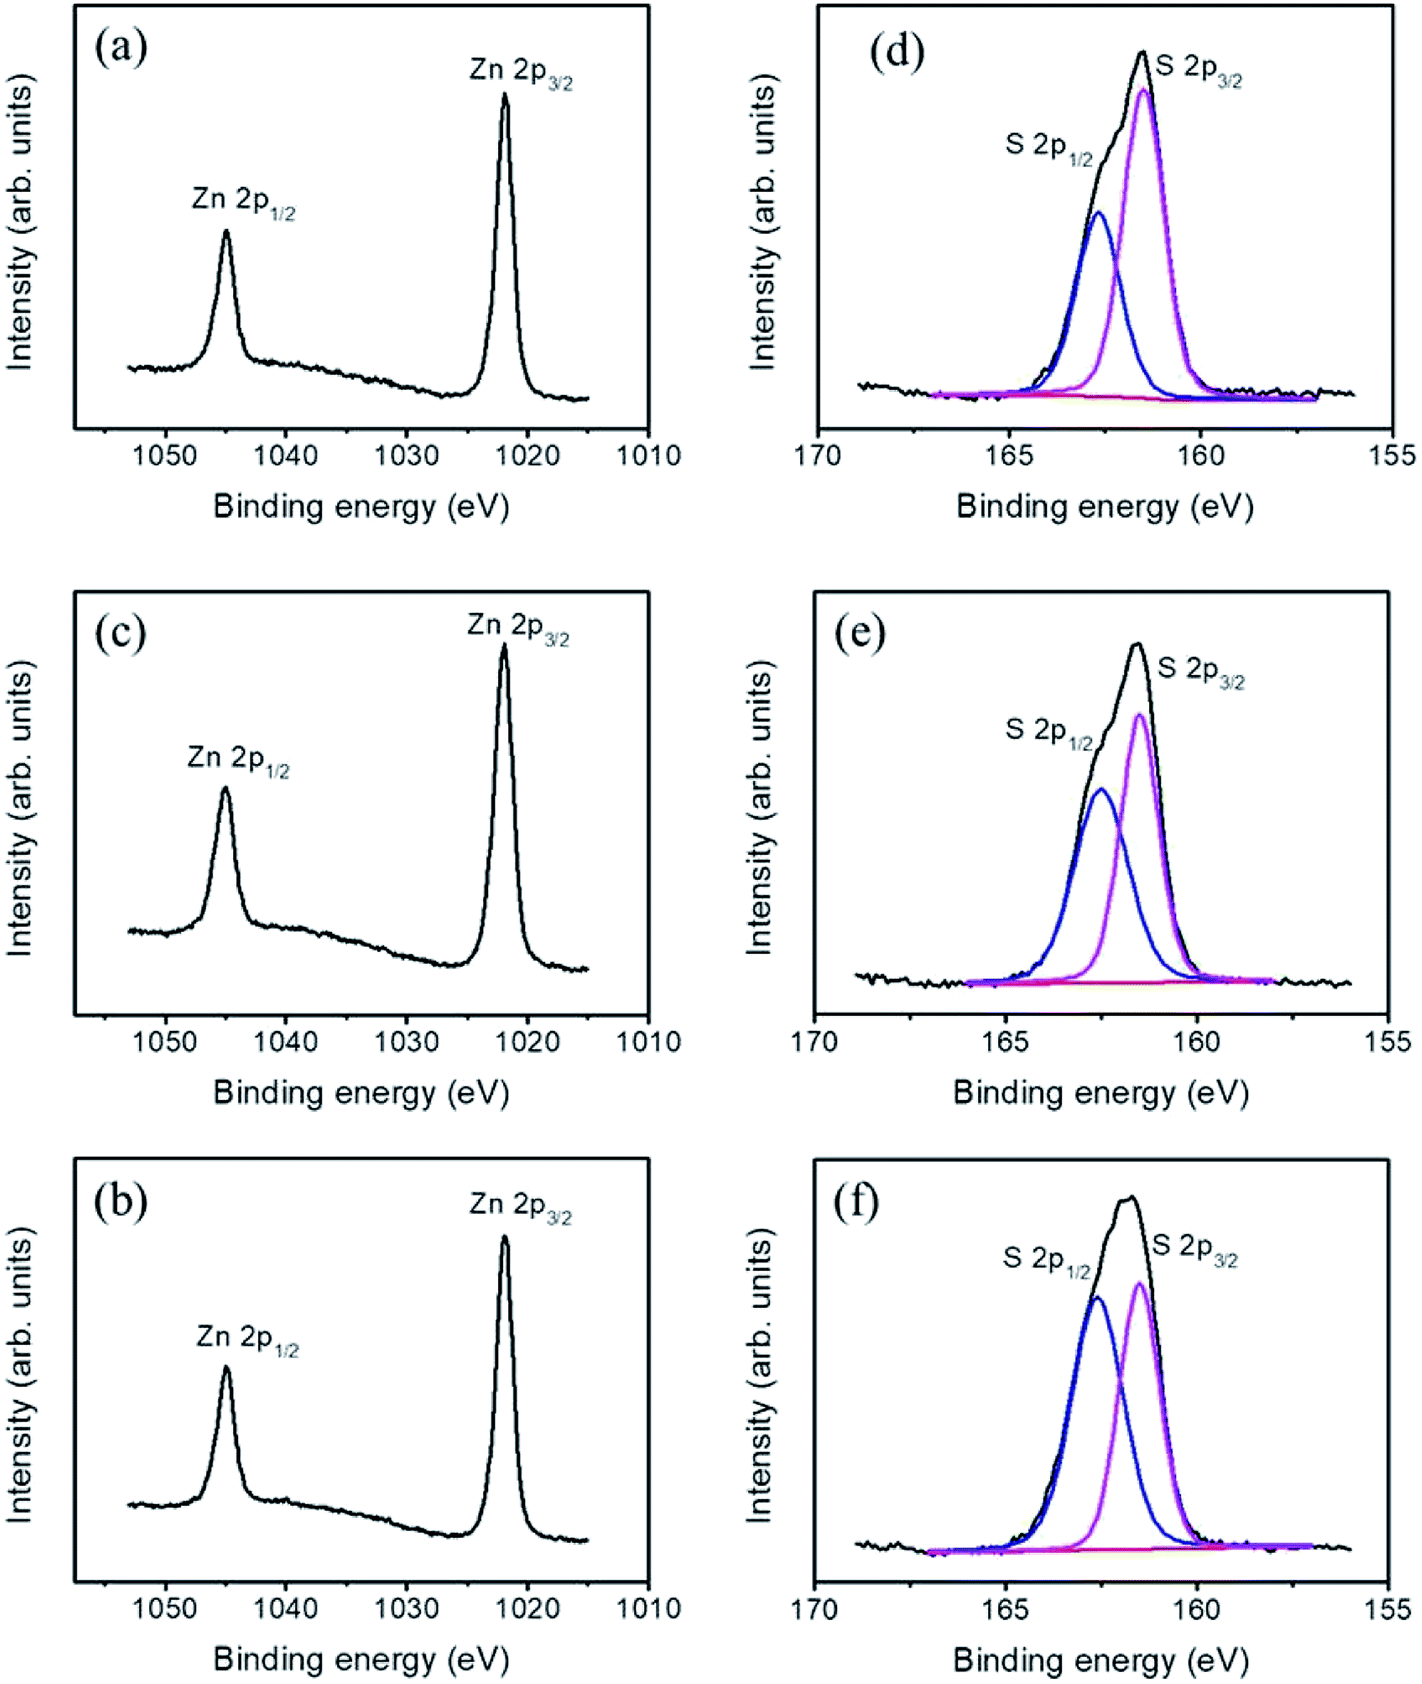 | ||
| Fig. 6 High-resolution XPS spectra of various TiO2–ZnS nanorods: Zn2p of (a) TiO2–ZnS-1, (b) TiO2–ZnS-2, (c) TiO2–ZnS-3. S2p of (d) TiO2–ZnS-1, (e) TiO2–ZnS-2, and (f) TiO2–ZnS-3. | ||
Fig. 7 shows temperature dependent gas-sensing responses of the gas sensor made from TiO2–ZnS-3 nanorods to 250 ppm ethanol vapor. The gas-sensing response of the gas sensor varied with operating temperature. The response increased with operating temperature, up to 300 °C and reached to the maximum gas-sensing response of 9.2; further increasing the operating temperature decreased the gas-sensing response of the sensor. One possible reason is the oxidation reaction of the ZnS surface with oxygen that occurs at a high temperature, which weakens the ZnS surface structure.7 The optimal operating temperature of the TiO2–ZnS composite nanorods was determined to be 300 °C in this study.
 | ||
| Fig. 7 Temperature-dependent gas-sensing response of the TiO2–ZnS-3 nanorods exposed to 250 ppm ethanol vapor. | ||
Fig. 8(a)–(c) illustrate the dynamic resistance response–recovery curves of sensors made from various TiO2–ZnS composite nanorods on exposure to 50–1000 ppm of ethanol vapor at 300 °C. Notably, the sensors made from TiO2–ZnS composite nanorods showed wide resistance variation range for ethanol from 50 to 1000 ppm. The output signal resistance of the sensors decreased abruptly upon the injection of reducing ethanol vapors, following which it increased dramatically and recovered to the initial value after the ethanol vapors had been released and air had been introduced. This gas-sensing behavior revealed the n-type semiconductor nature of TiO2 and ZnS. Fig. 8(d) illustrates the gas-sensing responses of various gas sensors exposed to various concentrations of ethanol vapor. The gas-sensing responses of the sensor made from pristine TiO2 nanorods are also shown for a comparison. The gas-sensing responses of sensors made from TiO2–ZnS composite nanorods were superior to those of the sensor made from pure TiO2 nanorods. The existence of a heterojunction between TiO2 and ZnS induced a potential barrier at the TiO2/ZnS heterointerface. During the gas-sensing test, the interfacial potential barrier height variation of the TiO2–ZnS heterostructures increased the resistance variation of the sensor made from composite nanorods; this improved the gas-sensing response of the TiO2 nanorods. A similar heterojunction effect that can improve the gas-sensing responses for TiO2-based composites has been reported for TiO2–In2O3 composite nanofibers and TiO2–Co3O4 nanostructures.15,16 The gas sensor made from TiO2–ZnS-3 composite nanorods showed better gas-sensing responses than the sensors made from TiO2–ZnS-1 and TiO2–ZnS-2 composite nanorods under similar gas-sensing test conditions. Fig. 8(e) illustrates cycling response–recovery characteristic curves of the sensor made from TiO2–ZnS-3 composite nanorods on exposure to 250 ppm of ethanol vapor. The gas sensor still demonstrated a high response after cycling tests, indicating its excellent stability and reproducibility for detecting ethanol vapor. Furthermore, the response times of the sensor comprising TiO2–ZnS-3 nanorods were in the range of approximately 12–23 s, and the recovery times were in the range of 30–48 s on exposure to 50–1000 ppm of ethanol vapor. Moreover, the response times of the sensor made from pristine TiO2 nanorods were in the range of approximately 20–33 s, and the recovery times were in the range of 35–78 s on exposure to 50–1000 ppm of ethanol vapor. The granular-like shell layer of the TiO2–ZnS-3 nanorods might account for the superior sensing speed of the composite nanorods. In Fig. 8(f), the TiO2–ZnS-3 nanorods still show a visible dynamic response–recovery curve on exposure to trace ethanol vapor of 5 ppm. The gas-sensing response reached 1.67 for the TiO2–ZnS-3 nanorods on exposure to 5 ppm ethanol vapor. Notably, the gas-sensing response of the pristine TiO2 nanorods is only 1.12 even on exposure to a higher ethanol concentration of 50 ppm. The enhancement of ethanol vapor detection ability of the TiO2 nanorods coated with granular-like ZnS shell layer is distinct in this study. The gas sensing mechanism for semiconductors is associated with the change in electrical resistance resulting from the chemical interaction between surface complexes such as O2− and target gas molecules, involving gas adsorption, charge transfer, and desorption processes.7,17 Fig. 9 shows the possible gas-sensing mechanisms for TiO2–ZnS composite nanorods. Oxygen species are adsorbed on the surfaces of such TiO2–ZnS composite nanorods in air and are then ionized into oxygen ions by capturing free electrons from the heterostructures, thus leading to the formation of a surface depletion layer at the composite nanorod surfaces. Moreover, the interface depletion region formed initially because of the different work functions of TiO2 and ZnS was widened. The size variations of the surface and interfacial depletion regions dominated the electrical resistance variation of the TiO2–ZnS composite nanorods during ethanol vapor sensing tests, and this was associated with the resultant gas-sensing response of the composite nanorods.7,18 Notably, the granular-like ZnS shell layer of the TiO2–ZnS composite nanorods was advantageous for the adsorption of oxygen molecules. In ZnS nanoparticles exposed to air, oxygen molecules have been shown to be efficiently adsorbed on surfaces as negatively charged ions by capturing free electrons from the semiconductor ZnS and creating a depletion layer with low conductivity near the nanoparticle surfaces.19 In general, the surface crystal defects of the sulfides serve as active sites for adsorbing gas molecules. The surface crystal defects of ZnS have shown to enhance the adsorption of both oxygen and target gases, leading to high gas responses for ZnS-based gas sensors.20 Hussain et al. reported that the enhanced gas-sensing response for ZnS nanostructures was attributed to the presence of many surface active sites because of the surface vacancies and interstitial sulfur lattice defects in ZnS.21 In the present study, the high number of surface crystal defects in the thick ZnS shell layers of the TiO2–ZnS composite nanorods, as mentioned previously, engendered the adsorption of numerous oxygen ions onto the surfaces of the composite nanorods. When the TiO2–ZnS composite nanorods were exposed to ethanol vapor, ethanol molecules were able to react with the adsorbed ionized oxygen species, causing the trapped electrons to be released back to the conduction band of both the TiO2 core and the ZnS shell and thereby narrowing the size of the surface and interfacial depletion regions and decreasing the total resistance of the TiO2–ZnS composite rod sensors. The interaction between the reducing ethanol vapor and the adsorbed oxygen species can be expressed as follows:9
| C2H5OH(vapor) + 6O2−(ads.) → 2CO2 + 3H2O + 6e– |
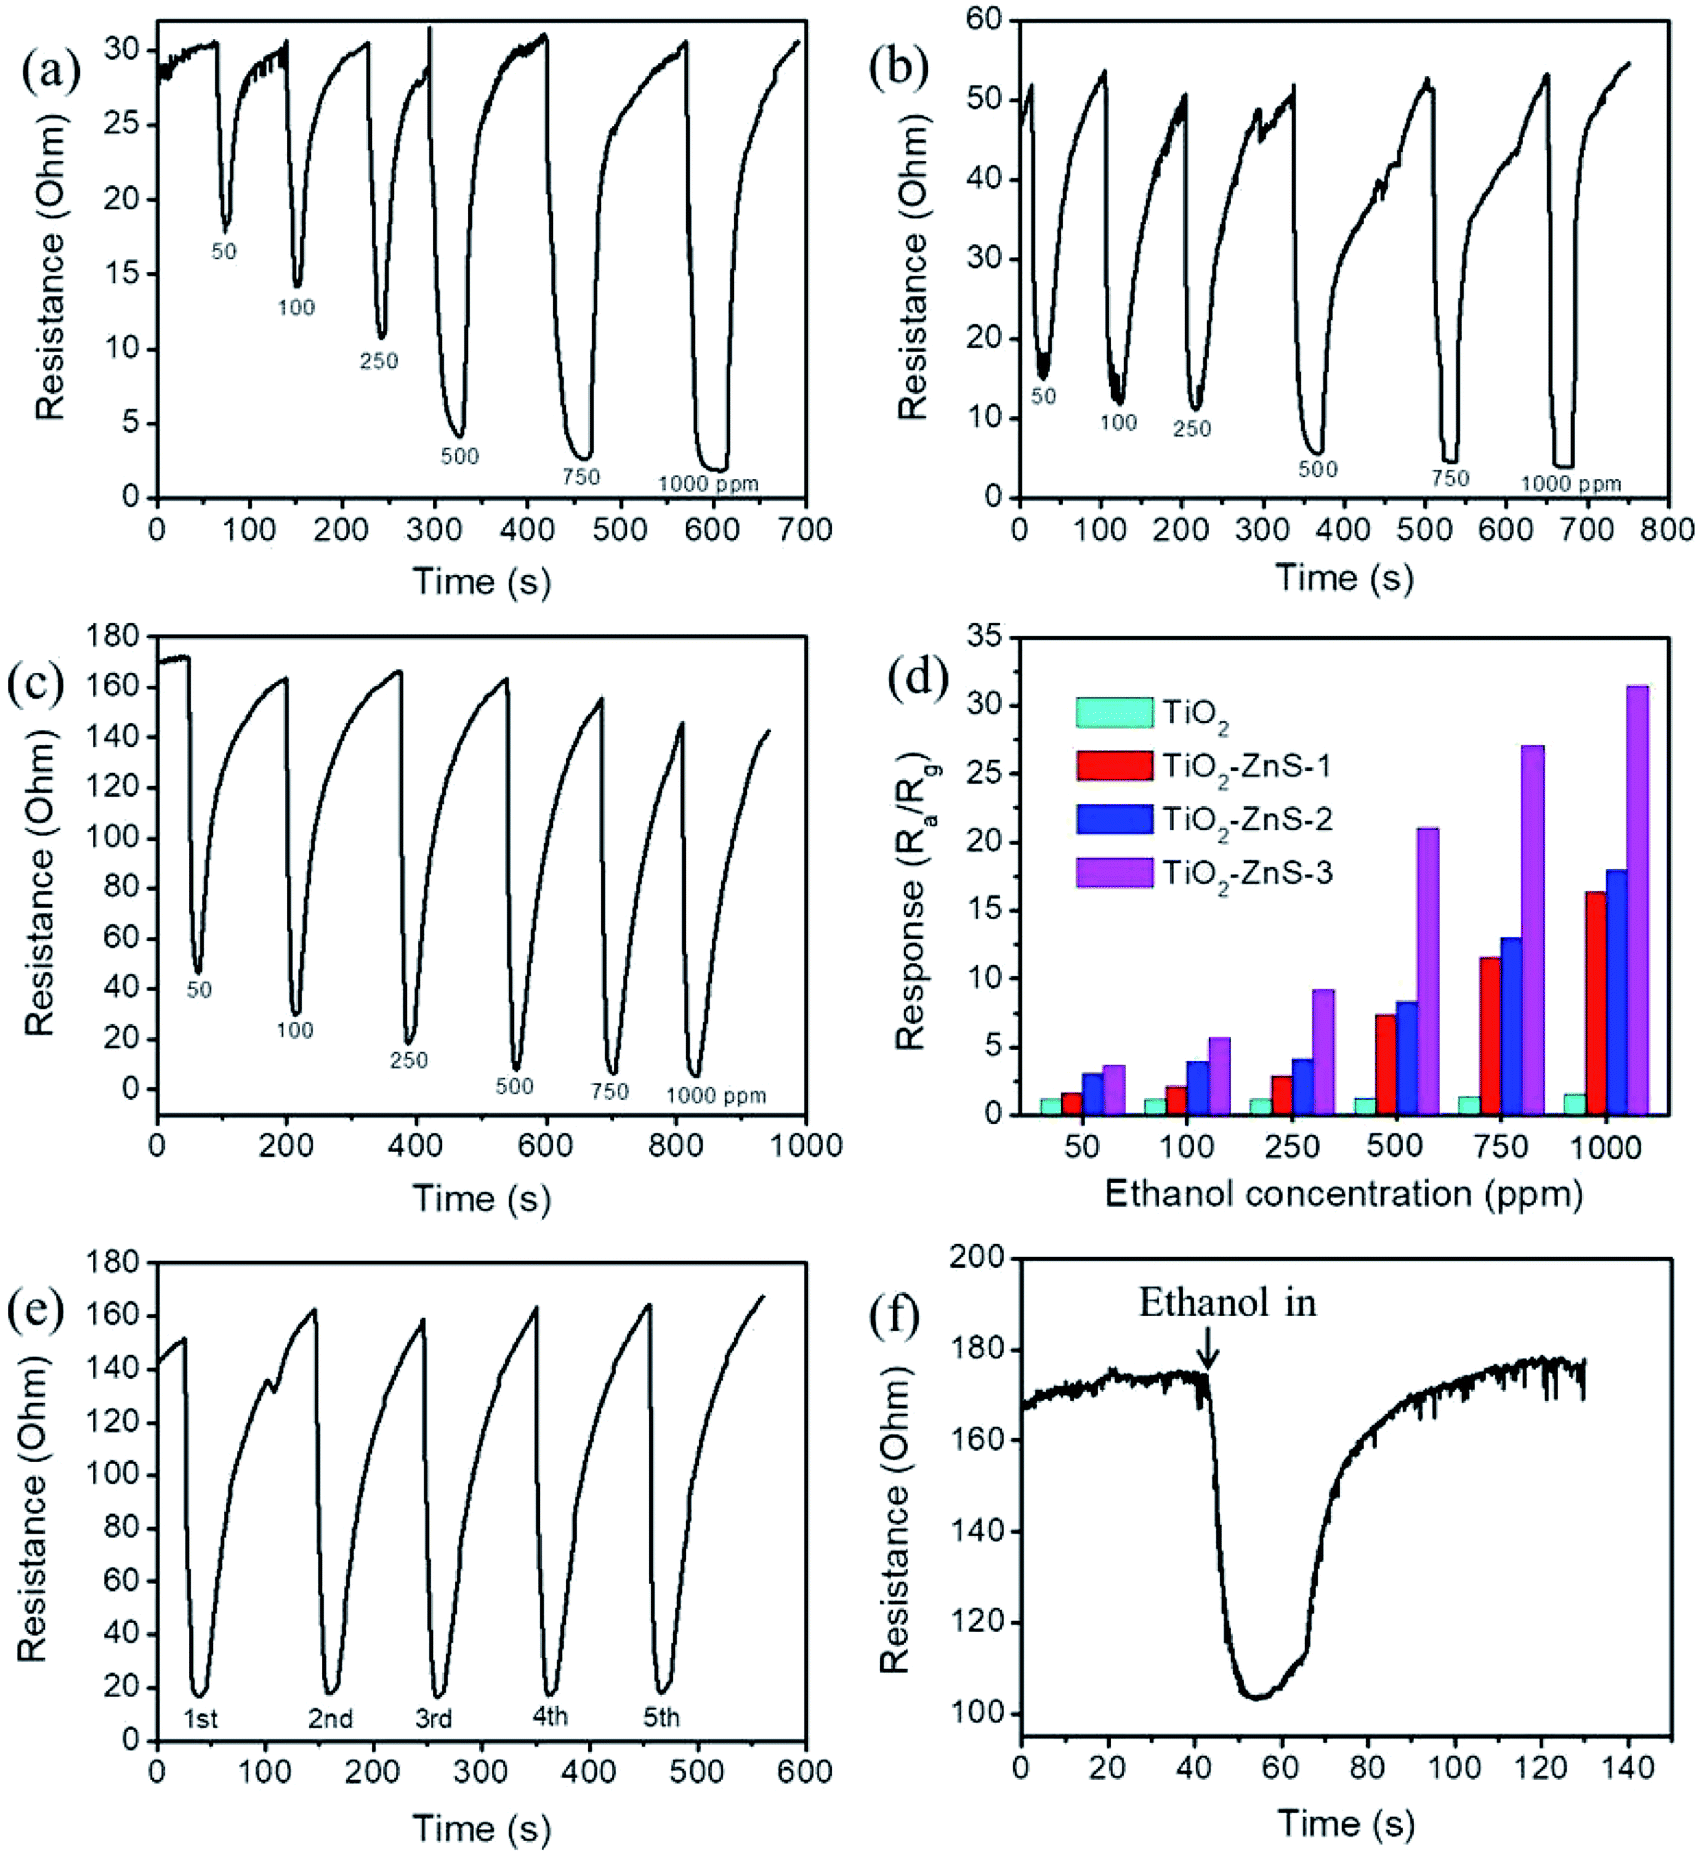 | ||
| Fig. 8 Dynamic gas-sensing response–recovery curves of the various sensors exposed to different concentrations of ethanol vapor (50–1000 ppm): (a) TiO2–ZnS-1, (b) TiO2–ZnS-2, and (c) TiO2–ZnS-3. (d) Gas-sensing response values comparison of the sensors based on the TiO2, TiO2–ZnS-1, TiO2–ZnS-2, and TiO2–ZnS-3 toward to 50–1000 ppm ethanol vapor. (e) Cycling tests of the TiO2–ZnS-3 sensor on exposure to 250 ppm ethanol vapor. (f) Dynamic gas-sensing response–recovery curve of the TiO2–ZnS-3 sensor exposed to 5 ppm ethanol vapor. | ||
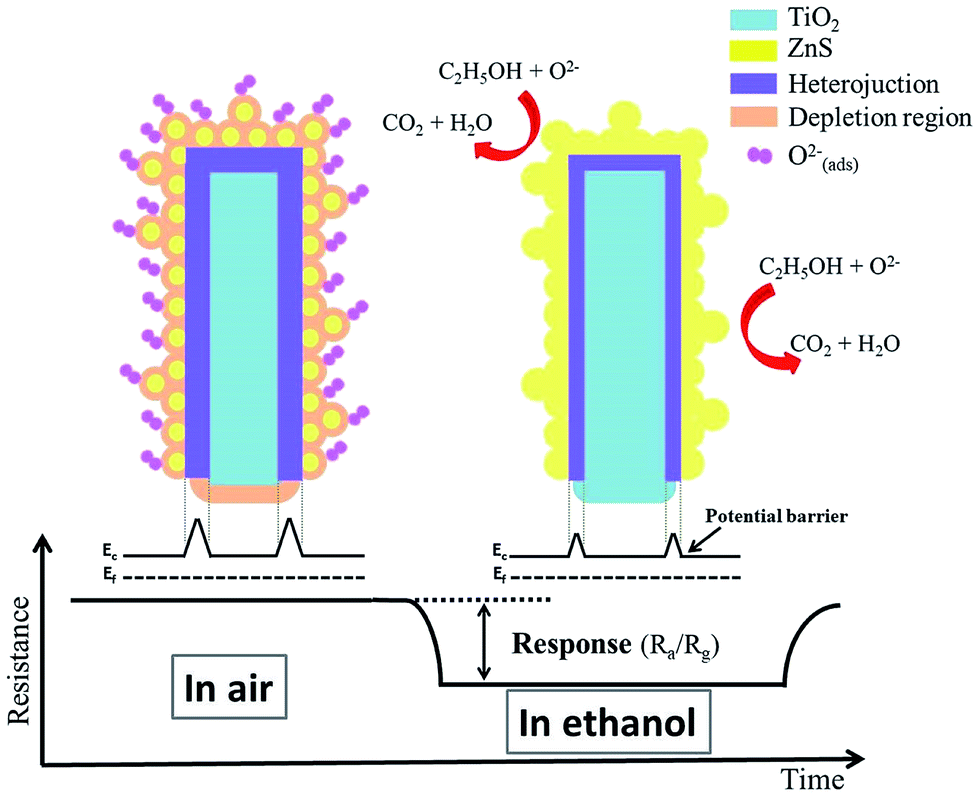 | ||
| Fig. 9 Schematic diagrams of the gas-sensing mechanisms of TiO2–ZnS composite nanorods. | ||
The thick ZnS shell layer of the composite nanorods with numerous surface crystal defects would be expected to have extreme size variation of the surfaces and interfacial potential barrier heights in the TiO2–ZnS composite nanorods. Therefore, TiO2–ZnS-3 is expected to have a high gas-sensing response. Notably, further increasing the sacrificial ZnO layer thickness for sulfidation-synthesized TiO2–ZnS composite nanorods did not enhance the gas-sensing response of the composite nanorods. As shown in Fig. 10(a), the composite rods were less free-standing and numerous rods contacted their adjacent counterparts because of heavy loading of ZnS crystallites onto the surfaces of TiO2 rods with the thicker sacrificial ZnO layer after sulfidation. This might have decreased the reactive surfaces of the composite rods for gas-sensing processes. The initially increased contact resistance of the sensor, as shown in Fig. 10(b), supported the composite rods' morphology change with substantially increasing ZnS shell layer thickness and weakened the gas-sensing responses of composite rods with heavy loading ZnS shell layers to only 1.6–1.8 on exposure to 250–750 ppm of ethanol vapor (Fig. 10(c)). Table 1 lists a comparison of the ethanol vapor sensing responses of TiO2–ZnS-3 and other reported TiO2-based heterostructures.22–25 Most TiO2-based composites demonstrate adequate gas-sensing response to ethanol vapor only at high operating temperatures of 270–400 °C. TiO2–ZnS-3 exhibited superior ethanol vapor sensing response compared with other competing heterostructures, and proved the high potential of TiO2–ZnS composite nanorods for application to ethanol vapor detection.
 | ||
| Fig. 10 (a) SEM image of TiO2 nanorods with the 80 nm-thick ZnO sacrificial layer after sulfidation. (b) Dynamic gas-sensing response–recovery curves of TiO2–ZnS nanorods. (c) Gas-sensing responses of TiO2–ZnS nanorods made from 80 nm-thick ZnO sacrificed layer after sulfidation. | ||
Conclusions
ZnO shell layers with different thicknesses were used as a sacrificial layer to form TiO2–ZnS core–shell nanorods by using TAA as a sulfurizing reagent in a hydrothermal reaction. Structural analyses indicate that the ZnO phase was fully converted into the ZnS phase after sulfidation. A relatively thick sacrificial ZnO shell layer on the TiO2 nanorods engendered numerous surface crystal defects on the hydrothermal sulfidation growth shell layers of TiO2–ZnS composite nanorods. The larger number of surface crystal defects in the thick ZnS shell layer of the TiO2–ZnS composite nanorods induced numerous active sites for oxygen ion adsorption. Furthermore, the granular-like ZnS shell layer of a typical TiO2–ZnS composite nanorod is advantageous for the adsorption of gas molecules during a gas-sensing test. The gas-sensing results indicate that the TiO2–ZnS composite nanorods exhibited substantially enhanced ethanol gas-sensing responses compared with pristine TiO2 nanorods. The TiO2–ZnS composite nanorods formed with a 60 nm-thick sacrificial ZnO shell layer demonstrated superior gas-sensing responses relative to sensors made from TiO2–ZnS composite nanorods with other ZnO layer thicknesses. Adequate ZnS crystallite loading content and surface defect density of TiO2–ZnS composite nanorods accounted for the observed results. The present study proposes a simple synthesis method for a granular-like ZnS shell layer that can be integrated into TiO2 nanorods to form TiO2–ZnS heterostructures for gas-sensor applications.Conflicts of interest
There are no conflicts to declare.Acknowledgements
This work is supported by the Ministry of Science and Technology of Taiwan (MOST 105-2628-E-019-001-MY3).References
- Y. C. Liang, N. C. Xu, C. C. Wang and D. H. Wei, Materials, 2017, 10, 778–790 CrossRef PubMed.
- Y. Li, H. Yang, J. Tian, X. Hu and H. Cui, RSC Adv., 2017, 7, 11503–11509 RSC.
- W. Zhou, H. Liu, R. I. Boughton, G. Du, J. Lin, J. Wang and D. Liu, J. Mater. Chem., 2010, 20, 5993–6008 RSC.
- W. H. Lee, C. W. Lai and S. B. A. Hamid, Materials, 2015, 8, 2139–2153 CrossRef.
- J. Li, X. Wang, Y. Shao, X. Lu and B. Chen, Materials, 2014, 7, 6865–6878 CrossRef PubMed.
- J. Tian, Z. Zhao, A. Kumar, R. I. Boughtonc and H. Liu, Chem. Soc. Rev., 2014, 43, 6920–6937 RSC.
- Y. C. Liang and C. C. Wang, J. Alloys Compd., 2018, 730, 333–341 CrossRef.
- G. Shen, P. C. Chen, Y. Bando, D. Golberg and C. Zhou, Chem. Mater., 2008, 20, 6779–6783 CrossRef.
- Y. C. Liang and S. L. Liu, Acta Mater., 2015, 88, 245–251 CrossRef.
- L. Liu, Y. Chen, T. Guo, Y. Zhu, Y. Su, C. Jia, M. Wei and Y. Cheng, ACS Appl. Mater. Interfaces, 2012, 4, 17–23 CrossRef PubMed.
- W. Zhang, S. Wang, Y. Wang, Z. Zhu, X. Gao, J. Yang and H. X. Zhang, RSC Adv., 2015, 5, 2620–2629 RSC.
- Y. C. Liang and C. C. Wang, RSC Adv., 2018, 8, 5063–5070 RSC.
- K. S. Ranjith, A. Senthamizhan, B. Balusamy and T. Uyar, Catal. Sci. Technol., 2017, 7, 1167–1180 RSC.
- A. Brayek, S. Chaguetmi, M. Ghoul, I. B. Assaker, A. Souissi, L. Mouton, P. Beaunier, S. Nowak, F. Mammeri, R. Chtourou and S. Ammar, RSC Adv., 2016, 6, 30919–30927 RSC.
- H. Wu, K. Kan, L. Wang, G. Zhang, Y. Yang, H. Li, L. Jing, P. Shen, L. Li and K. Shi, CrystEngComm, 2014, 16, 9116–9124 RSC.
- L. Wang, J. Deng, Z. Lou and T. Zhang, J. Mater. Chem. A, 2014, 2, 10022–10028 RSC.
- Y. C. Liang, C. M. Lee and Y. J. Lo, RSC Adv., 2017, 7, 4724–4734 RSC.
- Y. C. Liang, T. W. Lung and C. C. Wang, Nanoscale Res. Lett., 2016, 11, 505–510 CrossRef PubMed.
- Z. G. Chen, J. Zou, G. Liu, H. F. Lu, F. Li, G. Q. Lu and H. M. Cheng, Nanotechnology, 2008, 19, 055710 CrossRef PubMed.
- X. H. Liu, P. F. Yin, S. A. Kulinich, Y. Z. Zhou, J. Mao, T. Ling and X. W. Du, ACS Appl. Mater. Interfaces, 2017, 9, 602–609 CrossRef PubMed.
- S. Hussain, T. Liua, M. S. Javedc, N. Aslame and W. Zeng, Sens. Actuators, B, 2017, 239, 1243–1250 CrossRef.
- Y. J. Chen, G. Xiao, T. S. Wang, F. Zhang, Y. Ma, P. Gao, C. L. Zhu, E. Zhang, Z. Xu and Q. H. Li, Sens. Actuators, B, 2011, 156, 867–874 CrossRef.
- C. L. Zhu, H. Long Yu, Y. Zhang, T. S. Wang, Q. Y. Ouyang, L. H. Qi, Y. J. Chen and X. Y. Xue, ACS Appl. Mater. Interfaces, 2012, 4, 665–671 CrossRef PubMed.
- H. Zhang, S. Wang, Y. Wang, J. Yang, X. Gao and L. Wang, Phys. Chem. Chem. Phys., 2014, 16, 10830–10836 RSC.
- G. J. Sun, H. Kheel, S. Park, S. Lee, S. E. Park and C. Lee, Ceram. Int., 2016, 42, 1063–1069 CrossRef.
| This journal is © The Royal Society of Chemistry 2018 |