 Open Access Article
The utilization of a stable 2D bilayer MOF for simultaneous study of luminescent and photocatalytic properties: experimental studies and theoretical analysis†
Xiren Wu‡
a,
Xin Shen‡a,
Shuran Fana,
Manoj Trivedi b,
Boahong Li*a,
Abhinav Kumar
 *c and
Jianqiang Liu
 *a
*a
aDongguan Key Laboratory of Drug Design and Formulation Technology, Key Laboratory of Research and Development of New Medical Materials of Guangdong Medical University, School of Pharmacy, Guangdong Medical University, Dongguan, 523808, P. R. China. E-mail: gdmcli@126.com; jianqiangliu2010@126.com; Fax: +86-29-22896561; Tel: +86-29-22896561
bDepartment of Chemistry, University of Delhi, Delhi, India
cDepartment of Chemistry, Faculty of Science, University of Lucknow, Lucknow 226 007, India. E-mail: abhinavmarshal@gmail.com
First published on 28th June 2018
Abstract
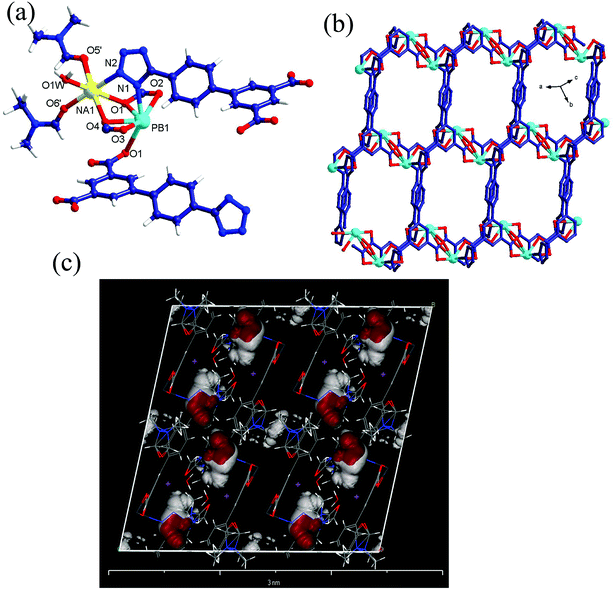
A new Pb(II)-based 2D MOF comprising π-conjugated ligand 4′-(1H-tetrazol-5-yl)-[1,1′-biphenyl]-3,5-dicarboxylic acid (TZBPDC) and having the formula {[PbNa(TZBPDC)](H2O)(DMF)2}n (1) has been synthesized. Structural characterization of 1 indicates that the MOF has a 4-connected (4,4) motif. The photoluminescent investigation indicates that 1 can behave as potential luminescent sensor for the detection of nitroaromatic compounds (NACs), especially 2,4-dinitrophenol (2,4-DNP) and ferric ions, through the decrease in its luminescence intensity. Additionally, 1 also displays excellent capacity for the photodegradation of methylene orange (MO), which is a constituent of wastewater discharge. The most plausible mechanisms for the decrease in the luminescent intensity of 1 in the presence of different NACs have been explored though theoretical calculations, and the photocatalysis of 1 for organic dyes has been addressed using density of states (DOS) and partial DOS calculations.
Introduction
Recently, significant amount of attention has been paid toward the syntheses of solid materials that are based on multidimensional metal–organic frameworks (MOFs), because these materials have numerous applications in a variety of scientific areas.1–3 Despite tremendous advancements in the field of MOFs, the systematic and rational syntheses of MOFs for the introduction of more complex functionalities in the targeted products is still a huge challenge. The strategy of introducing functional groups in the organic ligands has now been proven to be an effective approach to construct MOFs that exhibit the desired properties.4–6 In particular, by employing tetrazole-type ligands, one can synthesize targeted MOFs that can realize high storage and high selectivity toward gases.7 However, the crystallinity and stability of MOFs are still challenging aspects for material scientists trying to seek multi-aperture features. The rational selection of metal ions and ligands in the syntheses of MOFs is very essential to synthesize MOFs that can deliver high stability and outstanding crystallinity.8–11Organic ligands often contain aromatic or conjugated π-moieties; when they are subjected to excitation through irradiation, they can give rise to optical emissions or photoluminescence. In addition, the metal components, especially lanthanides or d10-metals, can also contribute towards photoluminescence.9 Moreover, some studies have established MOFs as photocatalysts, co-catalysts, and hosts for photo-redox catalysis in accordance with their different functions in the photocatalytic systems. The application of MOFs for the photocatalytic degradation of organic pollutants has been thoroughly reviewed, and it has now been established that the photocatalysis in MOFs emerges because of the presence of catalytically active metals and/or functional organic linkers.11 Thus, the rational selection of metal ions and ligands in the syntheses of MOFs is of great importance to afford MOFs that can offer good stability, thus ensuring unaltered structures during applications.9
Considering the above-mentioned concerns, we have chosen 4′-(1H-tetrazol-5-yl)-[1,1′-biphenyl]-3,5-dicarboxylic acid (H3TZBPDC) as a ligand, which is an effective building block for three main reasons: (1) it displays many potential coordination modes (Scheme 1),12 thereby allowing a platform for the construction of diverse materials; (2) its backbone involves both soft and hard coordination sites (tetrazole and carboxylic acid, respectively), which may form much stronger metal–N bonds than metal–O bonds; (3) the electron-rich π-conjugated backbone can shift the absorption wavelength and promote charge transfer interactions of the resulting architecture, which is promising for the development of luminescent probes and visible-light photocatalysts (Scheme 1).13,14
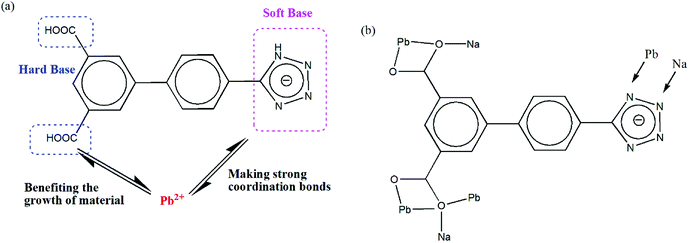 | ||
| Scheme 1 (a) Illustration for the rational design of Pb2+-based materials, (b) the coordination modes of the ligand involving carboxylate and tetrazole groups. | ||
Keeping the aforementioned points in mind and in our continuous quest for the development of functionalized MOFs,15 we are reporting herein a new 2D Pb2+-based MOF {[PbNa(TZBPDC)](H2O)(DMF)2}n (1), which has been synthesized under hydrothermal conditions. The MOF 1 has been used as a potential luminescent sensor for the detection of nitroaromatics as well as Fe3+ ions. Additionally, the photocatalytic activity of 1 for dye degradation under UV-light irradiation has been studied. The results of these investigations are presented herein.
Materials and method
General considerations
All chemicals were obtained from commercial sources and used without further purification. Powder X-ray diffraction (PXRD) data were collected on a Bruker D8 ADVANCE X-ray diffractometer equipped with Cu-Kα radiation (λ = 1.5418 Å) at 50 kV, 20 mA with a scanning rate of 6° min−1 and a step size of 0.02°. The simulated powder patterns for 1 were obtained using Mercury 2.0. Samples were formed as KBr pellets, and Fourier transform infrared (FT-IR) spectra were recorded using Nicolet Impact 750 FTIR in the range of 400–4000 cm−1. The thermogravimetric analysis (TGA) was performed under nitrogen atmosphere from room temperature to 650 °C at a heating rate of 10 °C min−1 using a SDT Q600 thermogravimetric analyzer.X-ray crystallography
The single crystal X-ray diffraction data collections were carried out on a Bruker SMART APEX diffractometer equipped with a graphite monochromated Mo-Kα radiation (λ = 0.71073 Å) by using the ω-scan technique. The intensities against the absorption effects were corrected by using SADABS. The structure was solved by direct method (SHLEXS-2014) and refined using the full-matrix least-squares procedure based on F2 (Shelxl-2014).16 All hydrogen atoms were generated geometrically and refined isotropically using the riding model. All non-hydrogen atoms were refined with anisotropic displacement parameters. Crystallographic details and selected bond dimensions for 1 are listed in Tables S1 and S2. CCDC number: 1832866.†Synthesis
Photoluminescence measurements
The photoluminescence properties of 1 were investigated in H2O/DMF suspensions at room temperature using an RF-5301PC spectrofluorophotometer. These suspensions were prepared by adding 5 mg of finely divided 1 into 3 mL of H2O/DMF and then ultrasonicating the mixture for 30 min before testing.Photocatalysis
Fifty mg of 1 was dispersed in 50 mL aqueous solutions of MO/Rh B (10 mg L−1) under stirring in dark for 30 min to ensure the establishment of an adsorption–desorption equilibrium. Thereafter, the mixture was exposed to UV irradiation from a Hg lamp (250 W) and kept under continuous stirring during irradiation for 100 min. Samples of 5 mL were taken out every 10 min, and they were collected by centrifugation for analysis by a UV-Vis spectrometer. Additionally, a simple control experiment was also performed under similar reaction conditions without the addition of catalyst.Computational details
Density functional theory (DFT) calculations were performed to get information about the mechanism related to the decrease in the luminescent intensity of 1 in the presence of NACs as well as the photocatalytic properties and to ascertain the nature of the highest occupied molecular orbitals (HOMO) and lowest unoccupied molecular orbitals (LUMO) of different analytes, the ligand H3TZBPDC and MOF 1. The geometry optimizations were performed using the B3LYP exchange-correlation functional.17 For all atoms except Pb, the 6-31G** basis set was used, whereas for Pb, the CEP-121G basis set was employed for geometry optimization. All calculations were performed using the Gaussian 09 programme.18a GaussSum 3.1 was used to obtain density of state (DOS) plots.18bResults and discussion
Crystal structure
Luminescent sensing
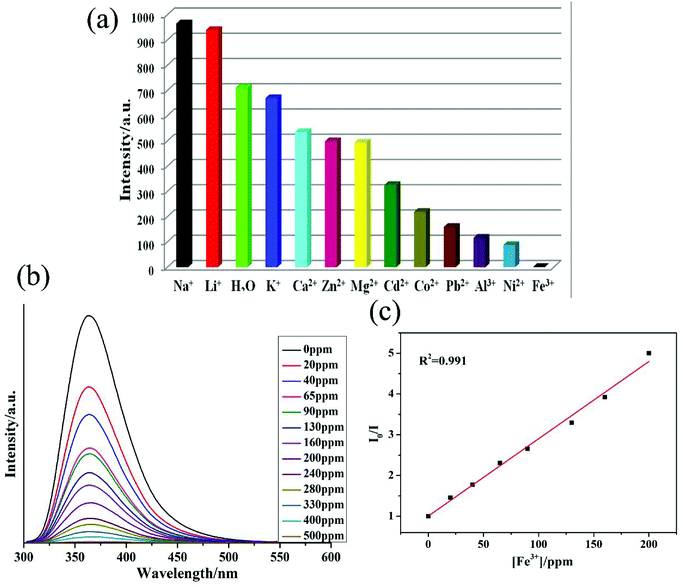
The purity of 1 was confirmed by similarities between simulated and experimental powder X-ray diffraction (PXRD) patterns (Fig. S2†). The thermal stability of 1 was also determined by thermogravimetric analysis, which indicated that MOF 1 undergoes gradual weight loss of 22.7% (calculated = 25.6%) up to 335 °C, which corresponds to the loss of 2 DMF and 1 H2O molecules. The frameworks collapsed at around 400 °C (Fig. S3†).Taking into account the excellent luminescent properties of MOFs based on inert pair configuration containing metal centers and π-conjugated ligands, fluorescences of 1 and H3TZBPDC ligand were investigated in the solid state (Fig. S4 and S5†). Upon excitation at λex = 310 nm, 1 showed strong luminescent emission with maxima at λem = 460 (Fig. S5†). The weak emission of the H3TZBPDC ligand was observed at 415 nm when the ligand was excited at λex = 335 nm (Fig. S4†). The emission band for 1 may be due to ligand-to-metal charge transfer (LMCT).20 The most significant structural feature of 1 is the presence of free Lewis basic sites, due to which it can be a prospective candidate for sensing functions to recognize metal ions. The luminescence spectra of 1 dispersed in aqueous solution containing the same concentrations (10−2 M) of M(NO3)x were investigated (Fig. 2a and S6†). Interestingly, Fe3+ ions displayed significant alleviation effect on the luminescence intensity of 1, whereas the Li+ and Na+ ions exhibited enhancement effect on the luminescence intensity. The unique luminescent alleviation effect of Fe3+ ions in 1 was possibly because of the stronger affinity of tetrazole N atoms of TZBPDC ligand toward Fe3+. This Fe3+–tetrazole interaction reduced the efficiency of energy transfer from TZBPDC linkers to Pb2+ centers, thus decreasing the luminescence intensity.21
When the concentration of Fe3+ ions increased in the suspension of 1, its luminescent intensity decreased. To explore the sensitivity of 1 towards Fe3+ ions, concentration gradient experiments were performed by changing the concentrations of Fe3+ solutions from 0 to 500 ppm (Fig. 2b). It was evident that the luminescence intensities of Fe3+@1 solutions gradually decreased with the increase in the concentration of Fe3+ ions (Fig. 2b). Furthermore, the fluorescence lifetime of 56.9 ns for 1 reduced to 5.5 ns in the presence of 1.0 mM Fe3+ ions (Fig. S7†). Hence, it can be concluded that energy transfer may be responsible for the alleviation in the luminescent intensity. Moreover, to elucidate the possible mechanism for luminescence quenching in 1 by Fe3+ ions, O1s and N1s X-ray photoelectron spectroscopy (XPS) studies were carried out on 1 and Fe3+@1 (Fig. S8–S10†). For 1, the O1s and N1s peaks corresponding to the oxygen atoms of coordinated carboxylate and free nitrogen atoms from tetrazole ring were observed at 531.31 eV and 401.62 eV, and these peaks shifted to 532.46 eV and 402.18 eV, respectively, upon the addition of Fe3+ (Fig. S8†). These slight shifts in the O1s and N1s peaks indicated weak binding of N/O centres of 1 to Fe3+.
The Stern–Volmer plot for Fe3+ is nearly linear at low concentrations with a Ksv value of 7.67 × 10³ M−1 (Fig. 2c), which is comparable to that of the previously reported MOF-based sensors (Table S3†).21 On the basis of this plot, the Fe3+ detection limit is calculated to be 1.15 ppm. According to the previous reports,22 the possible sensing mechanism for luminescence quenching by Fe3+ has been further investigated. To date, several explanations for such quenching effects on luminescence have been explored: (1) the collapse of the framework,22a–22d (2) the resonance energy transfer, (3) the weak interaction between metal ions and the heteroatoms within the organic ligands.22e,22f Hence, the UV-Vis absorption spectra for M(NO3)x solutions have been recorded (Fig. S12†). The UV-Vis spectrum of Fe3+ solution displays significant overlap with the luminescent spectrum of 1. Therefore, the competitive absorption of excitation wavelength energy between aqueous Fe3+ solution and 1 may also be responsible for the quenching effect. In addition, the luminescence lifetime of 1 has a decay time of 5.5 ns, which also indicates that the energy transfer from the ligand to Pb center has been restrained to a certain extent (Fig. S7†). Finally, the X-ray photoelectron spectroscopy (XPS) experiment on Fe3+@1 shows that the typical energy of Fe 2p1 shifts to 779.08 eV, resulting in clear increase compared with the standard value, thus demonstrating the interaction between Fe3+ and 1 (Fig. S8–S10†). The powder X-ray diffraction (PXRD) patterns (Fig. S2†) indicate possible structural and/or symmetry changes within the crystal structure of 1 upon dispersion in the Fe3+ ion solution; notably, these changes are consistent across all metal solutions as well as when 1 is soaked in NAC solutions.
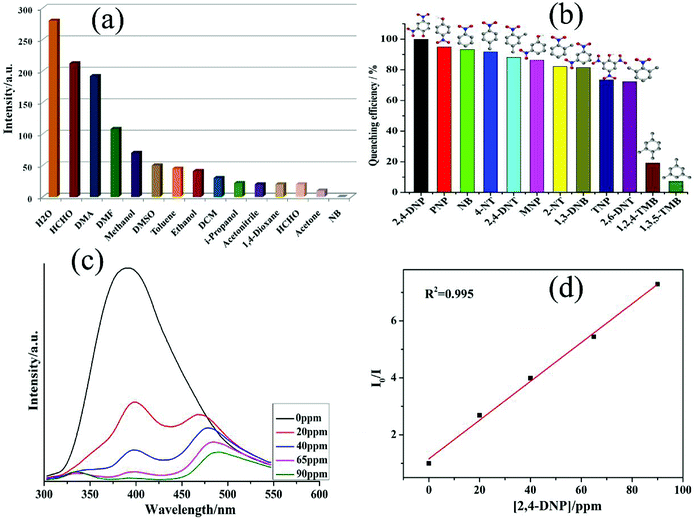
The fluorescence response of 1 towards small molecules was also examined in DMF suspensions of 1 by the addition of different organic molecules.23–25 It was observed that NB was able to alleviate the emission of 1 effectively (Fig. 3a). The different kinds of aromatic compounds (ACs) used in the investigation were 2,4,6-trinitrophenol (TNP), 2,4-dinitrotoluene (2,4-DNT), 2,6-dinitrotoluene (2,6-DNT), 2-nitrotoluene (2-NT), 4-nitrotoluene (4-NT), 1,3-dinitrobenzene (1,3-DNB), 1,2,4-trimethylbenzene (1,2,4-TMB), 1,3,5-trimethylbenzene (1,3,5-TMB), o-nitrophenol (ONP), p-nitrophenol (PNP), and 2,4-dinitrophenol (2,4-DNP). All the twelve ACs could decrease the luminescent intensity of 1 to a different extent, and the order of quenching efficiency is 2,4-DNP > NB ≈ 4-NT > 2,4-DNT > MNP > 2-NT > 1,3-DNB > TNP > 2,6-DNT > 1,2,4-TMB > 1,3,5-TMB (Fig. 3b). Furthermore, the fluorescence intensity decreased steadily along with the increase in the concentrations of 2,4-DNP. Additionally, upon the addition of 90 ppm of 2,4-DNP, the fluorescence intensity of 1 was almost negligible (Fig. 3c).25 The absorption spectrum of the 2,4-DNP solution displayed a large overlap with the luminescent spectrum of 1 (Fig. S12†). The emission studies of 1 showed excellent selectivity toward 2,4-DNP, and the addition of 2,4-DNP resulted in quenching of the original emission band and the appearance of a new peak at 480 nm (Fig. 3c). The emergence of this new peak was observed because 2,4-DNP interacted with the triazole group. This shift/quenching of the emission wavelength might be ascribed to the interaction between 2,4-DNP and 1 and the intramolecular charge-transfer process. Additionally, upon addition of 1,3,5-TMB and 1,2,4-TMB, the fluorescence intensity of 1 remained almost unaffected (Fig. 3b). However, all other nitro-aromatics showed effects to different extents on the fluorescence intensity of 1 (Fig. 3b and S13–S34†). Hence, these results demonstrated that 1 possessed selectivity for 2,4-DNP in the presence of different NACs.
The fluorescence quenching efficiency can quantitatively be explained with the help of the Stern–Volmer (SV) equation: (I0/I) = 1 + Ksv[Q]. The Stern–Volmer plot for 2,4-DNP is nearly linear at low concentrations with the Ksv value of 1.25 × 10⁴ (Fig. 3d). The 2,4-DNP detection limit is calculated to be 0.88 ppm based on the 3δ/slope. Therefore, 1 can be used to distinguish NACs having electron-donor and electron-withdrawing substituents.26–28 Considering the sizes of NACs and small pores in this MOF, we can neglect the possibility of the accommodation of these analytes in the pores of MOF. The luminescence attenuation in the case of 1 can be due to the polarizability of 2,4-DNP and the π–π interactions between the analytes and the host framework.
The luminescence intensities in the case of 1 weakened to different magnitudes when different NACs were added. To explain this decline in the luminescence intensity, the HOMO–LUMO energies of all the aromatic compounds utilized in this investigation as well as those of 1 and the H3L ligand were computed by using the density functional theory (DFT) at the B3LYP level (Table 1, Fig. S37†).
| Ligand/analyte | HOMO | LUMO |
|---|---|---|
| H3L | −6.45 | −1.81 |
| 1 | −2.21 | −1.13 |
| 2-Nitrotoluene (2-NT) | −7.28 | −2.32 |
| 4-Nitrotoluene (4-NT) | −7.36 | −2.32 |
| Nitrobenzene (NB) | −7.60 | −2.43 |
| 2,6-Dinitrotoluene (2,6-DNT) | −7.91 | −2.87 |
| 2,4-Dinitrotoluene (2,4-DNT) | −8.11 | −2.98 |
| 1,3-Dinitrobenzene (1,3-DNB) | −8.42 | −3.14 |
| 2,4,6-Trinitrophenol (TNP) | −8.54 | −3.55 |
| 1,2,4-TMB | −6.03 | 0.28 |
| 1,3,5-TMB | −6.18 | 0.26 |
| 2,4-DNP | −7.62 | −3.33 |
| o-Nitrophenol | −6.80 | −2.72 |
| p-Nitrophenol | −7.43 | −2.39 |
The plausible reason for the decline in luminescence intensity of MOFs after the addition of NACs may be the charge transfer, which takes place from MOF to the LUMO of the aromatic analytes. To facilitate this charge transfer, the LUMO of MOF should have higher energy level in comparison to the LUMOs of the acceptor analytes.29−31 As evident from the LUMO energy parameters of 1 as well as those of NACs presented in Table 1, the LUMO energy levels for all NACs are low in comparison to those of 1 and hence, they can accept charge density from photo-excited 1. Therefore, this charge transfer results in the decline in luminescence intensity of 1 in the presence of these NACs. Furthermore, Table 1 indicates that the aromatic compounds that do not have nitro functions have relatively higher LUMO levels in comparison to 1 and hence cannot accept the charge from photo-excited 1. Therefore, 1,2,4-TMB and 1,3,5-TMB have negligible effects on the luminescence intensity of 1. However, the observed order of degradation in luminescence intensity of 1 by NACs is not in accordance with the corresponding LUMO energy levels of NACs. Hence, charge transfer is not the sole phenomenon responsible for the decline in the luminescence intensity. In addition to electron/energy transfer phenomenon, there may be weak interactions present between 1 and NACs, which contribute to the decrease in the luminescence intensity.27 This may be the probable reason that 1,2,4-TMB and 1,3,5-TMB, although having relatively higher LUMO levels than 1, impose some effect on the luminescence intensity of 1. Additionally, there may also be certain constraints related to the transition probability of 1; for instance, NACs may inhibit linker motions (in the excited state) in 1, which may be responsible for the decline in fluorescence intensity.27a,b
UV-vis diffuse reflectance spectra
UV-Vis diffuse reflectance spectrum of 1 is presented in Fig. S35,† and the spectrum in the form of R% (reflectance) versus wavelength is shown in Fig. S36.† 1 displays broad absorption in the visible region of the electromagnetic spectrum. The band gap of 1 can be determined between the energy axis (hν) and the line extrapolated from the linear portion of the adsorption edge in the plots of the Kubelka–Munk function (F(R)) versus energy (hν). The final result is estimated to be 3.15 eV. This wide band gap indicates that 1 may behave like a semiconducting material.Photocatalytic activities
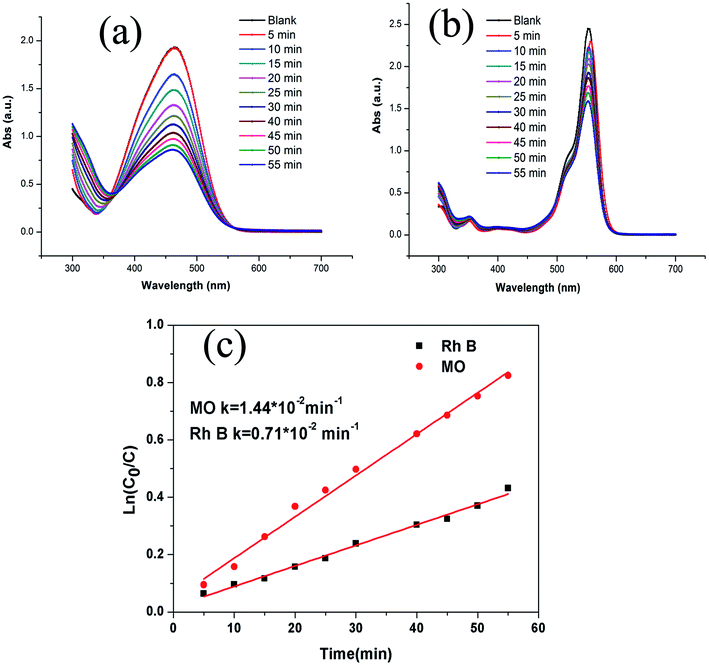
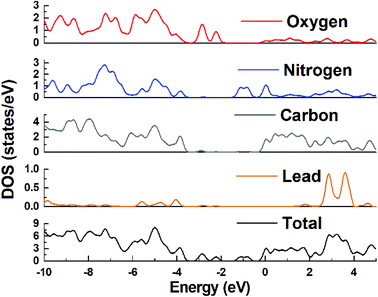
The presence of visible region transitions motivated us to explore photocatalytic applications of 1 toward aromatic dyes, viz., methyl orange (MO) and rhodamine B (RhB) under UV irradiation. The absorption peaks of MO and RhB were found to decrease with an increase in the reaction time with 1 (Fig. 4a and b). The calculated results showed that the conversion rates of MO and RhB were 72.8% and 53.5%, respectively, under UV irradiation. For comparison, the total catalytic degradation efficiency of the control experiment was also explored. The degradation rates of MO and RhB were only 11.9% and 20.4%, respectively, during 55 min period under the same condition in the absence of the catalyst. The kinetic data for the degradation of MO and RhB could be well fitted by the apparent first-order rate equation, and the rate constants under UV irradiation were found to be 0.0144 min−1 and 0.007 min−1, respectively (Fig. 4c). These results demonstrated that the presence of 1 is necessary for the degradation of MO and RhB. Additionally, the photodegradation of MO in the presence of 1 was observed to be much higher than that of RhB. Thus it can be concluded that 1 can be chosen as a potential photocatalyst to photodegrade MO.32The plausible photocatalytic degradation mechanisms associated with the organic dyes using the photocatalyst 1 have been addressed with the assistance of band structure calculations for MOF 1. The density of states (DOS) and partial DOS plots presented in Fig. 5 indicate that the main contribution in valence band, which is present just below the Fermi level, is mainly coming from the carboxylate oxygen and aromatic carbons of TZBPDC moiety with small contributions coming from Pb(II) and nitrogen centers. Also, the conduction band lying just above the Fermi level in the range of −1.4 to −0.6 eV is derived from the nitrogen centers of aromatic tetrazole moieties of the TZBPDC ligand. Therefore, the electronic transition in 1 mainly takes place from the carboxylate group containing an aromatic center to nitrogen containing tetrazole aromatic region (ligand-to-ligand). On the basis of band structure calculations, it can be inferred that in the photocatalysis step, 1 can be excited to produce electron–hole pairs under visible light irradiation; the hole moves to the carboxylate group containing aromatic centers, and the electron migrates to the tetrazole entity. The generation of holes on the carboxylate group containing aromatic centers corresponds to its oxidation; it is now capable of oxidizing the dye to re-reduce back.
Conclusion
The newly synthesized luminescent Pb(II)-based MOFs displayed dual sensing properties for the detection of ferric ions and nitro-aromatics, particularly against 2,4-DNP, with low detection limits. Also, 1 displayed photocatalytic degradations of methyl orange and Rhodamine B dyes, and the MOF was capable of photodegrading methyl orange up to 72.8%. The computations based on DFT methods indicated both charge transfer as well as weak interactions operating between 1 and NACs, which may be responsible for the decrement in the luminescence intensity of 1. Additionally, the DOS calculations revealed that on irradiation, the holes in 1 moved to the carboxylate aromatic entity of the ligand, and the electrons moved towards the tetrazole moiety; the generation of holes at these centers induced the oxidation of organic dyes with simultaneous reduction of the hole-containing centers.Conflicts of interest
The authors declare no competing conflict of interest.Acknowledgements
This work was partially supported by the grants from NSF of China (21701033), Innovative Entrepreneurial Training Plan of undergraduates in Guangdong Province (201710571005, 201710571007; 201710571012; 201710571016; 201710571008; 201710571020, 201710571060) and Innovation experiment project of Guangdong Medical University (ZYDM024), Special Funds for Scientific and Technological Innovation of undergraduates in Guangdong Province (pdjha0218, pdjha0219, pdjha0226), Guangdong Medical university Research Grants (M2015031).References
- (a) J. Guo, J. Yang, Y. Y. Liu and J. F. Ma, CrystEngComm, 2012, 14, 6609–6617 RSC; (b) L. L. Wen, L. Zhou, B. G. Zhang, X. G. Meng, H. Qu and D. F. Li, J. Mater. Chem., 2012, 22, 22603–22609 RSC; (c) U. Mueller, M. Schubert, F. Teich, H. Puetter, K. Schierle-Arndt and J. Pastre, J. Mater. Chem., 2006, 16, 626–636 RSC; (d) J. Y. Lee, O. K. Farha, J. Roberts, K. A. Scheidt, S. B. T. Nguyen and J. T. Hupp, Chem. Soc. Rev., 2009, 38, 1450–1459 RSC.
- (a) J. Y. Sun, L. H. Weng, Y. M. Zhou, J. X. Chen, Z. X. Chen, Z. C. Liu and D. Y. Zhao, Angew. Chem., Int. Ed., 2002, 41, 4471–4473 CrossRef; (b) J. Zhang, Y. Kang, R. B. Zhang, Z. J. Li, J. K. Cheng and Y. G. Yao, CrystEngComm, 2005, 7, 177–178 RSC; (c) Z. S. Qin, W. W. Dong, J. Zhao, Y. P. Wu, Q. C. Zhang and D. S. Li, Inorg. Chem. Front., 2018, 5, 120–126 RSC; (d) Z. H. Zhou, W. W. Dong, Y. P. Wu, J. Zhao, D. S. Li, T. Wu and X. H. Bu, Inorg. Chem., 2018, 57, 3833–3839 CrossRef PubMed; (e) Y. P. Wu, W. Zhou, J. Zhao, W. W. Dong, Y. Q. Lan, D. S. Li, C. H. Sun and X. H. Bu, Angew. Chem., Int. Ed., 2018, 56, 13001–13005 CrossRef PubMed; (f) L. F. Zou, S. Yao, J. Zhao, D. S. Li, G. H. Li, Q. S. Huo and Y. L. Liu, Cryst. Growth Des., 2017, 17, 3556–3561 CrossRef.
- (a) J. R. Li, J. Sculley and H. C. Zhou, Chem. Rev., 2012, 112, 869–932 CrossRef PubMed; (b) Y. Peng, V. Krungleviciute, I. Eryazici, J. T. Hupp, O. K. Farha and T. Yildirim, J. Am. Chem. Soc., 2013, 135, 11887–11894 CrossRef PubMed; (c) Z. Wang and S. M. Cohen, Chem. Soc. Rev., 2009, 38, 1315–1329 RSC; (d) J. Pang, F. Jiang, M. Wu, C. Liu, K. Su, W. Lu, D. Yuan and M. Hong, Nat. Commun., 2015, 6, 7575–7581 CrossRef PubMed; (e) B. Chen, S. Xiang and G. Qian, Acc. Chem. Res., 2010, 43, 1115–1124 CrossRef PubMed.
- (a) B. Mu, C. X. Li, M. Song, Y. L. Ren and R. D. Huang, CrystEngComm, 2016, 18, 3086–3094 RSC; (b) Z. L. Liao, G. D. Li, M. H. Bi and J. S. E. Chen, Inorg. Chem., 2008, 47, 11–13 CrossRef PubMed; (c) X. L. Wang, J. J. Huang, L. L. Liu, G. C. Liu, H. Y. Lin, J. W. Zhang, N. L. Chen and Y. Qu, CrystEngComm, 2013, 15, 1960–1969 RSC.
- (a) D. S. Chen, H. Z. Xing, Z. M. Su and C. G. Wang, Chem. Commun., 2016, 52, 2019–2022 RSC; (b) T. T. Fan, J. J. Li, X. L. Qu, H. L. Han and X. Li, CrystEngComm, 2015, 17, 9443–9451 RSC.
- (a) H. X. Yang, T. F. Liu, M. N. Cao, H. F. Li, S. Y. Gao and R. Cao, Chem. Commun., 2010, 46, 2429–2431 RSC; (b) J. X. Meng, Y. Lu, Y. G. Li, H. Fu and E. B. Wang, CrystEngComm, 2011, 13, 2479–2486 RSC; (c) J. Guo, J. Yang, Y. Y. Liu and J. F. Ma, CrystEngComm, 2012, 14, 6609–6617 RSC.
- (a) Q. Huang, J. H. Huang, L. Gu, J. X. Ruan, Y. H. Yu and J. S. Gao, RSC Adv., 2018, 8, 557–566 RSC; (b) G. A. Senchyk, A. B. Lysenko, I. Boldog, E. B. Rusanov, A. N. Chernega, H. Krautscheid and K. V. Domasevitch, Dalton Trans., 2012, 41, 8675–8689 RSC.
- (a) J. Zhang, L. Gong, J. Feng, J. Wu and C. Zhang, New J. Chem., 2017, 41, 8107–8117 RSC; (b) H. R. Yan, J. Wang, Y. H. Yu, G. F. Hou, H. X. Zhang and J. S. Gao, RSC Adv., 2016, 6, 71206–71213 RSC.
- Z. Hu, B. J. Deibert and J. Li, Chem. Soc. Rev., 2014, 43, 5815–5840 RSC.
- (a) M. K. Sharma and P. K. Bharadwaj, Inorg. Chem., 2011, 50, 1889–1897 CrossRef PubMed; (b) Y. G. Huang, F. L. Jiang and M. C. Hong, Coord. Chem. Rev., 2009, 253, 2814–2834 CrossRef; (c) F. Wang, Z. S. Liu, H. Yang, Y. X. Tan and J. Zhang, Angew. Chem., Int. Ed., 2011, 50, 450–453 CrossRef PubMed.
- (a) L. L. Wen, F. Wang, J. Feng, K. L. Lv, C. G. Wang and D. F. S. Li, Cryst. Growth Des., 2009, 9, 3581–3589 CrossRef; (b) K. L. Lv and Y. M. Xu, J. Phys. Chem. B, 2006, 110, 6204–6212 CrossRef PubMed; (c) L. L. Wen, J. B. Zhao, K. L. Lv, Y. H. Wu, K. J. Deng, X. K. Leng and D. F. Li, Cryst. Growth Des., 2012, 12, 1603–1612 CrossRef; (d) S. B. Wang and X. C. Wang, Small, 2015, 11, 3097–3112 CrossRef PubMed; (e) C. C. Wang, J. R. Li, L. Lv, Y. Q. Zhang and G. Guo, Energy Environ. Sci., 2014, 7, 2831–2850 RSC.
- (a) Y. L. Hu, M. L. Ding, X. Q. Liu, L. B. Sun and H. L. Jiang, Chem. Commun., 2016, 52, 5734–5737 RSC; (b) Y. F. Kang, J. Q. Liu, B. Liu, W. T. Zhang, Q. Liu, P. Liu and Y. Y. Wang, Cryst. Growth Des., 2014, 14, 5466–5476 CrossRef.
- X. Y. Chen, B. Zhao, W. Shi, J. Xia, P. Cheng, D. Z. Liao, S. P. Yan and Z. H. Jiang, Chem. Mater., 2005, 17, 2866–2874 CrossRef.
- Z. Y. Fu, J. L. Yi, Y. Chen, S. J. Liao, N. Guo, G. D. Yang, Y. X. Lian and X. T. Wu, Eur. J. Inorg. Chem., 2008, 628–634 CrossRef.
- (a) J. C. Jin, J. Wu, W. C. Liu, A. Q. Ma, J. Q. Liu, A. Singh and A. Kumar, New J. Chem., 2018, 42, 2767–2775 RSC; (b) J. Wu, B. H. Li, H. R. Zhong, S. W. Qiu, Y. W. Liang, X. Y. Zhuang, A. Singh and A. Kumar, J. Mol. Struct., 2018, 1158, 264–270 CrossRef; (c) J. Wang, X. R. Wu, J. Q. Liu, B. H. Li, A. Singh, A. Kumar and S. R. Batten, CrystEngComm, 2017, 19, 3519–3525 RSC; (d) A. Q. Ma, F. Ke, J. Jiang, Q. Y. Yuan, Z. D. Luo, J. Q. Liu and A. Kumar, CrystEngComm, 2017, 19, 2172–2177 RSC; (e) J. Q. Liu, G. L. Liu, C. Y. Gu, W. C. Liu, J. W. Xu, B. H. Li and W. J. Wang, J. Mater. Chem. A, 2016, 4, 11630–11634 RSC; (f) J. Q. Liu, Y. Y. Wang, T. Wu and J. Wu, CrystEngComm, 2012, 14, 2906–2913 RSC; (g) J. Q. Liu, J. Wu, Y. Y. Wang, J. T. Lin and H. Sakiyama, CrystEngComm, 2014, 16, 3103–3112 RSC; (h) J. Q. Liu, J. Wu, Z. B. Jia, H. L. Chen, Q. L. Li, H. Sakiyama, T. Soares, R. Fei, C. Daiguebonne, O. Guillou and S. W. Ng, Dalton Trans., 2014, 43, 17265–17273 RSC; (i) L. Lu, J. Wu, J. Wang, J. Q. Liu, B. H. Li, A. Singh, A. Kumar and S. R. Batten, CrystEngComm, 2017, 19, 7057–7067 RSC.
- G. M. Sheldrick, SHELXT – Integrated space-group and crystal-structure determination, Acta Crystallogr., Sect. A: Found. Adv., 2015, 71, 3–8 CrossRef PubMed.
- (a) A. D. Becke, J. Chem. Phys., 1993, 98, 5648–5652 CrossRef; (b) C. T. Lee, W. T. Yang and R. G. Parr, Phys. Rev. B: Condens. Matter Mater. Phys., 1998, 37, 785–789 CrossRef.
- (a) M. J. Frisch; G. W. Trucks; H. B. Schlegel; G. E. Scuseria; M. A. Robb; J. R. Cheeseman; A. J. Montgomery; T. Vreven Jr; K. N. Kudin; J. C. Burant; J. M. Millam; S. S. Iyengar; J. Tomasi; V. Barone; B. Mennucci; M. Cossi; G. Scalmani; N. Rega; G. A. Petersson; H. Nakatsuji; M. Hada; M. Ehara; K. Toyota; R. Fukuda; J. Hasegawa; M. Ishida; T. Nakajima; Y. Honda; O. Kitao; H. Nakai; M. Klene; X. Li; J. E. Knox; H. P. Hratchian; J. B. Cross; V. Bakken; C. Adamo; J. Jaramillo; R. Gomperts; R. E. Stratmann; O. Yazyev; A. J. Austin; R. Cammi; C. Pomelli; J. W. Ochterski; P. Y. Ayala; K. Morokuma; G. A. Voth; P. Salvador; J. J. Dannenberg; V. G. Zakrzewski; S. Dapprich; A. D. Daniels; M. C. Strain; O. Farkas; D. K. Malick; A. D. Rabuck; K. Raghavachari; J. B. Foresman; J. V. Ortiz; Q. Cui; A. G. Baboul; S. Clifford; J. Cioslowski; B. B. Stefanov; G. Liu; A. Liashenko; P. Piskorz; I. Komaromi; R. L. Martin; D. J. Fox; T. Keith; M. A. Al-Laham; C. Y. Peng; A. Nanayakkara; M. Challacombe; P. M. W. Gill; B. Johnson; W. Chen; W. M. Wong; C. Gonzalez and J. A. PopleGaussian, Inc., Wallingford CT, 2009; (b) N. M. O'Boyle, A. L. Tenderholt and K. M. Langner, J. Comput. Chem., 2008, 29, 839–845 CrossRef PubMed.
- A. L. Spek, J. Appl. Crystallogr., 2003, 36, 7–20 CrossRef.
- V. Stavila, A. A. Talin and M. D. Allendorf, Chem. Soc. Rev., 2014, 43, 5994–601021 RSC.
- (a) C. Q. Zhang, Y. Yan, Q. H. Pan, L. B. Sun, H. M. He, Y. L. Liu, Y. Z. Q. Liang and J. Y. Li, Dalton Trans., 2015, 44, 13340–13346 RSC; (b) D. Wang, L. B. Sun, L. C. Q. Hao, Y. Yan and Z. Q. Liang, RSC Adv., 2016, 6, 57828–57834 RSC; (c) J. N. Hao and B. Yan, J. Mater. Chem. C, 2014, 2, 6758–6764 RSC.
- (a) X. Y. Xu and B. Yan, ACS Appl. Mater. Interfaces, 2015, 7, 721–729 CrossRef PubMed; (b) S. Dang, E. Ma, Z. M. Sun and H. J. Zhang, J. Mater. Chem., 2012, 22, 16920–16926 RSC; (c) Y. Zhou, H. H. Chen and B. Yan, J. Mater. Chem. A, 2014, 2, 13691–13697 RSC; (d) S. Pramanik, C. Zheng, X. Zhang, T. J. Emge and J. Li, J. Am. Chem. Soc., 2011, 133, 4153–4155 CrossRef PubMed; (e) Y. Q. Xiao, Y. J. Cui, Q. A. Zheng, S. C. Xiang, G. D. Qian and B. L. Chen, Chem. Commun., 2010, 46, 5503 RSC; (f) B. L. Chen, L. B. Wang, Y. Q. Xiao, F. R. Fronczek, M. Xue, Y. J. Cui and G. D. Qian, Angew. Chem., Int. Ed., 2009, 48, 500 CrossRef PubMed.
- B. Liu, L. Hou, W. P. Wu, A. N. Dou and Y. Y. Wang, Dalton Trans., 2015, 44, 4423–4427 RSC.
- X. W. Yang, Y. Zhang, F. Li, T. T. Guo, Y. Wu, F. Y. Jin, M. Fang, Y. Q. Lan, Y. F. Li, Y. Zhou and Z. G. Zou, Dalton Trans., 2017, 46, 8204–8218 RSC.
- (a) J. Guo, J. F. Ma, B. Liu, W. Q. Kan and J. Yang, Cryst. Growth Des., 2011, 11, 3609–3621 CrossRef; (b) L. Liu, J. Ding, M. Li, X. Lv, J. Wu, H. Hou and Y. Fan, Dalton Trans., 2014, 43, 12790–12799 RSC; (c) J. C. Jin, L. Y. Pang, G. P. Yang, L. Hou and Y. Y. Wang, Dalton Trans., 2015, 44, 17222–17228 RSC.
- (a) C. X. Yang, H. B. Ren and X. P. Yan, Anal. Chem., 2013, 85, 7441–7466 CrossRef PubMed; (b) S. Xiang, W. Zhou, Z. Zhang, M. A. Green, Y. Liu and B. Chen, Angew. Chem., Int. Ed., 2010, 49, 4615–4618 CrossRef PubMed; (c) J. Wang, Y. Li, M. Jiang, Y. H. Liu, L. W. Zhang and P. Y. Wu, Chem.–Eur. J., 2016, 22, 13023–13027 CrossRef PubMed.
- (a) J. Guo, J. Yang, Y. Y. Liu and J. F. Ma, CrystEngComm, 2012, 14, 6609–6617 RSC; (b) Y. Li, H. Xu, S. X. Ouyang and J. H. Ye, Phys. Chem. Chem. Phys., 2016, 18, 7563–7572 RSC.
- (a) L. L. Wen, F. Wang, J. Feng, K. L. Lv, C. G. Wang and D. F. Li, Cryst. Growth Des., 2009, 9, 3581–3589 CrossRef; (b) M. Q. Hu and Y. M. Xu, Chemosphere, 2004, 54, 431–434 CrossRef PubMed; (c) L. L. Wen, J. B. Zhao, K. L. Lv, Y. H. Wu, K. J. Deng, X. K. Leng and D. F. Li, Cryst. Growth Des., 2012, 12, 1603–1612 CrossRef.
- L. L. Zhang, Z. X. Kang, X. L. Xin and D. F. Sun, CrystEngComm, 2016, 18, 193 RSC.
- (a) J. Li, G. P. Yang, L. Hou, L. Cui, Y. P. Li, Y. Y. Wang and Q. Z. Shi, Dalton Trans., 2013, 42, 13590 RSC; (b) S. Zhao, J. G. Ding, T. R. Zheng, K. Li, B. L. Li and B. Wu, J. Lumin., 2017, 188, 356 CrossRef.
- S. Pramanik, C. Zheng, X. Zhang, T. J. Emge and J. Li, J. Am. Chem. Soc., 2011, 133, 4153 CrossRef PubMed.
- (a) A. K. Paul, G. Madras and S. Natarajan, Phys. Chem. Chem. Phys., 2009, 11, 11285 RSC; (b) G. S. Yang, H. Y. Zang, Y. Q. Lan, X. L. Wang, C. J. Jiang, Z. M. Su and L. D. Zhu, CrystEngComm, 2011, 13, 1461 RSC.
Footnotes |
| † Electronic supplementary information (ESI) available. CCDC 1832866. For ESI and crystallographic data in CIF or other electronic format see DOI: 10.1039/c8ra04145h |
| ‡ The authors have the equal contributions on this work. |
| This journal is © The Royal Society of Chemistry 2018 |

