DOI:
10.1039/C8RA04143A
(Paper)
RSC Adv., 2018,
8, 23382-23389
Adsorption of aniline from aqueous solution using graphene oxide-modified attapulgite composites
Received
15th May 2018
, Accepted 15th June 2018
First published on 27th June 2018
Abstract
Adsorption is an efficient treatment method for aniline removal in water treatment. In this work, the composites of graphene oxide-modified attapulgite were prepared and used firstly to remove aniline from wastewater. The composites were characterized by Fourier transformed infrared, Brunauer–Emmett–Teller, scanning electron microscopy and X-ray diffraction analysis. The effects of initial concentration, time, temperature and pH value on adsorption of aniline on graphene oxide-modified attapulgite are investigated. pH and temperature are found to have a significant influence on the adsorption amount. The experimental results showed that graphene oxide-modified attapulgite possesses strong adsorption ability for aniline with hydrogen bond interaction. The saturated adsorption amount could reach up to 90 mg g−1 at pH = 2–4. The Langmuir isotherm is found to describe well the equilibrium adsorption data. Finally, graphene oxide-modified attapulgite is also observed to possess excellent reusability.
1. Introduction
Aniline is an important class of organic chemical raw material, which can be widely used for the pharmaceutical industry, agrochemical manufacture and materials science.1,2 Similarly, aniline has not only been detected in industrial wastewater, but also a low concentration of aniline has been found in municipal wastewater, surface water and ground water due to excess application of aniline. However, aniline has been classified as very toxic and threatening to human health. According to the integrated wastewater discharge standard of the Ministry of Environmental Protection of China, aniline has a maximal discharge concentration of 5.0 mg L−1 (0.054 mmol L−1).3 Because of its dramatically negative human and environmental impacts, the development of efficient aniline removal technologies has increasingly become a significant environmental concern. The current wastewater treatment methods, such as biological treatments,4 oxidation processes,5–7 photodecomposition,8 adsorption procedures9–12 and other processes,13 have been proposed for the removal of aniline. From the technical, easy-handling and economic points of view, it is now recognized that adsorption is an effective method for the removal of aniline in organic wastewater.14,15
With the selection of a proper adsorbent, the adsorption process can be a promising technique for the removal of aniline from wastewater. Compared with other adsorbents such as the activated carbons,16 the silica gels,17,18 metal–organic framework materials19 and polymeric materials,20,21 attapulgite (ATP), which is a natural clay mineral that is found in many places of the world, is viewed as a more attractive alternative due to its low-cost and environment friendly characters. ATP is widely used to adsorb a wide range of toxic derivatives from aqueous solution. However, most current studies on ATP have focused on heavy metals,22–26 oil treatment27,28 and dyes.29,30 There is no relative information about the removal of aniline by ATP. In addition, the highly efficient utilization of ATP will benefit both the environment and the field of human health and is therefore urgently needed.
Graphene oxide (GO), with the unique two-dimensional structures, the high surface areas and abundant oxygen containing functional groups, has been poured a host of attentions in adsorption field, which result in the high adsorption capacity. Some researchers have focus on its adsorption ability for removing the metal ions,31,32 polycyclic aromatic hydrocarbons,33,34 antibiotics,35,36 and dyes.37 It is worth noticing that the adsorption capacity has been improved due to the use of GO. For example, Liu's work38 based on the ATP and GO, indicates that the adsorption capacity of GO towards U(VI) is much higher than the APT and ATP + GO. The adsorption of prominent pharmaceuticals including beta-blockers, antibiotics, pharmaceutically active compounds and analgesics were reviewed by Wang and co-workers.39 Meanwhile, the relative high cost of GO restricts its practical applications. Thus, it is very necessary that the composites based on the adsorption capacity of GO is developed, and the cost of the adsorption processes is reduced by reducing usage amount of GO.
As far as we know, it has not been reported that the graphene oxide-modified attapulgite (GO–mATP) composites are prepared and used to remove the aniline from wastewater. Therefore, we conceive that the composite of one-dimensional modified ATP and two-dimensional graphene oxide was prepared and used to adsorb the aniline from aqueous solution. Batch experiments were performed to investigate the main parameters such as initial pH, initial aniline concentration, treatment time and temperature. The adsorption mechanism is explained according to the studies of the kinetic, adsorption isotherms, and thermodynamics of the adsorption process.
2. Experimental section
2.1 Materials
Attapulgite was supplied by Changzhou Dingbang Mineral Products Technology co. Ltd (Changzhou, China). γ-(2,3-Epoxypropoxy)propytrimethoxysilane (KH560, A.R.) was purchased from TCI (Shanghai, China). Aniline (A.R.), hydrochloric acid (HCl, A.R.), H2SO4 (98 wt%, A.R.), NaNO3 (A.R.), KMnO4 (A.R.), NaOH (A.R.) and NaCl (A.R.) were obtained from Sinopharm Chemical Reagent (Beijing, China). Aniline was obtained by further distillation under a reduced pressure prior to use. Aniline stock solution (500 mg L−1) was prepared with distilled water.
2.2 Preparation of graphene oxides
Graphene oxides were prepared from graphite by using a Hummers' method.40 H2SO4 (46.0 mL, 98 wt%) was added dropwise to a mixture of graphite (2.0 g) and NaNO3 (1.0 g), and the mixture was cooled to 0 °C in an ice bath. KMnO4 (6.0 g) was added slowly in portions to keep the reaction temperature below 20 °C. The reaction mixture was warmed to 35 °C and stirred for 30 min, at which time H2O (92.0 mL) was added slowly. When it finished, the reaction was transferred to the oil bath and maintained the reaction temperature at 98 °C for 15 min, then the heat was removed and the reaction was cooled using a water bath for 10 min. Additional water (280.0 mL) and 30% H2O2 (2.0 mL) were added separately. After air cooling, the solid was obtained by the filtration, multiple washing and vacuum-dried 12 h at 70 °C.
2.3 Preparation of modified ATP
The natural ATP (about 30 g) was calcined for 2 h at 300 °C in muffle furnace. Then, it was cooled in nature environment. Hydrochloric acid (9.0 mL, 2.0 mol L−1) was slowly added into 50 mL flask contained the previous high-temperature activated ATP (3.0 g). The mixture was stirred for 2 h at 50 °C and dispersed in ultrasonic for 20 min. The solid was separated and washed to neutral by deionized water. The solid was modified with saturated NaCl solution for 30 min and washed in deionized water. Finally, the modified ATP was obtained after the solid was dried at 110 °C for 30 min.
2.4 Preparation of GO–mATP composite
The modified ATP (3.0 g) and ethyl alcohol (EtOH, 150.0 mL, 80% v/v) were mixed evenly in a 250 mL three-necked flask equipped with a magnetometric stirrer, a reflux condenser and a thermometer. KH560 (1.5 g) was dropwise added into the mixture at 80 °C in an oil bath and kept for 3 h. The mixture was washed by EtOH to remove the redundant KH560 attaching physically to the particles and deionized water to remove the EtOH for 3 times, respectively. The obtained solid was dried in an oven at 110 °C to constant weight for 12 h. Finally, ATP-KH560 was gained. The dried ATP-KH560 particles were ground and used to prepare GO–mATP composites.
GO (0.1 g) was dispersed in a 250 mL flask using deionized water (50.0 mL) at the ultrasonic environment for 5 h. ATP-KH560 (0.9 g) was dispersed into deionized water (180.0 mL) prior to use. Then, the ATP-KH560 solution was slowly mixed into the GO solution and immersed into the ultrasound for 1 h. The mixture solution was stirred at 45 °C for 12 h and filtered. The residue was washed for 3 times by deionized water. Finally, the residue was frozen and dried at −65 °C to obtain the GO–mATP. The GO–mATP including the different amount of GO was prepared using the same method and process. The synthetic procedure is described in Scheme 1.
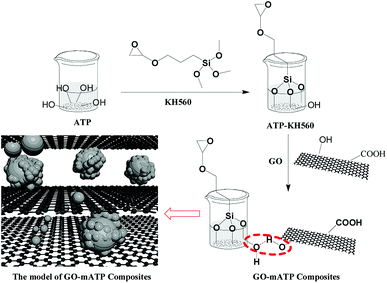 |
| | Scheme 1 Prepared process of GO–mATP. | |
2.5 Characterization methods
Fourier transform infrared (FT-IR) spectra of dried samples in potassium bromide discs were recorded at 400–4000 cm−1 using a Nicolet380 model FT-IR spectrometer (Thermo, USA). UV-2100 spectrophotometer (UNICO, USA) was used to determine the concentration of aniline solution. The specific surface area and pore diameter distribution were determined by NOVA 3000 (Quantachrome, USA). The zeta potential of diatomite samples was measured using a 3000HS (Malvern Co., UK). Aqueous sample suspensions were dispersed using an ultrasonic bath and an average of three measurements was taken to represent the measured potential. Scanning electron microscopy (SEM) image was recorded by Ultra55 (Carl zeiss NTS GmbH, Germany). Along with SEM, energy-dispersive X-ray spectroscopy (EDX) was used to obtain the quantitative microanalysis of the components of GO–mATP. X-ray diffraction (XRD) patterns were carried out on an X'Pert-PRO diffractometer (X Pert PRO, PANalytical Co., The Netherlands) with Cu anode X-ray tube at λ = 0.15406 nm operating at 40 kV and 40 mA, and the corresponding data were collected from 3 to 80°.
2.6 Adsorption experiments
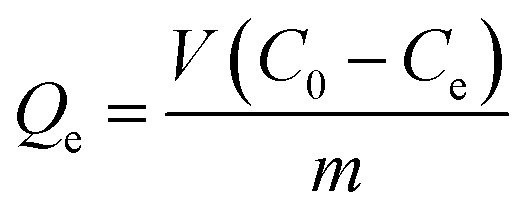
2.6.1 Measurement of kinetic adsorption curve. All adsorption experiments were performed by batch method. About 0.25 g of GO–mATP was introduced into a conical flask contained 50 mL of aqueous aniline solution with an initial concentration (C0, mg L−1) of 500 mg L−1 and pH of 6. This conical flask was placed in a shaker at a presettled temperature (25 °C). At different times, the concentration (Ct, mg L−1) of aniline solution was determined using UV-vis spectrophotometer. The adsorption amount (Q) was calculated according to eqn (1).| |
 | (1) |
where Q (mg g−1) is the adsorption amount; V (L) is the volume of the aniline solution; m (g) is the weight of the absorbent GO–mATP.
2.6.2 Measurement of adsorption isotherm. About 0.25 g of GO–mATP was introduced into a conical flask, into which 50 mL of the aqueous aniline solution with concentrations (C0, mg L−1) of 50, 100, 200, until 500 mg L−1 and pH of 6 were added respectively. These conical flasks were placed in a shaker at a presettled temperature (25 °C). After the adsorption reached equilibrium, the equilibrium concentration (Ce, mg L−1) of aniline solution was determined using UV-vis spectrophotometer. The equilibrium adsorption amount (Qe, mg g−1) was calculated according to eqn (2).| |
 | (2) |
2.6.3 Examination of influences of various factors on adsorption amount of GO–mATP. The pH of aqueous solution was adjusted by addition of HCl and NaOH. The influence of pH on the adsorption amount of GO–mATP was examined. Varying the temperature, the influence of temperature on the adsorption amount of GO–mATP was examined.
3. Results and discussion
3.1 Characterization of different samples
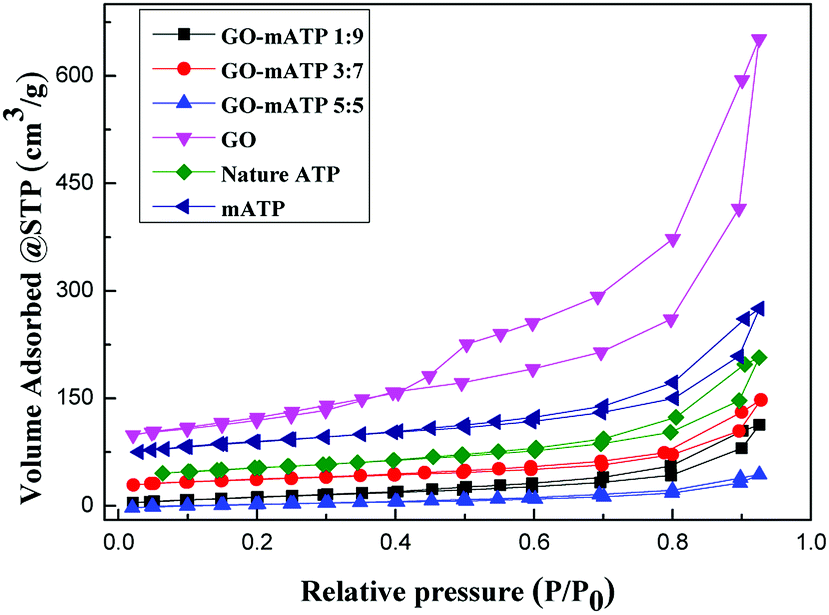
The porous properties parameters such as the Brunauer–Emmett–Teller (BET) surface area, total pore volume and average pore radius are summarized in the Table 1. The N2 adsorption–desorption is shown in Fig. 1. Nature ATP has a high specific surface area (144.93 m2 g−1) and pore volume (0.301 cm3 g−1) (entry 1, Table 1). After modification, the surface area and pore volume of mATP are improved significantly (entry 2, Table 1). The surface area of GO–mATP, composited by GO and mATP, decreases with increasing of the amount of GO (entries 3–5, Table 1). The pore volume become smaller than that of ATP and GO, probably because the pores of ATP were covered or partially blocked by GO during the preparation process.41,42 However, the adsorption ability of GO–mATP (entries 2–4, Table 2) increases observably, which could be due to its many –OH group, electrostatic attraction between GO–mATP and protonated aniline species, and the synergistic effect of GO and mATP.42 Meanwhile, the surface area dramatically decreases from 62.78 m2 g−1 to 30.18 m2 g−1 with the increase of the amount of GO from 3![[thin space (1/6-em)]](https://www.rsc.org/images/entities/char_2009.gif) :7 to 5:5 (GO:mATP). It may be attribute to incomplete stripping of GO and the increasing of average pore radius. However, it should be noted that the adsorption ability for aniline of 500 mg L−1 has a little increase using the amount of GO from 3:7 to 5:5 (GO:mATP) (entries 3–4, Table 2). Thus, GO–mATP including GO:mATP = 3:7 as a sorbent for adsorption of aniline is investigated for reducing the dosage of GO. Before the adsorption batch experiment performing, the GO–mATP is dispersed again for decreasing the effect of GO stripping.
:7 to 5:5 (GO:mATP). It may be attribute to incomplete stripping of GO and the increasing of average pore radius. However, it should be noted that the adsorption ability for aniline of 500 mg L−1 has a little increase using the amount of GO from 3:7 to 5:5 (GO:mATP) (entries 3–4, Table 2). Thus, GO–mATP including GO:mATP = 3:7 as a sorbent for adsorption of aniline is investigated for reducing the dosage of GO. Before the adsorption batch experiment performing, the GO–mATP is dispersed again for decreasing the effect of GO stripping.
Table 1 Specific surface area, total pore volume and average pore radius of the different samples
| Entry |
Samples |
Specific surface area, SBET (m2 g−1) |
Total pore volume (cm3 g−1) |
Average pore radius (Å) |
| Mass ratio: GO:mATP = 1:9. Mass ratio: GO:mATP = 3:7. Mass ratio: GO:mATP = 5:5. GO–mATP all have the same synthetic process and other conditions. |
| 1 |
Natural ATP |
144.93 |
0.301 |
41.57 |
| 2 |
mATP |
208.57 |
0.380 |
36.48 |
| 3 |
GO–mATPa |
64.05 |
0.182 |
56.83 |
| 4 |
GO–mATPb |
62.78 |
0.197 |
62.71 |
| 5 |
GO–mATPc |
30.18 |
0.077 |
51.04 |
| 6 |
GO |
304.60 |
0.954 |
62.65 |
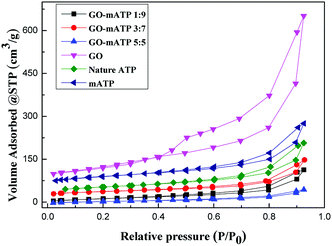 |
| | Fig. 1 N2 adsorption–desorption spectra of ATP, ATP-KH560, GO and GO–mATP composites. | |
Table 2 Adsorption amount of different adsorbent
| Entry |
Sample |
Q (mg g−1) |
| Mass ratio: GO:mATP = 1:9. Mass ratio: GO:mATP = 3:7. Mass ratio: GO:mATP = 5:5. Conditions: temperature 25 °C; pH = 6; adsorption time: 2 h; initial concentration 500 mg L−1; the mass of adsorbent: 0.25 g. |
| 1 |
mATP |
16.1 |
| 2 |
GO–mATPa |
29.4 |
| 3 |
GO–mATPb |
55.5 |
| 4 |
GO–mATPc |
69.0 |
| 5 |
GO |
69.7 |
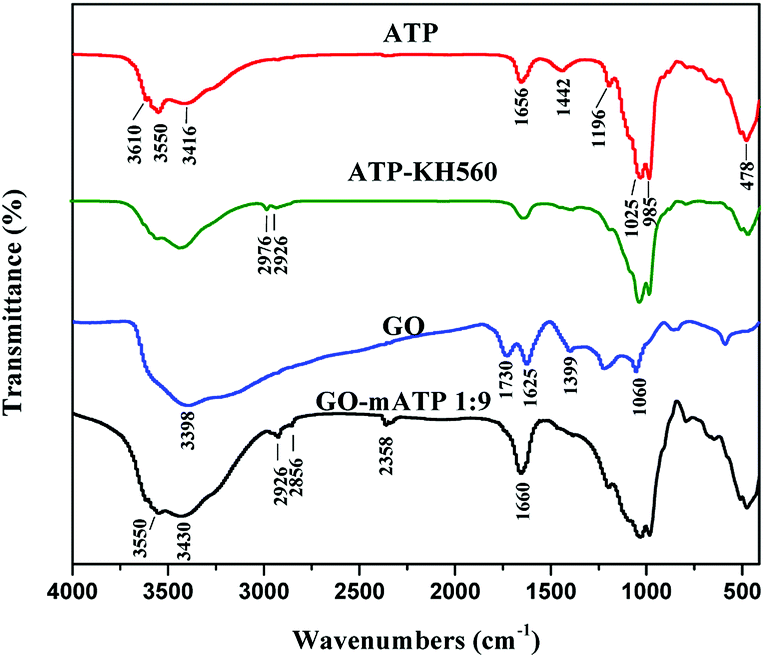
FT-IR spectra of ATP, ATP-KH560, GO and GO–mATP composites are shown in Fig. 2. In the spectrum of ATP, peak positions are observed at 3550–3610 cm−1, 1656 cm−1 and 1198 cm−1 (1025 cm−1, 985 cm−1 and 478 cm−1) corresponding to the stretching vibration of the surface –OH groups, the bending vibration of –OH groups and stretching vibration of Si–O–Si groups connected two reverse tetrahedrons, respectively.43,44 In the ATP-KH560, the characteristic bands of ATP still remained. The characteristic bands of APT at 3610 cm−1, 3550 cm−1 1025 cm−1 and 985 cm−1 weakened. And meanwhile, the characteristic bands of KH560 were observed in the FT-IR spectrum of ATP-KH560. The peaks located at 2976 cm−1 and 2926 cm−1 ascribed to the stretching vibration of C–H in the alkane indicates that ATP is successfully modified by KH560. The FT-IR pattern of GO reveals the presence of the oxygen-containing functional groups. The peaks at 1060 cm−1, 1399 cm−1, 1625 cm−1 correspond to C–O–C stretching vibrations, C–OH stretching, C–C stretching mode of sp2 carbon skeletal network, respectively. While peaks located at 1730 cm−1 and 3398 cm−1 correspond to C![[double bond, length as m-dash]](https://www.rsc.org/images/entities/char_e001.gif) O stretching vibrations of the –COOH and O–H stretching vibration, respectively.45 The peaks at 3430 cm−1, 2358 cm−1, 1660 cm−1 correspond to O–H stretching vibrations, O–H stretching vibrations of the –COOH and C–C stretching mode of sp2 carbon skeletal network or CO stretching vibrations in the FT-IR spectra of GO–mATP composites. Meanwhile, peak at 3550 cm−1 may correspond to hydrogen bond. The results indicate that the GO–mATP composites is successfully prepared.
O stretching vibrations of the –COOH and O–H stretching vibration, respectively.45 The peaks at 3430 cm−1, 2358 cm−1, 1660 cm−1 correspond to O–H stretching vibrations, O–H stretching vibrations of the –COOH and C–C stretching mode of sp2 carbon skeletal network or CO stretching vibrations in the FT-IR spectra of GO–mATP composites. Meanwhile, peak at 3550 cm−1 may correspond to hydrogen bond. The results indicate that the GO–mATP composites is successfully prepared.
 |
| | Fig. 2 FT-IR spectra of ATP, ATP-KH560, GO and GO–mATP composites. | |
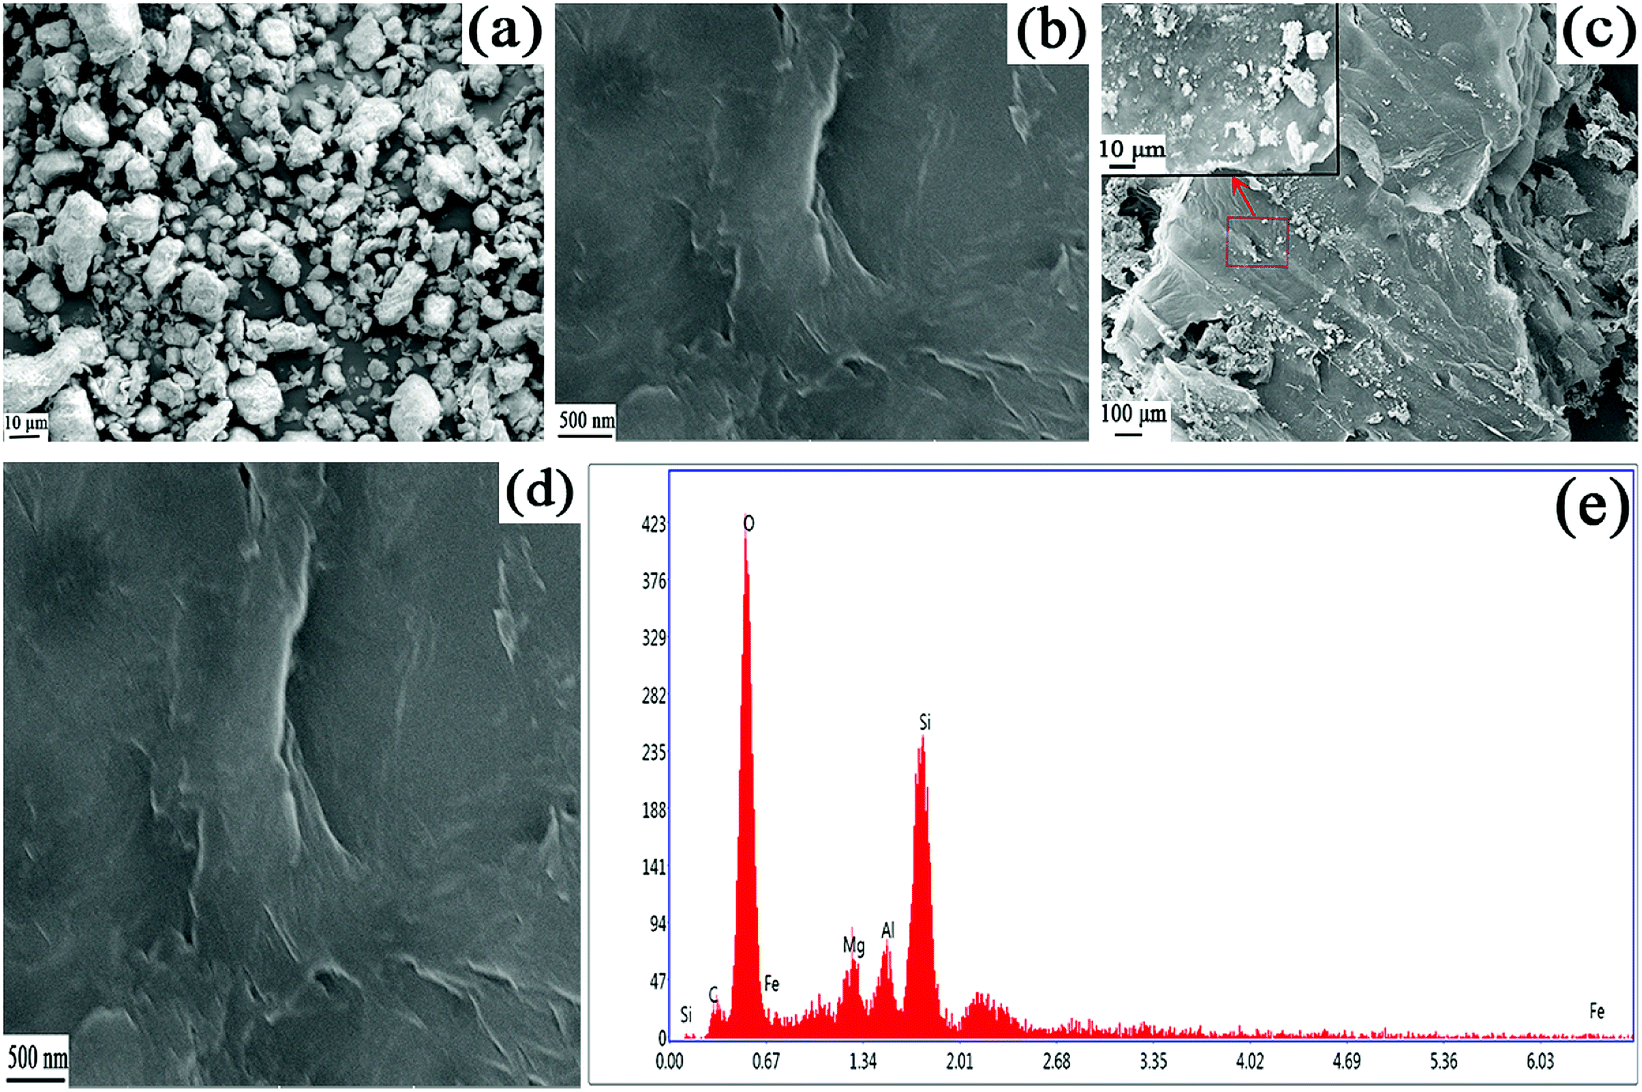
As shown in Fig. 3, the surface morphology of ATP, GO, GO–mATP and EDS analysis of GO–mATP was observed by SEM. It can be seen that the surface morphologies of ATP is irregular and the size of particles is also uneven distribution. The biggest size is about 10 μm or even bigger; while the smallest size is about 1 μm or even smaller (Fig. 3a). Fig. 3b shows the typical SEM images of GO obtained by the Hummers' method. The SEM of GO presents the smooth surface, the sheet-like structure with the large thickness and wrinkled edge. After the combination with ATP to form the GO–mATP composites (Fig. 3c and d), the GO–mATP has a rougher surface and many particles of ATP in the surface, revealing that the mATP has been assembled on the surface of GO layer. Although there are only a few larger size of ATP on the surface of GO layer, from the enlarged view in the Fig. 3c, compared with Fig. 3a, the size of ATP particles become obviously smaller due to the dispersion effect of GO. The main elements of ATP contain Mg, Al, Si, Fe and O. Meanwhile, GO main contains C and O element. The results of EDS analysis reveal that the typical elements of GO–mATP, such as Mg, Al, Si, Fe, C and O, are contained in the composites (Fig. 3e). The results also indicate that GO–mATP was successfully synthesized.
 |
| | Fig. 3 SEM images of ATP, GO, GO–mATP and EDS analysis of GO–mATP. | |
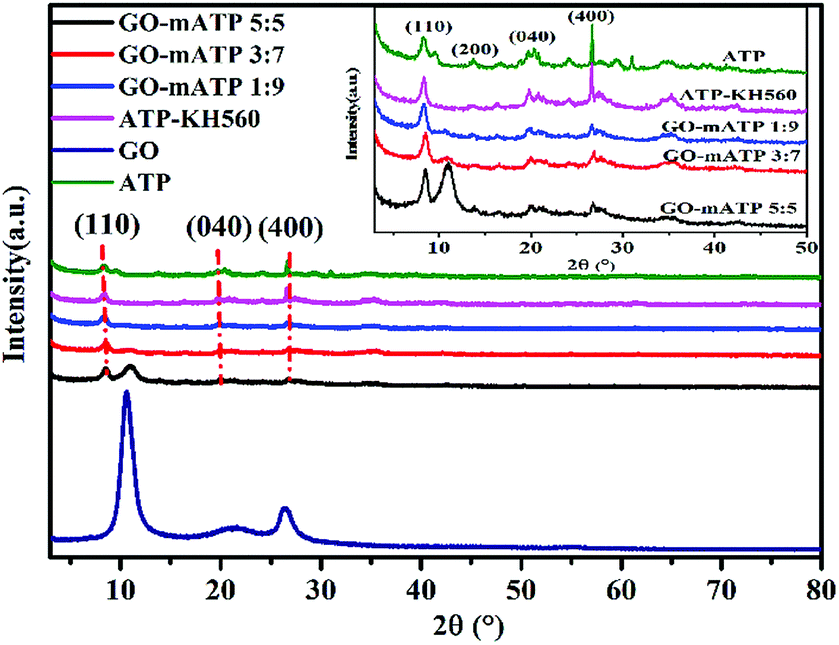
Fig. 4 shows the XRD patterns of ATP, ATP-KH560, GO and GO–mATP. The peaks at 2θ = 8.3°, 13.6°, 19.7° and 26.7° correspond to the primary diffraction of the (110), (200), (040) and (400) planes of the ATP, respectively.46 The results clearly indicate that the four plane characteristic peaks for pure ATP. And meanwhile, the modified ATP (ATP-KH560) do not change at all. That is ATP treated by KH560 has no evidently effects on its crystal structure. However, from the results of FT-IR, the C–H in the alkane has found in the ATP-KH560. Fig. 4 shows the XRD patterns of GO, which has a sharp peak at 2θ = 10.6°, corresponding to an interlayer distance of 0.83 nm. This peak gradually appears and sharp peak centered at around 11.03° is observed increasing with the amount of GO. And meanwhile, the peak of ATP (2θ = 8.3°) become gradually weak. When the mass ratio of GO:mATP is 3:7 and 5:5, the interlayer distance decrease from 0.82 nm (corresponding to the diffraction peak at 2θ = 10.80°) to 0.80 nm (corresponding to the diffraction peak at 2θ = 11.03°) because the decreasing of the ATP amount leads to strengthen of the interlayer force on the GO.
 |
| | Fig. 4 XRD spectra of GO, ATP, ATP-KH560 and GO–mATP composites. | |
3.2 The effect of different parameters on adsorption amount of GO–mATP
3.2.1 Adsorption capacity of the different adsorbent. The adsorption amount of different adsorbent is shown in Table 2. The adsorption amount of the mATP is only 16.1 mg g−1 in the same conditions (entry 1, Table 2). The adsorption amount of GO–mATP increases from 29.4 mg g−1 to 55.5 mg g−1 when the mass ratio of GO and mATP increases from 1:9 to 3:7 (entries 2 and 3, Table 2). The adsorption amount has nearly doubled. Maybe, there are many –OH on the GO. It benefits to form a lot of hydrogen bond for increasing the adsorption amount. Another is the synergistic effect of GO and mATP.42 However, the adsorption amount increases slightly from to 55.5 mg g−1 to 69.0 mg g−1 with the increase of the mass ratio of GO and mATP from 3:7 to 5:5 (entries 3 and 4, Table 2). The results indicate that the adsorption capacity increases by the composite of GO–mATP. Meanwhile, because GO is only get up to 69.7 mg g−1 (entry 5, Table 2), we do not increase the mass ratio of GO and mATP for reducing the amount of GO.
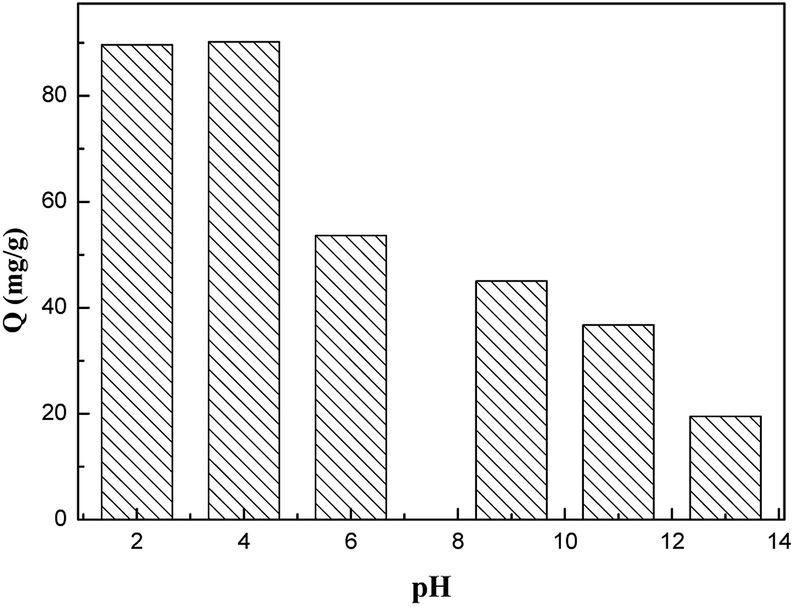
3.2.2 The effect of pH. In practical industrial processes, wastewater may be acidic or alkali and may contain many contaminants besides aniline. For investigating the effect of pH on the adsorption capacity of aniline, aqueous solutions were prepared with different pH values ranging from 2 to 13. And the results are illustrated in Fig. 5. Obviously, the pH value has a considerable influence on the adsorption amount of GO–mATP for aniline. The adsorption capacity of GO–mATP decreased with an increase in pH value. At pH = 2–4, the adsorption amount of aniline reaches up to 90 mg g−1. In the process of adsorption of aniline onto GO–mATP, two kinds of hydrogen bond occur possibly between GO–mATP and aniline. First, the –OH of GO–mATP could form a hydrogen bond (O–H⋯N hydrogen bond) with the N atom of aniline that acts as the acceptor. Second, the –NH2 of aniline could form a hydrogen bond (N–H⋯O hydrogen bond) with the O atom in the GO–mATP.47 There are many HCl molecules in the aqueous solution under strong acid conditions. Aniline is a mild base that could interact with HCl and form C6H5NH3+Cl−. Compared with C6H5NH2, C6H5NH3+ is electron deficient and has three hydrogen atoms. It could form stronger hydrogen bonds with GO–mATP. Meanwhile, aniline is different from nonionizable chemicals because of its existence either as neutral or dissociated species in aqueous solutions.9 Dissociated species, such as C6H5NH3+, are dominant for aniline at a pH less than the pKa value of aniline (4.6) and are positively charged.10,48 At pH = 2–4, the zeta potential values of GO–mATP is about −12.3 to −20.1. Therefore, there are an electrostatic attraction between GO–mATP and protonated aniline species. However, at pH values above 7, the adsorption amount of aniline sharply decreases. At pH = 13, the adsorption amount of aniline is only 19.5 mg g−1. A possible explanation is that the molecular form of aniline predominates over the ionic form, when pH is above the pKa of aniline (4.6). It implies that less aniline was dissolved into water, which is not conducive to form hydrogen bonds. Meanwhile, an increase in pH promoted surface deprotonation of the GO–mATP, and the electrostatic attraction which suits the adsorption behavior was gradually suppressed.
 |
| | Fig. 5 Adsorption capacity of GO–mATP at different pH. Conditions: temperature 25 °C; adsorption time: 2 h; initial concentration 500 mg L−1; mass ratio: GO:mATP = 3:7; the mass of adsorbent: 0.25 g. | |
3.2.3 The effect of temperature. Fig. 6 shows the adsorption isotherm of GO–mATP about aniline at different temperature. As can be seen from Fig. 6, all the adsorption isotherms are nonlinear with curves concave to the abscissa. The adsorption amount of aniline decreases with the increase of temperature, and the effect of temperature on the adsorption amount is great. The saturated adsorption amount at 298 K is 55.5 mg g−1, which is much higher than 32.8 mg g−1 of the saturated adsorption amount at 323 K. The fact that the adsorption amount of aniline decreases with the increase of temperature implies that the adsorption of GO–mATP towards aniline is an exothermic process.
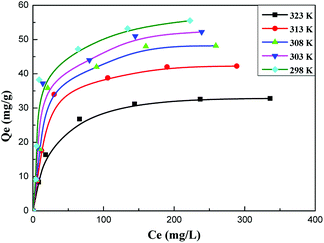 |
| | Fig. 6 Adsorption capacity of GO–mATP at different temperature. (Conditions: pH: 6; adsorption time: 2 h; mass ratio: GO:mATP = 3:7; the mass of adsorbent: 0.25 g). | |
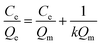
3.3 Adsorption isotherm of GO–mATP for aniline
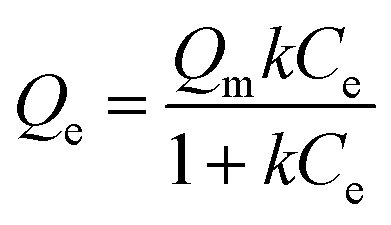
In order to describe the adsorption isotherm in more detail, the Langmuir model equations are selected to describe the adsorption process in this work. The Langmuir adsorption isotherm equation has been successfully applied to many pollutant adsorption processes from aqueous solution.
Langmuir equation is as follows:
| |
 | (3) |
| |
 | (4) |
where,
Qe (mg g
−1) represents the equilibrium adsorption amount of aniline on the adsorbent,
Qm (mg g
−1) is the saturated adsorption amount,
Ce (mg L
−1) is the equilibrium aniline concentration in solution and
k (L mg
−1) is the Langmuir adsorption combine constant. The Langmuir model parameters and linear regression correlations obtained from the fitting curves are shown in
Table 3. The linear regression coefficient is all above 0.99. The results indicate fully that the adsorption of aniline onto GO–mATP is typical monomolecular-layer adsorption of Langmuir type. The monolayer amount
Qm of aniline onto GO–mATP at 298 K (58.548 mg g
−1), 303 K (55.494 mg g
−1), 308 K (51.813 mg g
−1), 313 K (45.228 mg g
−1) and 323 K (35.211 mg g
−1), is calculated based on the Langmuir isotherm, respectively.
Table 3 Parameters of Langmuir adsorption model of aniline onto GO–mATP at different temperature
| Entry |
Temperature (K) |
Qm (mg g−1) |
k (L mg−1) |
R2 |
| 1 |
298 |
58.548 |
0.0776 |
0.9956 |
| 2 |
303 |
55.494 |
0.0662 |
0.9960 |
| 3 |
308 |
51.813 |
0.0577 |
0.9968 |
| 4 |
313 |
45.228 |
0.0566 |
0.9971 |
| 5 |
323 |
35.211 |
0.0465 |
0.9994 |
According to the Van't Hoff equation:
| |
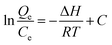 | (5) |
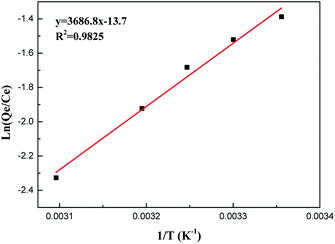
When the adsorption amount is 33 mg g−1, the curve of the ln(Qe/Ce) vs. 1/T is shown in Fig. 7. It gives the numerical values of ΔH from slope. The enthalpy change, ΔH, is −30.7 kJ mol−1, which also indicates that the adsorption of GO–mATP towards aniline is an exothermic process.
 |
| | Fig. 7 Linear plots of ln(Qe/Ce) versus 1/T for the sorption of aniline. | |
3.4 Kinetic adsorption curve of GO–mATP for aniline
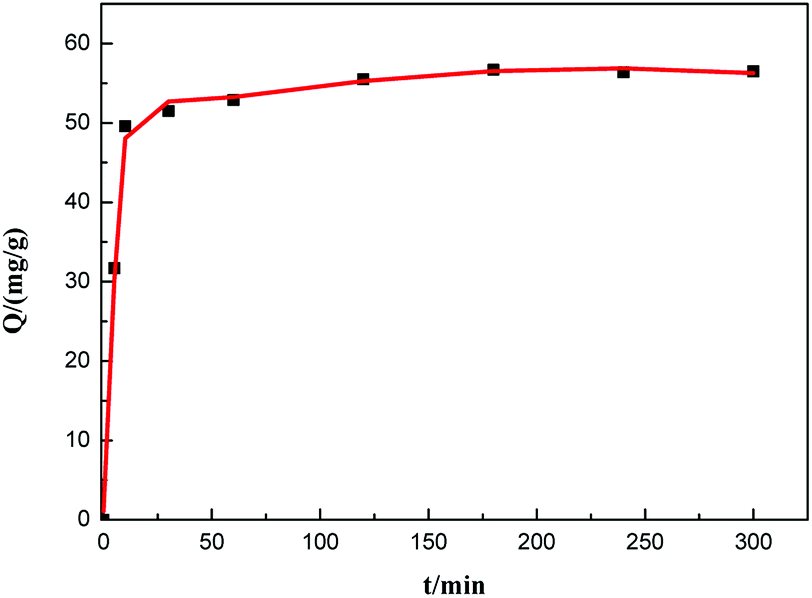
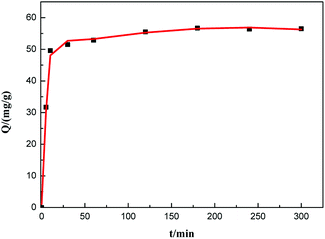
The kinetic curve of aniline adsorption is shown in Fig. 8. As illustrated, the adsorption reaches usually to equilibrium at 120 min. No significant change in the adsorption amount of aniline is observed after 120 min. And the saturated adsorption amount reached 55.5 mg g−1. The composite adsorbent GO–mATP has very fast and strong adsorption ability and high affinity for aniline. This could be attributed to the hydrogen bond interaction and electrostatic attraction between aniline and GO–mATP.
 |
| | Fig. 8 Kinetic adsorption curve of GO–mATP for aniline. Conditions: temperature 25 °C; pH = 6; mass ratio: GO:mATP = 3:7; initial concentration 500 mg L−1; the mass of adsorbent: 0.25 g. | |
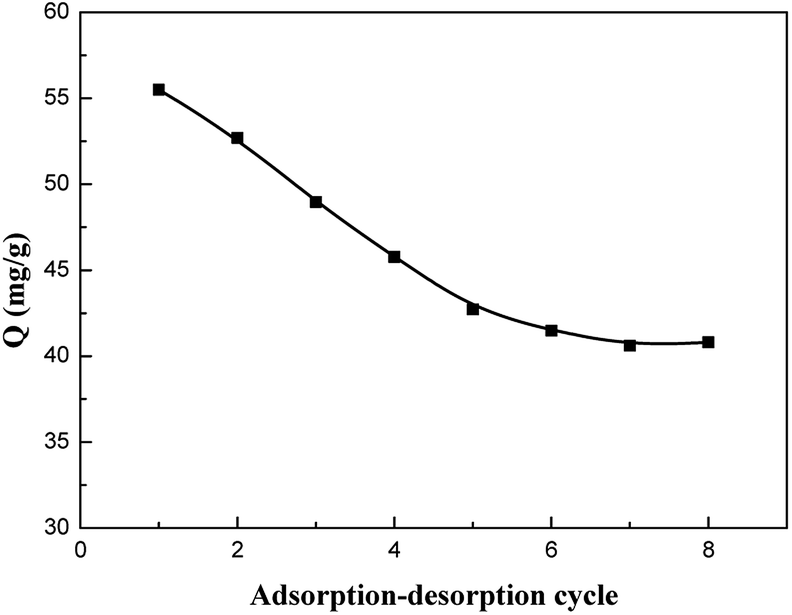
3.5 Reusability of the adsorbent
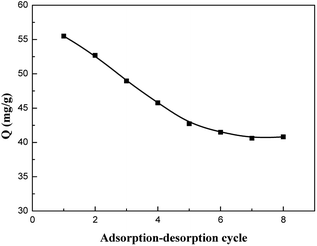
The regeneration of adsorbents is one of the key factors in the adsorption industry. To evaluate the reuse value of the composite, a consecutive adsorption–desorption process of GO–mATP were studied. When hydrochloric acid solution (0.05 mol L−1) is used as a desorbing reagent. The hydrogen bond interaction between aniline and GO–mATP is disrupted and subsequently the solution including aniline is removed by filtration. In order to show the reusability of the GO–mATP, adsorption–desorption cycle is repeated eight times using the same adsorbent. The relationship between the number of times of reuse and the adsorption capacity for aniline is shown in Fig. 9. It can be seen that the adsorption amount of aniline onto GO–mATP has decreased obviously with the increasing of cycle-index especially for the first four times. One reason may be the decrease in the deactivation of some adsorption sites. Another could be due to the regeneration method not suitable for GO–mATP resulting in the residual of aniline or Cl−. However, the adsorption capacity keeps constant after four times of adsorption–desorption cycle. The adsorption capacity may be offered by the effect of hydrogen bond between aniline and GO–mATP. The results indicate that the GO–mATP could be used repeatedly without significantly decreasing its adsorption amount after four times of adsorption–desorption.
 |
| | Fig. 9 Adsorption–desorption cycle of GO–mATP towards aniline. Conditions: adsorption temperature 25 °C; pH = 6; mass ratio: GO:mATP = 3:7; initial concentration 500 mg L−1; the mass of adsorbent: 0.25 g, adsorption time: 2 h. | |
4. Conclusions
In this work, ATP was modified by KH560, and the novel adsorbent GO–mATP was successfully synthesized. The modification and recombination process was confirmed to be useful by resulting in an increase in adsorption capacity for aniline in aqueous solution. The adsorption behaviour of aniline for GO–mATP was influenced by contact time, temperature and pH. Aniline adsorption on GO–mATP was rapid and reached 90% equilibrium capacity after the first time. Weak acidity and lower temperature favoured GO–mATP adsorption efficiency. Under optimum conditions, a maximum adsorption capacity of 90 mg g−1 occurred. The adsorption mechanism was explained satisfactorily using hydrogen bond interaction. The results from this study demonstrate that GO was involved in adsorption for aniline removal and GO–mATP would be a promising material for rapid and efficient treatment of aniline under mild conditions. Additional, GO–mATP possesses excellent reusability. It could be used repeatedly over eight times without significantly losing adsorption amount.
Conflicts of interest
There are no existing conflicts of interest in the submission, and the manuscript has been approved for publication by all authors.
Acknowledgements
This work is supported by the Foundation of Key Laboratory for Palygorskite Science and Applied Technology of Jiangsu Province (HPK201602), Sichuan's Training Program of Innovation and Entrepreneurship for Undergraduate (201810619040) and the Natural Science Foundation of Southwest University of Science and Technology (15zx7125).
References
- G. Q. Wu, X. Zhang, H. Hui, J. Yan, Q. S. Zhang, J. L. Wan and Y. Dai, Chem. Eng. J., 2012, 185, 201–210 CrossRef.
- L. Jiang, L. Liu, S. Xiao and J. Chen, Chem. Eng. J., 2016, 284, 609–619 CrossRef.
- Integrated wastewater discharge standard, https://kjs.mep.gov.cn/hjbhbz/, 1996.
- L. Wang, S. Barrington and J. W. Kim, J. Environ. Manage., 2007, 83, 191–197 CrossRef PubMed.
- J. Anotai, C. C. Su, Y. C. Tsai and M. C. Lu, J. Hazard. Mater., 2010, 183, 888–893 CrossRef PubMed.
- A. Jin, M. C. Lu and P. Chewpreecha, Water Res., 2006, 40, 1841–1847 CrossRef PubMed.
- A. Jin, C. C. Su, Y. C. Tsai and M. C. Lu, J. Environ. Eng., 2011, 137, 363–370 CrossRef.
- W. Chu, W. K. Choy and T. Y. So, J. Hazard. Mater., 2007, 141, 86–91 CrossRef PubMed.
- K. Yang, W. Wu, Q. Jing and L. Zhu, Environ. Sci. Technol., 2008, 42, 7931–7936 CrossRef PubMed.
- R. Hu, X. Wang, S. Dai, D. Shao, T. Hayat and A. Alsaedi, Chem. Eng. J., 2015, 260, 469–477 CrossRef.
- S. Yu, X. Wang, Z. Chen, J. Wang, S. Wang, T. Hayat and X. Wang, J. Hazard. Mater., 2017, 321, 111–120 CrossRef PubMed.
- S. Yu, X. Wang, H. Pang, R. Zhang, W. Song, D. Fu, T. Hayat and X. Wang, Chem. Eng. J., 2018, 333, 343–360 CrossRef.
- H. Y. Fu, Z. B. Zhang, T. Chai, G. H. Huang, S. J. Yu, Z. Liu and P. F. Gao, Water, 2017, 9, 365–374 CrossRef.
- L. Guo, G. Li, J. Liu, P. Yin and Q. Li, Ind. Eng. Chem. Res., 2009, 48, 10657–10663 CrossRef.
- S. Yu, X. Wang, W. Yao, J. Wang, Y. Ji, Y. Ai, A. Alsaedi, T. Hayat and X. Wang, Environ. Sci. Technol., 2017, 51, 3278–3286 CrossRef PubMed.
- S. Suresh, V. C. Srivastava and I. M. Mishra, Chem. Eng. J., 2011, 171, 997–1003 CrossRef.
- H. H. Tran, F. A. Roddick and J. A. O'Donnell, Water Res., 1999, 33, 2992–3000 CrossRef.
- L. Liu, R. Wang, J. Yu, L. Hu, Z. Wang and Y. Fan, RSC Adv., 2018, 8, 15804–15812 RSC.
- Y. Chen, B. Wang, X. Wang, L. Xie, J. Li, Y. Xie and J. Li, ACS Appl. Mater. Interfaces, 2017, 9, 27027–27035 CrossRef PubMed.
- F. An, X. Feng and B. Gao, Chem. Eng. J., 2009, 151, 183–187 CrossRef.
- J. Yao, X. Li and W. Qin, Anal. Chim. Acta, 2008, 610, 282–288 CrossRef PubMed.
- X. Wang and A. Wang, Environ. Technol., 2010, 31, 745–753 CrossRef PubMed.
- J. Pan, X. Zou, C. Li, Y. Liu, Y. Yan and J. Han, Microchim. Acta, 2010, 171, 151–160 CrossRef.
- B. Mu and A. Wang, J. Mater. Chem. A, 2015, 3, 281–289 RSC.
- X. Zou, J. Pan, H. Ou, X. Wang, W. Guan, C. Li, Y. Yan and Y. Duan, Chem. Eng. J., 2011, 167, 112–121 CrossRef.
- Y. Cao and X. B. Li, Adsorption, 2014, 20, 713–727 CrossRef.
- J. Wang, Q. Wang, Y. Zheng and A. Wang, Polym. Compos., 2013, 34, 274–281 CrossRef.
- J. Li, L. Yan, H. Li, J. Li, F. Zha and Z. Q. Lei, RSC Adv., 2015, 5, 53802–53808 RSC.
- H. Chen and J. Zhao, Adsorption, 2009, 15, 381–389 CrossRef.
- A. Aljeboree, Res. J. Pharm., Biol. Chem. Sci., 2015, 6, 778–788 Search PubMed.
- X. Mi, G. Huang, W. Xie, W. Wang, Y. Liu and J. Gao, Carbon, 2012, 50, 4856–4864 CrossRef.
- X. X. Wang, Q. H. Fan, S. J. Yu, Z. S. Chen, Y. J. Ai, Y. B. Sun, A. Hobiny, A. Alsaedi and X. K. Wang, Chem. Eng. J., 2016, 287, 448–455 CrossRef.
- J. Wang, Z. Chen and B. Chen, Environ. Sci. Technol., 2014, 48, 4817–4825 CrossRef PubMed.
- Z. Jin, X. Wang, Y. Sun, Y. Ai and X. Wang, Environ. Sci. Technol., 2015, 49, 9168–9175 CrossRef PubMed.
- Y. Gao, Y. Li, L. Zhang, H. Huang, J. Hu, S. MazharShah and X. Su, J. Colloid Interface Sci., 2012, 368, 540–546 CrossRef PubMed.
- W. C. Cheng, C. C. Ding, Q. Y. Wu, X. X. Wang, Y. B. Sun, W. Q. Shi, T. Hayat, A. Alsaedi, Z. F. Chai and X. K. Wang, Environ. Sci.: Nano, 2017, 4, 1124–1131 RSC.
- X. Pang, H. Peng, H. Yang, K. Gao, X. Wu and A. A. Volinsky, Chem. Eng. Res. Des., 2013, 91, 361–368 CrossRef.
- X. Liu, X. Xu, J. Sun, A. Alsaedi, T. Hayat, J. Li and X. Wang, Chem. Eng. J., 2018, 343, 217–224 CrossRef.
- A. Khan, J. Wang, J. Li, X. Wang, Z. Chen, A. Alsaedi, T. Hayat, Y. Chen and X. Wang, Environ. Sci. Pollut. Res., 2017, 24, 7938–7958 CrossRef PubMed.
- D. C. Marcano, D. V. Kosynkin, J. M. Berlin, A. Sinitskii, Z. Sun, A. Slesarev, L. B. Alemany, W. Lu and J. M. Tour, ACS Nano, 2010, 4, 4806–4814 CrossRef PubMed.
- S. Liu, J. Sun and Z. Huang, J. Hazard. Mater., 2010, 173, 377–383 CrossRef PubMed.
- L. Chen, H. Liang, Y. Lu, C. Cui and S. Yu, Langmuir, 2011, 27, 8998–9004 CrossRef PubMed.
- W. Wang, Y. Zheng and A. Wang, Polym. Adv. Technol., 2008, 19, 1852–1859 CrossRef.
- G. Tian, W. Wang, D. Wang, Q. Wang and A. Wang, Powder Technol., 2017, 315, 60–67 CrossRef.
- D. Depan, B. Girase, J. S. Shah and R. D. K. Misra, Acta Biomater., 2011, 7, 3432–3445 CrossRef PubMed.
- L. Wang and J. Sheng, Polymer, 2005, 46, 6243–6249 CrossRef.
- X. Yang, Q. Guan and W. Li, J. Environ. Manage., 2011, 92, 2939–2943 CrossRef PubMed.
- D. D. Shao, J. Hu, C. L. Chen, G. D. Sheng, X. M. Ren and X. K. Wang, J. Phys. Chem. C, 2010, 114, 21524–21530 CrossRef.
|
| This journal is © The Royal Society of Chemistry 2018 |
Click here to see how this site uses Cookies. View our privacy policy here. 
 Open Access Article
 This Open Access Article is licensed under a Creative Commons Attribution-Non Commercial 3.0 Unported Licence
 *ab,
Chong Chena,
Qin Leia,
Jianhao Lianga,
Tinghong Zhanga and
Jinlong Jiang*b
*ab,
Chong Chena,
Qin Leia,
Jianhao Lianga,
Tinghong Zhanga and
Jinlong Jiang*b