 Open Access Article
Facile synthesis and microwave absorption investigation of activated carbon@Fe3O4 composites in the low frequency band
Pengfei Yin a,
Yu Deng*b,
Limin Zhangc,
Ning Lic,
Xing Fenga,
Jian Wanga and
Yi Zhanga
aCollege of Science, Sichuan Agricultural University, Ya'an 625014, P. R. China
bCollege of Water Conservancy and Hydropower Engineering, Sichuan Agricultural University, Ya'an 625014, P. R. China. E-mail: yudeng21@sicau.edu.cn
cKey Laboratory of Space Applied Physics and Chemistry (Ministry of Education), School of Science, Northwestern Polytechnical University, Xi'an 710072, P. R. China
First published on 25th June 2018
Abstract
Activated carbon@Fe3O4 composites with good electromagnetic wave absorption performances in the low frequency range were synthesized via the hydrothermal method. The crystal structure, microstructure, magnetization properties, frequency-dependent electromagnetic properties and microwave absorption properties of the as-prepared composites were characterized via XRD, VSM, SEM, TEM and VNA, respectively. The results indicated that the electromagnetic wave absorption performance of the composites can be adjusted through the addition of activated carbon. A suitable loading content of Fe3O4 NPs on activated carbon can also enhance the microwave absorption performance of the composites. The synergy of dielectric and magnetic loss is the main electromagnetic wave absorption mechanism, and the maximum RL of −10.08 dB at 1.75 GHz with a −5 dB bandwidth over the frequency range of 1.55 GHz (1.07–2.62 GHz) is obtained when the percentage of Fe3O4 NPs and the thickness of the composites are 74 wt% and 5 mm, respectively. Hence, the composite reported in this study can be used as a promising microwave absorbing material in the low frequency range of 0.5–3 GHz.
1. Introduction
Nowadays, with the rapid development of modern radars and electronic devices, increasing attention has been given to electromagnetic wave absorbing materials within the GHz range.1–4 However, in particular, the detection frequency band of ship-based phased array radars used today is located in the low frequency range of the S-band, and the working frequency range of many space-based radars has been extended to 1.2 GHz thus far. In addition, the radiant frequency range of electronic devices used in daily life is focused in the low frequency band. Nevertheless, the existing investigations on electromagnetic wave absorbing materials are mainly focused on the 2–18 GHz range, and the microwave absorption of these materials is very poor in the low frequency electromagnetic wave region, particularly in the range of 1–2 GHz. This poses a significant challenge in the design and development of materials with good absorption ability in the low frequency band.5,6In recent years, a variety of materials that can attenuate electromagnetic waves by dissipating them via interference or converting them into heat have been studied extensively, including dielectric materials,7,8 magnetic metals,9,10 conductive macromolecules,11,12 and ferrites. Among them, carbon materials have been extensively investigated due to their excellent properties, such as outstanding chemical stability, high electrical conductivity, and unique structures.13–15 However, it is almost impossible obtain excellent electromagnetic wave absorption performance using unmodified carbon materials due to unilateral dielectric loss. Thus, to optimize the properties of carbon materials as electromagnetic wave absorbers, they need to be modified and composited with other nanomaterials possessing different electromagnetic loss mechanisms, which is a promising way to improve their microwave absorption properties.16,17
During the past decades, numerous investigations have been conducted to decorate carbon materials with ferrites to prepare magnetic nanoparticles due to their special magnetic properties, strong absorption performance, low cost, etc. Heidari et al.18 researched the microwave absorption performance of ZnO/Fe3O4/GO nanocomposites in the frequency range of 5–8 GHz. Their results showed that the dispersion of nanoparticles can be improved by increasing the homogenizer speed, which leads to an increase in absorption bandwidth; also, graphene oxide has an important effect on absorption compared with the composites without graphene oxide. Wang et al.19 fabricated hollow ZnFe2O4 microspheres@rGO decorated with TiO2 nanosheets via a two-step hydrothermal method. The electromagnetic wave absorption properties of the ZnFe2O4@rGO@TiO2 composites indicate that their maximum reflection loss can be enhanced significantly, achieving −55.6 dB at 3.8 GHz for a coating thickness of 2.5 mm, and the maximum absorption bandwidth exceeding −10 dB was about 6.4 GHz. Hou et al.20 fabricated MWCNTs/Fe3O4 composites via the hydrothermal synthesis method, and their microwave absorption performance was also studied in the frequency range of the X-band. With an increase in the content of Fe3O4, the maximum reflection loss of −18.22 dB at 12.05 GHz was achieved for enhancing the magnetic loss of the composites. Sardarian et al.21 prepared Fe3O4/BaTiO3@MWCNT ternary composites and investigated the synergistic mechanism of their enhanced microwave absorption performance; the microwave absorption of the composites improved in the low frequency band with an increase in the content of magnetic particles.
Among the present investigations, various types of carbon materials have been widely studied, such as CNTs (MWCNTs), graphene (graphene oxide), and carbon fibers, while the microwave absorption performance of activated carbon has rarely been reported. Activated carbon is also a type of favourable carrier in many areas due to its loose structure. Moreover, as a type of magnetic ferrite, Fe3O4 has been extensively used to absorb electromagnetic waves due to its high magnetic loss and Curie temperature.22 However, the imaginary part of the permeability is much larger than that of the permittivity in pure Fe3O4 particles, which leads relatively poor impedance matching. Thus, combining Fe3O4 particles with activated carbon may be a promising route to improve their electromagnetic wave absorption performance.
Therefore, due to its excellent dielectric properties, activated carbon was employed as a dielectric absorbent carrier to composite with Fe3O4 nanoparticles (denoted as Fe3O4 NPs henceforth) in this study. The as-prepared activated carbon@Fe3O4 composites were synthesized via the hydrothermal method due to its high efficiency and convenience. In addition, the phase identification, microstructure, magnetization curves and microwave absorption properties of the as-prepared composites were characterized via XRD, VSM, SEM, TEM and Vector Network Analysis (VNA), respectively. The results indicated that the activated carbon@Fe3O4 composites can be used as a new candidate for microwave absorption in the low frequency band of 0.5–3 GHz.
2. Experimental
2.1. Synthesis of activated carbon@Fe3O4 composites
Analytically pure activated carbon micropowder, used in our investigation, was purchased from Chongqing MaoYe Chemical Reagent Co. Ltd, China. Fe3O4 NPs coated on activated carbon were prepared via the hydrothermal synthesis method.23 In detail, 3.95 g ferric chloride hexahydrate (FeCl3·6H2O) was added to 80 mL ethylene glycol to form a clear solution. Then, 8.75 g sodium acetate trihydrate (NaAc) and different amounts of activated carbon were consecutively added into the abovementioned solution with continuous stirring and ultrasonic dispersion for 30 min. Subsequently, the obtained mixed solution was directly sealed into a 100 mL Teflon-lined stainless-steel autoclave and the temperature was maintained at 200 °C for 12 h. After cooling the autoclave to room temperature, the precipitate was separated from the solution using a magnet. Then, the as-prepared black product was washed with distilled water and ethanol three times, in sequence, and dried at 50 °C for 6 h. To understand the influence of the Fe3O4 NPs content on the microwave absorption performance, five samples containing 0, 27, 53, 74, and 100 wt% Fe3O4 NPs (denoted as activated carbon, 27% Fe3O4, 53% Fe3O4, 74% Fe3O4 and pure Fe3O4, respectively) were prepared using the same method described above. Ferric chloride hexahydrate and NaAc were purchased from Chengdu KeLong Chemical Reagent Co. Ltd, China, and ethylene glycol was purchased from Sinopharm Chemical Reagent Co. Ltd, China. All chemicals were analytical pure and used without further purification.2.2. Characterization
The microstructure and elemental distribution of the composites were observed and investigated via scanning electron microscopy (SEM) on a Hitachi S-4800 and transmission electron microscopy (TEM) on a JTM-2100. The crystal structure and phase components were measured by the Rigaku D/MAX-2004 X-ray diffractometer with Cu-Kα radiation (λ = 0.15418 nm). The magnetization curves of the composites were determined on a Q-VSM vibrating specimen magnetometer (VSM). Paraffin was employed as the agglomerant to adhere the activated carbon@Fe3O4 particles, and a physical hybrid method was used to prepare the activated carbon@Fe3O4/paraffin composites with the mass ratio of activated carbon@Fe3O4 and paraffin fixed at 1![[thin space (1/6-em)]](https://www.rsc.org/images/entities/char_2009.gif) :
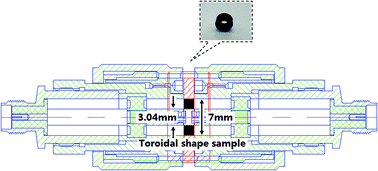
:![[thin space (1/6-em)]](https://www.rsc.org/images/entities/char_2009.gif) 1 because the mixtures would have become very hard to shape when the particles were overloaded. Then, the produced mixtures were pressed into a toroidal shape with an outer diameter of 7 mm, inner diameter of 3.04 mm, and thicknesses of 2–5 mm. Thus, the S-parameters (i.e. S11 and S21) could be measured with the coaxial transmission and reflection method at 0.5–3 GHz on a TIANDA TD3618C Vector Network Analyzer, and the details of the practical measurement process at room temperature are shown in Fig. 1. Finally, the electromagnetic parameters (i.e. relative complex permittivity and permeability) of the composites were calculated according to the theory of Nicolson and Ross.24
1 because the mixtures would have become very hard to shape when the particles were overloaded. Then, the produced mixtures were pressed into a toroidal shape with an outer diameter of 7 mm, inner diameter of 3.04 mm, and thicknesses of 2–5 mm. Thus, the S-parameters (i.e. S11 and S21) could be measured with the coaxial transmission and reflection method at 0.5–3 GHz on a TIANDA TD3618C Vector Network Analyzer, and the details of the practical measurement process at room temperature are shown in Fig. 1. Finally, the electromagnetic parameters (i.e. relative complex permittivity and permeability) of the composites were calculated according to the theory of Nicolson and Ross.24
The dielectric loss tangent, magnetic loss tangent and frequency dependent Zin/Z0 values of the activated carbon@Fe3O4/paraffin composites were calculated based on the transmission line theory and the electromagnetic parameters measured above. The input impedance Zin can be expressed as follows:25
 | (1) |
 | (2) |
3. Results and discussion
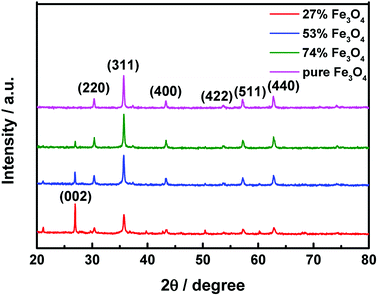
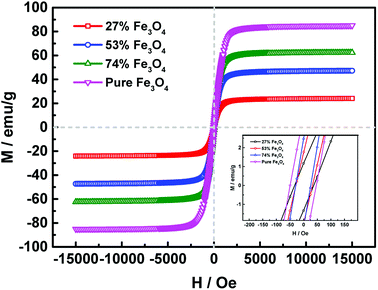
The crystal structures of the activated carbon@Fe3O4 composites were measured using an XRD diffractometer. Fig. 2 presents the diffraction patterns of the as-prepared samples. The characteristic diffraction peaks at 2θ = 31.24°, 36.82°, 44.76°, 55.62°, 59.30° and 65.19° are in good agreement with the (220), (311), (400), (422), (511) and (440) planes of Fe3O4, respectively, as reported in the standard card (JCPDS card no. 26-1136).26 Also, the peak at about 2θ = 26.20° is assigned to the (002) plane of the fluffy structured activated carbon (JCPDS card no. 26-1076).27 It is observed that the intensity of the Fe3O4 diffraction peaks enhance with an increase in the Fe3O4 NP loading content and that of the activated carbon decrease during the same process. This above phenomenon suggests that the Fe3O4 NPs may be successfully introduced on the fluffy structured activated carbon.To verify the magnetic properties of the as-prepared samples, their hysteresis loops were measured using VSM at room temperature, as shown in Fig. 3. It is observed that the saturation magnetization of the composite is strongly related to the loading content of Fe3O4 NPs, and higher loading content leads to larger saturation magnetization. The saturation magnetization values of 24.07 emu g−1, 47.25 emu g−1, 62.43 emu g−1 and 85.05 emu g−1 correspond to 27% Fe3O4, 53% Fe3O4, 74% Fe3O4 and pure Fe3O4 NPs, respectively. Moreover, the remanences and coercivities of the samples are both relatively low, which suggests that the hysteresis loops of the composites exhibit typical paramagnetic behavior.
Fig. 4 shows the microstructures of activated carbon, Fe3O4 NPs and activated carbon@Fe3O4 composites. It shows that the size of the activated carbon is much larger than that of the Fe3O4 NPs prepared via the hydrothermal synthesis method, and the surface of the activated carbon is relatively irregular. The fine Fe3O4 NPs present a ball-like structure and many of them form porous structures by agglomerating with each other. When the loading of the Fe3O4 NPs was relatively low in the composites, there were only a few Fe3O4 NPs loaded on the surface of the activated carbon in the field of view, as shown in Fig. 4(b). This is because the density of activated carbon is much lower than that of Fe3O4. Thus, a low mass content of Fe3O4 results in the amount of activated carbon particles being much more than that of the Fe3O4 NPs. Therefore, the loading capacity of Fe3O4 NPs on the activated carbon is relatively low. This situation was improved when the mass content of Fe3O4 was 53 wt%, where the activated carbon particles were dispersed in the agglomerations of Fe3O4 NPs. However, it was observed that some of the activated carbon particles were not coated well by the agglomerated Fe3O4 NPs, as shown in Fig. 4(c). Nevertheless, as shown in Fig. 4(d), the loading capacity was significantly enhanced with a further increase in the content of Fe3O4 NPs, and most of the activated carbon particles were coated by the agglomerated Fe3O4 NPs. To the best of our knowledge, activated carbon is a dielectric loss absorber, and the microwave absorption of Fe3O4 NPs mainly depends on magnetic loss. It is common knowledge that a modest ratio of complex permeability and permittivity is an important factor in determining the impedance matching of absorbing materials. Thus, the improved impedance matching of the activated carbon@Fe3O4 composites plays an important role in increasing their microwave absorption. Furthermore, the as-prepared composites are paramagnetic and can be attracted by a magnet due to the loading of Fe3O4 NPs on activated carbon, which is shown in Fig. 4(f).
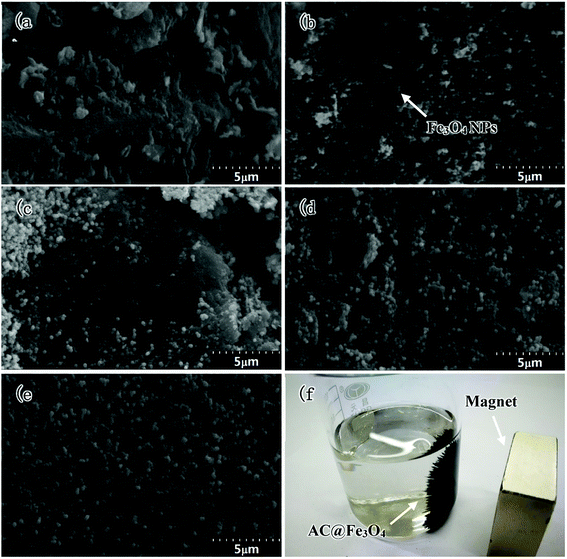 | ||
| Fig. 4 SEM images of activated carbon (a), 27 wt% Fe3O4 (b), 53 wt% Fe3O4 (c), 74 wt% Fe3O4 (d) and pure Fe3O4, (e) and macro-morphology of the activated carbon@Fe3O4 composite (f). | ||
The TEM images and corresponding elemental distributions of the composite with 74 wt% Fe3O4 NPs are shown in Fig. 5. As shown in Fig. 5(a), the as-prepared Fe3O4 NPs are all close to spherical in shape with particle sizes mainly concentrated at about 250 nm. From the HR-TEM image in Fig. 5(b), the good grain orientation of a single Fe3O4 nanoparticle can be observed clearly, and the SAED pattern in this region also demonstrates the crystalline feature of the Fe3O4 NPs. Furthermore, the crystal lattice fringes with a spacing of 0.256 nm can be assigned to the (311) plane of Fe3O4, which is in accordance with the XRD results. In addition, the distribution of elements in the activated carbon@Fe3O4 composite was determined from the corresponding elemental mapping images, as shown in Fig. 5(c–f), in which it can be observed clearly that the composite consists of Fe, O and C elements. The distribution area of C is significantly larger than the corresponding areas of Fe and O, indicating that the Fe3O4 NPs are distributed on the surface of the activated carbon. Thus, combined with the XRD, VSM and SEM results, we can conclude that the Fe3O4 NPs adhered tightly to the surface of the activated carbon.
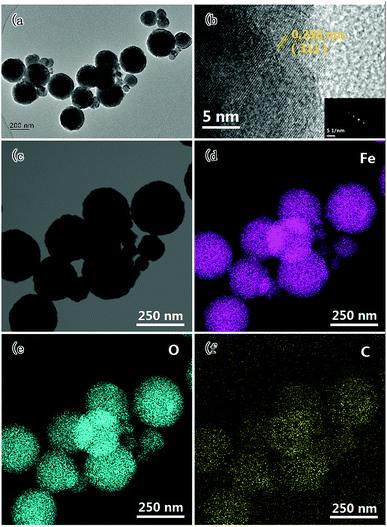 | ||
| Fig. 5 TEM image (a), HR-TEM image (b), and corresponding elemental mapping images (c–f) of the activated carbon@Fe3O4 composites. | ||
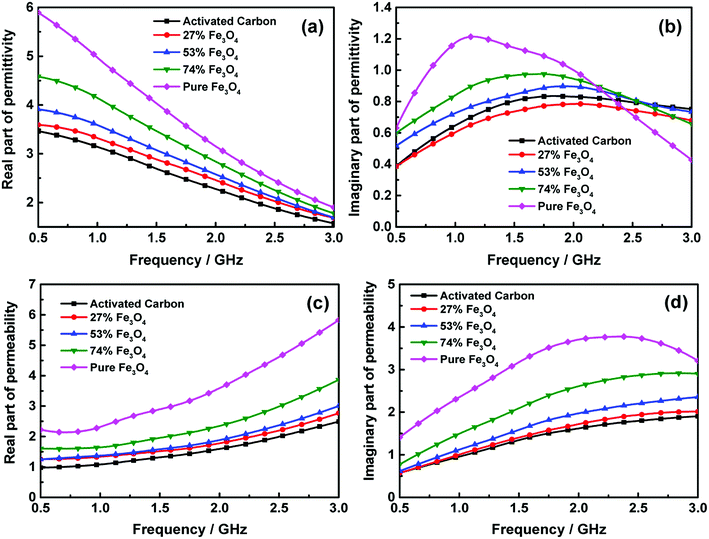
Furthermore, electromagnetic wave absorption performance of the activated carbon@Fe3O4 composites was investigated. Fig. 6 displays the complex permittivity (ε = ε′ − jε′′) and permeability (μ = μ′ − jμ′′) of activated carbon@Fe3O4 composites, which were calculated from the S-parameters measured earlier. These electromagnetic parameters are very important in determining the dielectric and magnetic loss of microwave absorption composites, and the transmission and reflection of electromagnetic waves during the absorption process are also affected by them.28 From Fig. 6(a) and (b), it can be observed that the real part of permittivity of all the samples decrease with an increase in frequency, and the content of Fe3O4 NPs has a significant effect on the real part of permittivity of the as-prepared composite, which increases with an increase in the Fe3O4 NPs loading on the activated carbon. In contrast, the values of the imaginary part first increased and then decreased as the frequency increased. It can be noted that the imaginary part of the pure Fe3O4 NPs is larger when the frequency is relatively lower, and it decreases rapidly as the frequency increases. However, this situation can be improved with the addition of activated carbon, although the values of the imaginary part of the composites decrease to some extent in the low-frequency domain. The imaginary part of the composite with 74 wt% Fe3O4 NPs shows a relatively higher value throughout the measurement range among the samples. Usually, the imaginary part of permittivity represents the dielectric dissipation ability of microwave energy,29 which indicates that the dissipation ability of the composite with 74 wt% Fe3O4 NPs may be better in the entire frequency range. Moreover, we can find that the complex permittivity of the composites exhibits evident frequency dependent dielectric properties. Generally, in the gigahertz frequency range, the permittivity presents a strong dependence on inherent dipole polarization and interfacial polarization, and the displacement current generated from this process always lags behind the build-up potential when the frequency increases. Thus, the real and imaginary parts of permittivity present frequency-related properties.30 Moreover, it is clear that there is a slight effect on the enhancement of the imaginary part of permittivity when the content of Fe3O4 NPs is lower. Hence, it can be concluded that fewer Fe3O4 NPs loaded on activated carbon may have not much effect on enhancing the polarization. Besides, according to the relationship between resistivity and the imaginary part of permittivity:31
 | (3) |
Fig. 6(c) and (d) display the real and imaginary parts of permeability as a function of frequency. It is observed that the real part of permeability only slightly increases when the loading content of Fe3O4 NPs is low. However, it is significantly enhanced with a further increase in Fe3O4 NPs. This is because the real part of permeability is related to saturation magnetization, Ms, as follows:32
| μ′ ∝ 4πMs | (4) |
Also, the Ms of the composites increases significantly with higher loading of Fe3O4 NPs, which leads to the enlargement of the real part of permeability. Besides, it is evident that the real part of permeability of the composites with different loading contents of Fe3O4 NPs increases with an increase in frequency. Moreover, the imaginary part of permeability of the composites has the same variation trend as the real part of permeability; the difference is that a smooth peak value of 2.92 at 2.83 GHz could be observed when the loading content of Fe3O4 NPs is 74 wt%. This demonstrates that the excessive loading of Fe3O4 NPs is unable to enhance the imaginary part of permeability further in the high frequency domain. It is due to that the resonance peak in the imaginary part is ascribed to the domain wall resonance and natural resonance of Fe3O4 NPs loaded on the activated carbon.33
In addition, it can be noted that the complex permittivity and permeability of the activated carbon@Fe3O4 composites are significantly lower than that of the Fe3O4 NPs. The permittivity and permeability of the composites can be adjusted with the addition of activated carbon because the complex permittivity and permeability of activated carbon are much less than that of the Fe3O4 NPs. Hence, the permittivity and permeability of the activated carbon@Fe3O4 composites are reduced with the addition of activated carbon, which indicates that the μ′/ε′ ratio of the activated carbon@Fe3O4 composites can be adjusted in different frequency domains by controlling the content of activated carbon. According to the impedance matching theory, the incident microwaves can have much easier access to the materials to be dissipated when their permeability is closer to their permittivity, which is beneficial to improve the microwave absorption properties of the composites.
Fig. 7(a) and (b) show the dielectric and magnetic loss tangent as a function of frequency, which can be calculated based on the measured electromagnetic parameters above. The results indicate that the dielectric loss tangent of the pure Fe3O4 NPs first increases and then decreases as the frequency increases, particularly in the high frequency domain, it decreases rapidly. In contrast, the dielectric loss tangent of the activated carbon increases continuously with an increase in frequency, which demonstrates the excellent dielectric loss properties of activated carbon. Consequently, the loading of Fe3O4 NPs on activated carbon takes advantage of this superiority to improve the dielectric loss properties of the pure Fe3O4 NPs in the high frequency domain. Moreover, it can be noted that the magnetic loss tangent of the Fe3O4 NPs is a slightly larger than that of the activated carbon in the low frequency domain; nonetheless, it reduces sharply as the frequency increases. The magnetic loss tangent of the composite with 74 wt% Fe3O4 NPs is relatively higher in the entire measured frequency range with a peak value of 1.13 at 1.8 GHz. This is mainly because the morphology of the Fe3O4 NPs prepared via the hydrothermal synthesis method is ball-like. In fact, the flake-shaped particles with planar anisotropy have higher magnetic loss tangent than the sphere-shaped particles due to their higher Snoek's limits,34–36 which leads to the magnetic loss properties of the as-prepared pure Fe3O4 NPs not being sufficiently large. Nevertheless, the loading of the Fe3O4 NPs on activated carbon may modify the magnetic loss properties of the composites to a certain extent, and the magnetic loss tangent slightly increases with an increase in the Fe3O4 NPs loading content.
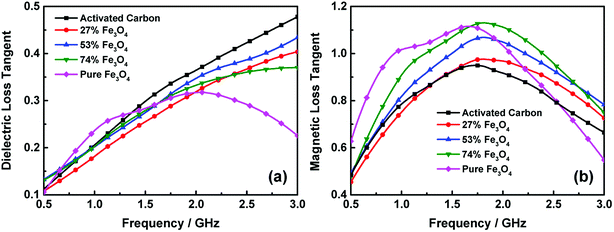 | ||
| Fig. 7 Frequency dependence of the dielectric loss tangent (a) and magnetic loss tangent (b) of the activated carbon@Fe3O4 composites with thickness of 5 mm. | ||
Furthermore, it can be noted that the dielectric and magnetic loss tangent of the composites can both achieve higher values when the loading content of Fe3O4 NPs on activated carbon is within a proper range. This is because the interface polarization is enhanced with an increase in charges transferring through the interfaces between the Fe3O4 NPs and activated carbon. Moreover, it can be also found that the magnetic loss tangent is only slightly larger than the dielectric loss tangent, which indicates that both the dielectric and magnetic loss contribute to the microwave absorption in the as-prepared composites.
Usually, the microwave reflection loss can be used to characterize the microwave absorption properties of materials. Fig. 8 presents the microwave reflection losses of the activated carbon@Fe3O4 composites with different absorption thicknesses, which were calculated according to the measured electromagnetic parameters and transmission line theory. As shown in Fig. 8(a), the reflection loss of the electromagnetic wave increases as the frequency increases. Moreover, the RL curve is enhanced with an increase in the loading content of Fe3O4 NPs. Also, no electromagnetic wave absorption peak was observed in the measurement range when the thickness of the composites was 2 mm. In addition, compared to the pure Fe3O4 NPs, it is interesting to note that the electromagnetic wave absorption ability of the composite is stronger when the loading content of Fe3O4 NPs is 74 wt%, which indicates that the microwave absorption properties are enhanced when a suitable content of activated carbon was added. This is because the electromagnetic wave absorption of the pure Fe3O4 NPs is mainly due to natural resonance and domain wall resonance, and the addition of activated carbon in a suitable range could introduce the dielectric loss of activated carbon and also enhance the interface polarization between the interface of the Fe3O4 NPs and activated carbon. The absorption bandwidths with an RL curve lower than −5 dB at the thickness of 2 mm are 0 GHz, 0 GHz, 0.11 GHz (2.89–3 GHz), 0.74 GHz (2.26–3 GHz) and 0.53 GHz (2.47–3 GHz), which correspond to the activated carbon, 27% Fe3O4, 53% Fe3O4, 74% Fe3O4 and pure Fe3O4, respectively. Nevertheless, the bandwidths of the composites add up to 0.34 GHz (2.66–3 GHz), 0.48 GHz (2.52–3 GHz), 0.44 GHz (2.56–3 GHz), 1.34 GHz (1.66–3 GHz) and 1.1 GHz (1.9–3 GHz) when the thickness of the sample is 3 mm. Also, in particular, a single absorption peak of 74% Fe3O4 starts to appear because the materials with increased thickness exhibited more efficient microwave absorption.
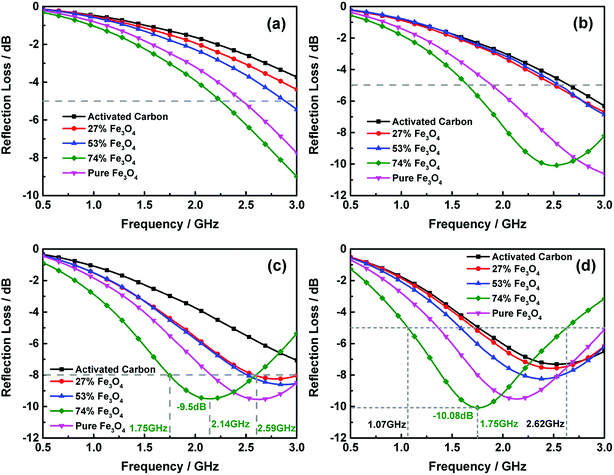 | ||
| Fig. 8 Frequency dependence of the microwave reflection loss curves at different thicknesses of 2 mm (a), 3 mm (b), 4 mm (c) and 5 mm (d). | ||
The microwave reflection losses of the activated carbon@Fe3O4 composites at the thickness of 4 mm are shown in Fig. 8(c), which demonstrates that the maximum RL peaks of the samples appeared in this measurement range. However, the absorption intensity of the 74 wt% Fe3O4 composite is almost the same as that of pure Fe3O4, while both the RL peak position and bandwidth of the former are relatively lower. Thus, it is clear that the electromagnetic wave absorption performance of the Fe3O4 NPs in the low frequency band can be improved by loading them on activated carbon with a suitable content, e.g., the maximum reflection loss is −9.5 dB at 2.14 GHz with a −8 dB bandwidth over the frequency range of 0.84 GHz (1.75–2.59 GHz) when the content of Fe3O4 NPs is 74 wt%.
The as-prepared activated carbon@Fe3O4 composites have greater effect on the microwave absorption in the measurement frequency range when their thickness is 5 mm, and their RL curves are presented in Fig. 8(d). It can be observed that reflection absorption peaks appeared in all the samples with different loading contents of Fe3O4 NPs, and the position of the RL peaks also shifted to a lower frequency range, particularly for the 74 wt% Fe3O4 sample. This is due to the quarter wavelength resonance effect, and the matching mode can be expressed as follows:37
 | (5) |
| (ε′ − ε∞)2 + (ε′′)2 = (εs − ε∞)2 | (6) |
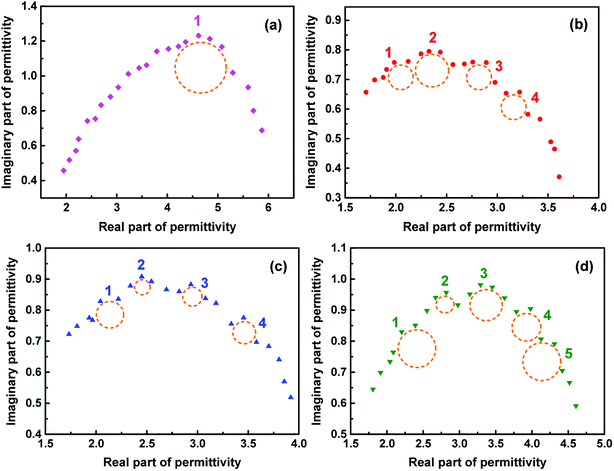 | ||
| Fig. 9 Plots of ε′–ε′′ for pure Fe3O4 (a), 27% Fe3O4 (b), 53% Fe3O4 (c) and 74% Fe3O4 (d) with thickness of 5 mm. | ||
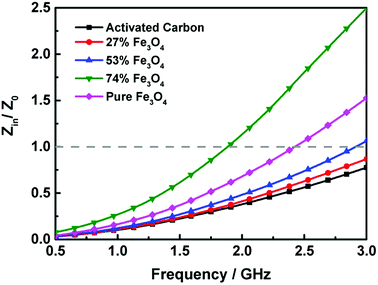 | ||
| Fig. 10 Frequency dependent Zin/Z0 values of the activated carbon@Fe3O4 composites with thickness of 5 mm. | ||
The detailed microwave absorption performances of activated carbon@Fe3O4 composites and a comparison of other representative composites are summarized in Table 1.18–20,41,42 As shown in Table 1, carbon materials are often composited with ferrites to optimize their microwave absorption properties. Thus, the composites simultaneously present both dielectric loss and magnetic loss, which are highly conducive to their microwave absorption performance. Moreover, this finding indicates that most of the composites based on carbon materials and ferrites have stronger microwave absorption ability in the frequency range of 2–18 GHz, in which above 90% microwave energy can be dissipated as the RL is below −10 dB. Moreover, the absorption frequency range of the as-prepared activated carbon@Fe3O4 composite in the present study is the lowest compared with those obtained in other investigations, and its absorption band shifts further to lower frequency as its thickness increases.
| Material | Thickness | RL < −5 dB | RL < −10 dB | Minimum RL | Ref. |
|---|---|---|---|---|---|
| AC@Fe3O4 (74% NPs) | 2 mm | 2.26–3 GHz | — | −8.99 dB | This work |
| AC@Fe3O4 (74% NPs) | 3 mm | 1.66–3 GHz | — | −10.09 dB | This work |
| AC@Fe3O4 (74% NPs) | 4 mm | 1.35–3 GHz | — | −9.51 dB | This work |
| AC@Fe3O4 (74% NPs) | 5 mm | 1.07–2.62 GHz | — | −10.08 dB | This work |
| ZnO/Fe3O4/GO | 2 mm | 6.4–8 GHz | — | −7.2 dB | 18 |
| ZnFe2O4@rGO@TiO2 | 2.5 mm | — | 2.8–5.4 GHz | −55.6 dB | 19 |
| MWCNTs/Fe3O4 | 2 mm | — | 10.9–12.4 GHz | −18.22 dB | 20 |
| GO/CNT-Fe3O4 | 5 mm | — | 3.5–4.5 GHz | −37.3 dB | 41 |
| PANI/Fe3O4/MWCNT | 4 mm | — | 8–15 GHz | −16 dB | 42 |
Overall, activated carbon@Fe3O4 composites with superior absorption performances in the low frequency band can be obtained by controlling the loading content of Fe3O4 NPs on activated carbon. Most importantly, the hydrothermal method used in our preparation is relatively simple with no need for complex reactions and treatments. Hence, the composite reported herein can be used as a promising electromagnetic wave absorbing material in the low frequency band of 0.5–3 GHz.
4. Conclusions
In summary, activated carbon@Fe3O4 composites were synthesized via the hydrothermal synthesis method, and their electromagnetic wave absorption performances were also investigated in the low frequency band of 0.5–3 GHz. Dielectric and magnetic loss both contribute to the electromagnetic wave absorption performance of the activated carbon@Fe3O4 composites, and the loading content of Fe3O4 NPs on activated carbon can modify their electromagnetic wave absorption properties. The maximum RL of −10.08 dB at 1.75 GHz with a −5 dB bandwidth over a broad frequency range of 1.55 GHz (1.07–2.62 GHz) was obtained when the percentage of Fe3O4 NPs and thickness of the composite were 74 wt% and 5 mm, respectively. This investigation presents a facile method to fabricate electromagnetic wave absorption composites with good performances in the low frequency band and suggests that activated carbon@Fe3O4 composites are promising candidates for electromagnetic wave absorption in the low frequency band of 0.5–3 GHz.Conflicts of interest
There are no conflicts to declare.Acknowledgements
The authors are grateful to the National Natural Science Foundation of China (No. 51704242), the Innovation Training Program of Sichuan Agricultural University (No. 201810626001), and the Research Interest Training Program of Sichuan Agricultural University (No. 04055798).References
- X. Chen, F. Meng, Z. Zhou, X. Tian, L. Shan, S. Zhu, X. Xu, M. Jiang, L. Wang, D. Hui, Y. Wang, J. Lu and J. Gou, Nanoscale, 2014, 6, 8140 RSC.
- J. Ling, W. Zhai, W. Feng, B. Shen, J. Zhang and W. Zheng, ACS Appl. Mater. Interfaces, 2013, 5, 2677 CrossRef PubMed.
- A. K. Dhami, Environ. Monit. Assess., 2012, 184, 6507 CrossRef PubMed.
- L. Kong, X. Yin, X. Yuan, Y. Yuan, Y. Zhang, X. Liu, L. Cheng and L. Zhang, Carbon, 2014, 73, 185 CrossRef.
- M. Han, D. Liang and L. Deng, Appl. Phys. Lett., 2011, 99, 082503 CrossRef.
- H. Wang, Y. Dai, W. Gong, D. Geng, S. Ma, D. Li, W. Liu and Z. Zhang, Appl. Phys. Lett., 2013, 102, 223113 CrossRef.
- H. Luo, W. Chen, W. Zhou, L. Long, L. Deng, P. Xiao and Y. Li, Ceram. Int., 2017, 43, 12328 CrossRef.
- S. Yun, A. Kirakosyan, S. Surabhi, J. R. Jeong and J. Choi, J. Mater. Chem. C, 2017, 5, 8436 RSC.
- Y. Xu, L. Yuan, Z. Liang, X. Wang and X. Li, J. Alloys Compd., 2017, 704, 593 CrossRef.
- O. Khani, M. Z. Shoushtari, K. Ackland and P. Stamenov, J. Magn. Magn. Mater., 2017, 428, 28 CrossRef.
- D. L. Zhao and Z. M. Shen, Mater. Lett., 2008, 62, 3704 CrossRef.
- N. Tang, Y. Yang, K. Lin, W. Zhong, C. Au and Y. Du, J. Phys. Chem. C, 2008, 112, 10061 CrossRef.
- R. H. Baughman, A. A. Zakhidov and W. A. de Heer, Science, 2002, 297, 787 CrossRef PubMed.
- L. Zhang, Q. Q. Ni, T. Natsuki and Y. Fu, Appl. Surf. Sci., 2009, 255, 8676 CrossRef.
- Y. Shan, K. Chen, X. Yu and L. Gao, Appl. Surf. Sci., 2010, 257, 362 CrossRef.
- X. L. Shi, M. S. Cao, J. Yuan and X. Y. Fang, Appl. Phys. Lett., 2009, 95, 163108 CrossRef.
- F. S. Wen, F. Zhang and Z. Y. Liu, J. Phys. Chem. C, 2011, 115, 14025 CrossRef.
- B. Heidari, M. Ansari, A. Hoseinabadi, H. Jiriaee and F. Heidary, J. Mater. Sci.: Mater. Electron., 2017, 28, 1028 CrossRef.
- Y. Wang, H. Y. Zhu, Y. B. Chen, X. M. Wu, W. Z. Zhang, C. Y. Luo and J. H. Li, Mater. Chem. Phys., 2017, 202, 184 CrossRef.
- C. L. Hou, T. H. Li, T. K. Zhao, H. G. Liu, L. H. Liu and W. J. Zhang, New Carbon Mater., 2013, 28, 184 CrossRef.
- P. Sardarian, H. N. Moosavy and S. S. S. Afghahi, J. Magn. Magn. Mater., 2017, 441, 257 CrossRef.
- Y. Y. Lan, X. H. Li, Y. Zong, Z. X. Li, Y. Sun, G. G. Tan, J. Feng, Z. Y. Ren and X. L. Zheng, Ceram. Int., 2016, 42, 19110 CrossRef.
- H. Deng, X. L. Li, Q. Peng, X. Wang, J. P. Chen and Y. D. Li, Angew. Chem., Int. Ed., 2005, 117, 2842 CrossRef.
- A. M. Nicolson and G. F. Ross, IEEE Trans. Instrum. Meas., 1970, 19, 377 Search PubMed.
- X. Weng, B. Li, Y. Zhang, X. Lv and G. Gu, J. Alloys Compd., 2017, 695, 508 CrossRef.
- J. P. Wang, J. Wang, R. X. Xu, Y. Sun, B. Zhang, W. Chen, T. Wang and S. Yang, J. Alloys Compd., 2015, 653, 14 CrossRef.
- Y. M. Huang, Q. Qi, H. Pan, X. F. Lei and X. B. Liu, J. Mater. Sci.: Mater. Electron., 2016, 27, 9577 CrossRef.
- D. Micheli, C. Apollo, R. Pastore and M. Marchetti, Compos. Sci. Technol., 2010, 70, 400 CrossRef.
- X. F. Liu, X. R. Cui, Y. X. Chen, X. J. Zhang, R. H. Yu, G. S. Wang and H. Ma, Carbon, 2015, 95, 870 CrossRef.
- W. L. Song, M. S. Cao, M. M. Lu, J. Liu, J. Yuan and L. Z. Fan, J. Mater. Chem. C, 2013, 1, 1846 RSC.
- X. F. Zhang, X. L. Dong, H. Huang, Y. Y. Liu, W. N. Wang, X. G. Zhu, B. Lv and J. P. Lei, Appl. Phys. Lett., 2006, 89, 053115 CrossRef.
- K. Butter, P. H. H. Bomans, P. M. Frederik, G. J. Vroege and A. P. Philipse, Nat. Mater., 2003, 2, 88 CrossRef PubMed.
- H. Zhao, X. Sun, C. Mao and J. Du, Phys. B, 2009, 404, 69 CrossRef.
- S. S. Kim, S. T. Kim, Y. C. Yoon and K. S. Lee, J. Appl. Phys., 2005, 97, 10F905 CrossRef.
- B. S. Zhang, Y. Feng, J. Xiong, Y. Yang and H. X. Lu, IEEE Trans. Magn., 2006, 42, 1778 Search PubMed.
- L. Qiao, R. Han, T. Wang, L. Y. Tang and F. S. Li, J. Magn. Magn. Mater., 2015, 375, 100 CrossRef.
- R. Li, T. Wang, G. G. Tan, W. L. Zuo, J. Q. Wei, L. Qiao and F. S. Li, J. Alloys Compd., 2014, 586, 239 CrossRef.
- I. W. Nam, H. K. Lee and J. H. Jang, Composites, Part A, 2011, 42, 1110 CrossRef.
- Y. C. Du, W. W. Liu, R. Qiang, Y. Wang, X. J. Han, J. Ma and P. Xu, ACS Appl. Mater. Interfaces, 2014, 6, 12997 CrossRef PubMed.
- L. Y. Zhu, X. J. Zeng, M. Chen and R. H. Yu, RSC Adv., 2017, 7, 26801 RSC.
- L. N. Wang, X. L. Jia, Y. F. Li, F. Yang, L. Q. Zhang, L. P. Liu, X. Ren and H. T. Yang, J. Mater. Chem. A, 2014, 2, 14940 RSC.
- M. S. Cao, J. Yang, W. L. Song, D. Q. Zhang, B. Wen, H. B. Jin, Z. L. Hou and J. Yuan, ACS Appl. Mater. Interfaces, 2012, 4, 6949 CrossRef PubMed.
| This journal is © The Royal Society of Chemistry 2018 |

