DOI:
10.1039/C8RA03513J
(Paper)
RSC Adv., 2018,
8, 23040-23047
Capacitive performance of vertically aligned reduced titania nanotubes coated with Mn2O3 by reverse pulse electrodeposition
Received
24th April 2018
, Accepted 5th June 2018
First published on 25th June 2018
Abstract
In this study, a composite material, manganese oxide/reduced titania nanotubes (Mn2O3/R-TNTs), was synthesized through incorporation of Mn2O3 onto R-TNTs via the reverse pulse electrodeposition technique. The influence of pulse reverse duty cycles on the morphological, structural and electrochemical performance of the surface was studied by varying the applied duty cycle from 10% to 90% for 5 min total on-time at an alternate potential of −0.90 V (Eon) and 0.00 V (Eoff). FESEM analysis revealed the uniform deposition of Mn2O3 on the circumference of the nanotubes. The amount of Mn2O3 loaded onto the R-TNTs increased as a higher duty cycle was applied. Cyclic voltammetry and galvanostatic charge–discharge tests were employed to elucidate the electrochemical properties of all the synthesized samples in 1 M KCl. The specific capacitance per unit area was greatly enhanced upon the incorporation of Mn2O3 onto R-TNTs, but showed a decrease as a high duty cycle was applied. This proved that low amounts of Mn2O3 loading enhanced the facilitation of the active ions for charge storage purposes. The optimized sample, Mn2O3/R-TNTs synthesized at 10% duty cycle, exhibited high specific capacitance of 18.32 mF cm−2 at a current density of 0.1 mA cm−2 obtained from constant current charge–discharge measurements. This revealed that the specific capacitance possessed by Mn2O3/R-TNTs synthesized at 10% duty cycle was 6 times higher than bare R-TNTs.
Introduction
Supercapacitors have attracted wide attention as promising energy storage devices in many applications as they offer greater power density and longer cycle life than batteries, and higher energy density than conventional capacitors.1–3 They can be categorized into two ways of storing energy, either by ion absorption (electrochemical double-layered capacitors) or by surface redox reaction (pseudocapacitors). Studies on electrochemical double-layered capacitors mainly focus on carbon materials with high surface area such as carbon, carbon aerogel, activated carbon and carbon nanotubes.4–8 As for pseudocapacitors, electroactive materials with several redox states have been excessively studied such as RuO2,9,10 NiO,11,12 Co2O3,13,14 MnO2,15,16 MoS,17 SnO2,18 NiS19,20 and conducting polymers.21–23
Nanomaterials have garnered great interest as supercapacitive materials as they may improve the power capabilities and life cycles of supercapacitors due to their high surface area.24–26 One dimensional (1D) nanoarrays such as nanotubes, nanowires and nanorods are extensively studied due to their high interfacial area and suitability in the design of electrical devices. Moreover, these nanomaterials promote binder-free electrodes whereby samples were directly grown on conductive substrates that help in facilitating the diffusion of active ions, and the coated films can be analyzed upon heat treatment without any further processing steps.
Recently, highly ordered titania nanotubes (TNTs), synthesized by an electrochemical anodization method, have received a lot of interest for supercapacitor applications due to their large surface area, high ion accessibility, controllable tube structure and relatively low cost.27–30 However, TNTs suffer from a very low specific capacitance due to their poor electrical conductivity.31,32 In order to enhance the capacitive performance of TNTs, many attempts have been carried out by various electrochemical approaches33 and thermal treatments.34,35 In our previous study, we modified TNTs by an electrochemical reduction method whereby oxygen vacancies were introduced into the lattice of the TNTs upon the reduction of Ti4+ to Ti3+.36 Attempts to incorporate metal oxides into the modified titania nanotubes in order to further enhance the capacitive performance of the samples have been conducted by the electrodeposition method. Electrodeposition is an advantageous method as it can control the composition and thickness of the thin film, consumes less energy, is inexpensive, simple and can be easily implemented.37 Moreover, this method can easily control the resulting morphology by adjusting the deposition parameters.38–40 There are various electrodeposition modes that can be employed to deposit metal oxide: cyclic voltammetry deposition and potentiostatic (chronoamperometry), galvanostatic (chronopotentiometry) and pulse electrodeposition. These different electrodeposition modes have significantly affected the resulting surface morphology, crystal structure and the electrochemical performance of the prepared samples. However, approaches using potentiostatic41,42 and galvanostatic42 modes have caused the deposit to cover the openings of the nanotubes. This has resulted in a lower surface area being generated, which may lead to a reduction in specific capacitance values.
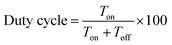
Reverse pulse electrodeposition is one of the electrodeposition modes that offers several advantages compared to the other electrodeposition modes. This mode allows independent variation of pulse waveform, cathodic/anodic pulses, duty cycle and applied potential in order to enhance the characteristics of the deposits in terms of the morphology, adhesion, composition, crystallinity and electrical properties.43–45 Smooth and homogenous deposits can be obtained by this technique as the charge-transfer process is controlled by varying the duty cycle. By adjusting the duty cycle of the deposition, the active deposition time (Ton) and rest time (Toff) can be controlled, and so the duty cycle parameter plays a crucial role in ensuring the uniformity of the deposition as well as the size of the deposits.46
In this work, a reverse pulse electrodeposition method has been used to deposit manganese oxide onto the modified titania nanotubes (R-TNTs). The duty cycle of the electrodeposition was varied in order to find the desired morphology that was able to maintain the large surface area of the titania nanotubes and exhibit high specific capacitance. To the best of our knowledge, there is no comparative study that has reported previously on the influence of duty cycle on the morphological, structural and electrochemical performance of manganese oxide/modified titania nanotubes. We highlighted that Mn2O3 nanoparticles were successfully deposited on the circumference of the nanotubes and the surface morphology of each sample varied with the applied duty cycle. It was demonstrated that the morphology and the electrochemical performance of all the synthesized samples were influenced by the applied duty cycle.
Experimental
Preparation of modified titania nanotubes (R-TNTs)
Pure Ti foil with an area of 1 cm x 2 cm (0.125 mm thick, 99.7% purity, Sigma Aldrich) was cleaned by a series of ultrasonications in isopropanol, acetone and deionized water (DI) followed by chemical etching in 3 M HNO3 (65% MERCK) for 10 min. The clean Ti foil was rinsed with DI water and dried in air. Anodization of Ti was carried out using a two-electrode electrochemical cell with high density graphite as the cathode in ethylene glycol (EG) (99.8% purity, initial water content <0.03 wt%, Fisher Scientific) electrolyte containing 0.5 wt% NH4F (FLUKA) and 95 vol% of water at a constant voltage of 40 V for 1 h using a DC power supply (Consort Mini, Cleaver Scientific Ltd). The distance between both electrodes was fixed at 3 cm in all experiments. Then, the samples were immediately rinsed with DI water, dried and calcined at 500 °C in air for 2 h with a heating rate of 2 °C min−1.
The sample was further modified by an electrochemical reduction method using a two-electrode electrochemical cell with the coated sample as the cathode, while the high density graphite electrode was used as the anode. The electrochemical reduction of the sample was performed in 0.5 M Na2SO4 (Bendosen) solution at 5 V for 30 s. The sample was dried at room temperature.
Preparation of Mn2O3/R-TNTs
Electrodeposition of Mn2O3 was carried out using a reverse pulse electrodeposition method in manganese sulphate (MnSO4, 5 mM) aqueous solution containing sodium sulphate (Na2SO4). A potentiostat–galvanostat (Autolab PGSTAT204/FRA32M module) was used for the electrodeposition, where R-TNTs was the working electrode, Ag/AgCl (3 M KCl) was the reference electrode and platinum wire was the counter electrode. The electrochemical deposition was performed at a constant potential of −0.90 V (on-time) and 0.00 V (off-time) (E vs. Ag/AgCl) at ambient temperature. The deposition time (total Ton) was constant at 5 min and the duty cycle was varied from 10% to 90%. The duty cycle used in this study was defined as the following equation:| |
 | (1) |
where Ton and Toff represent the period at pulse-on potential and pulse-off potential, respectively. The details of the duty cycles used in this study are listed in Table 1. The as-deposited Mn2O3/R-TNTs sample was rinsed with DI water and subsequently dried in an oven at 90 °C for 1 h.
Table 1 The details of the duty cycles used in the study
| Duty cycle (%) |
On-time (s) |
Off-time (s) |
Number of cycles |
| 10 |
1 |
9 |
300 |
| 25 |
1 |
3 |
300 |
| 50 |
1 |
1 |
300 |
| 75 |
3 |
1 |
100 |
| 90 |
9 |
1 |
33 |
Material characterisations and electrochemical measurements
The morphology and the microstructure of the samples were examined by field emission scanning electron microscopy (FESEM, JSM-7600F, JOEL, Japan). X-ray diffraction patterns of the samples were collected by an X-ray diffractometer (Shimadzu, D60000, Japan) using Cu Kα (λ = 1.5406 Å) to investigate the phase and composition of the prepared samples.
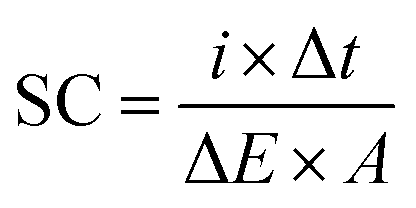
A three-electrode cell system composed of Pt wire as the counter electrode, Ag/AgCl (3 M KCl) as the reference electrode and the coated samples as the working electrode were used in 1 M KCl aqueous electrolyte. The electrochemical performance of the coated electrodes was evaluated by cyclic voltammetry (CV) and a galvanostatic charge–discharge test using a potentiostat-galvanostat (Autolab PGSTAT204/FRA32M module). The specific capacitance (SC) values of the synthesized samples were calculated using the following equation:
| |
 | (2) |
where Δ
Q is total amount of charge accumulated over the potential windows Δ
V,
A is the area of the sample,
I is the respondent current, and Δ
t/Δ
V is the CV scan rate.
Results and discussion
Morphological and structural determination of the Mn2O3 nanoparticles on R-TNTs (Mn2O3/R-TNTs)
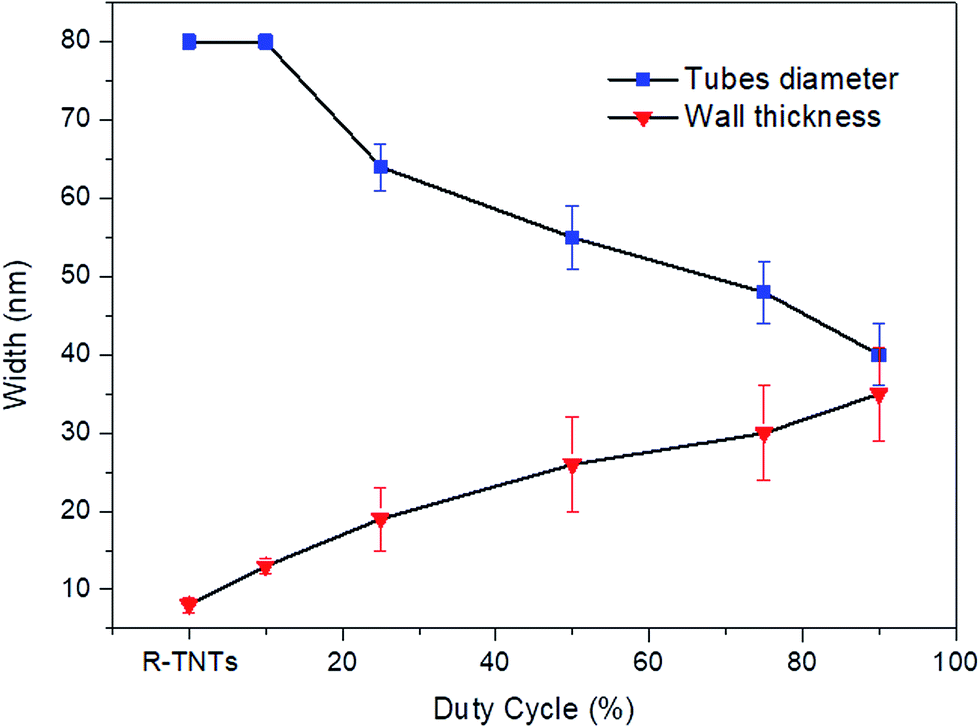
The surface morphologies of R-TNTs and Mn2O3/R-TNTs synthesized at various duty cycles are shown in Fig. 1a–f. The synthesized R-TNTs consist of highly ordered tubes with an average inner diameter and inner wall thickness of 80 nm and 8 nm, respectively. Obvious surface morphology changes could be seen before and after the incorporation with Mn2O3. The synthesized Mn2O3/R-TNTs showed that the Mn2O3 nanoparticles were successfully deposited on the circumference of the nanotubes and the obtained morphological structure of each sample varied with the applied duty cycle. At a low duty cycle (10%), as shown in Fig. 1b, the Mn2O3 nanoparticles were well dispersed on the opening of the nanotubes. Clear cut nanotubes were still obtained upon incorporation with the nanoparticles. However, at higher duty cycles (25%, 50%, 75% and 90%), the deposition of Mn2O3 nanoparticles was partially covering the nanotubes, as displayed in Fig. 1c–f. This leads to a decrease in the surface area of the samples to occur. Image J software was used to measure the inner diameter and wall thickness of the synthesized samples. The inner diameters of the synthesized samples decreased as the wall thicknesses increased. This phenomenon can be observed when the applied duty cycle increases, as shown in Fig. 2. Based on this result, it was confirmed that the amount of deposited Mn2O3 increases with applied duty cycles. In addition, an enhancement in the atomic percentage of Mn with duty cycle was also observed in the EDX analysis results, as displayed in Table 2.
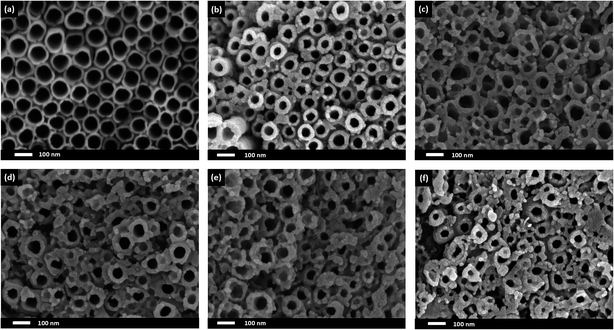 |
| | Fig. 1 FESEM images of (a) R-TNTs and Mn2O3 deposited onto R-TNTs at different duty cycles: (b) 10%, (c) 25%, (d) 50%, (e) 75% and (f) 90% at −0.90 V (Eon) and 0.00 V (Eoff) for 5 min. | |
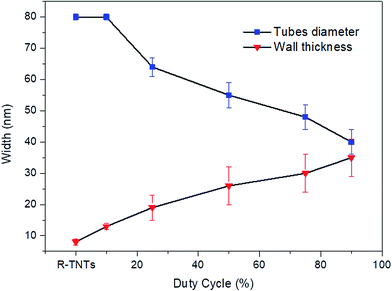 |
| | Fig. 2 Nanotube diameter and wall thickness of Mn2O3/R-TNTs as a function of duty cycle. | |
Table 2 Elemental analysis for Mn2O3/R-TNTs as a function of duty cycle
| Duty cycle % |
Atomic percent (%) |
| Ti |
O |
Mn |
| 10 |
31.98 |
67.44 |
0.58 |
| 25 |
30.40 |
68.83 |
0.77 |
| 50 |
31.75 |
67.14 |
1.11 |
| 75 |
31.55 |
67.02 |
1.43 |
| 90 |
31.40 |
66.86 |
1.74 |
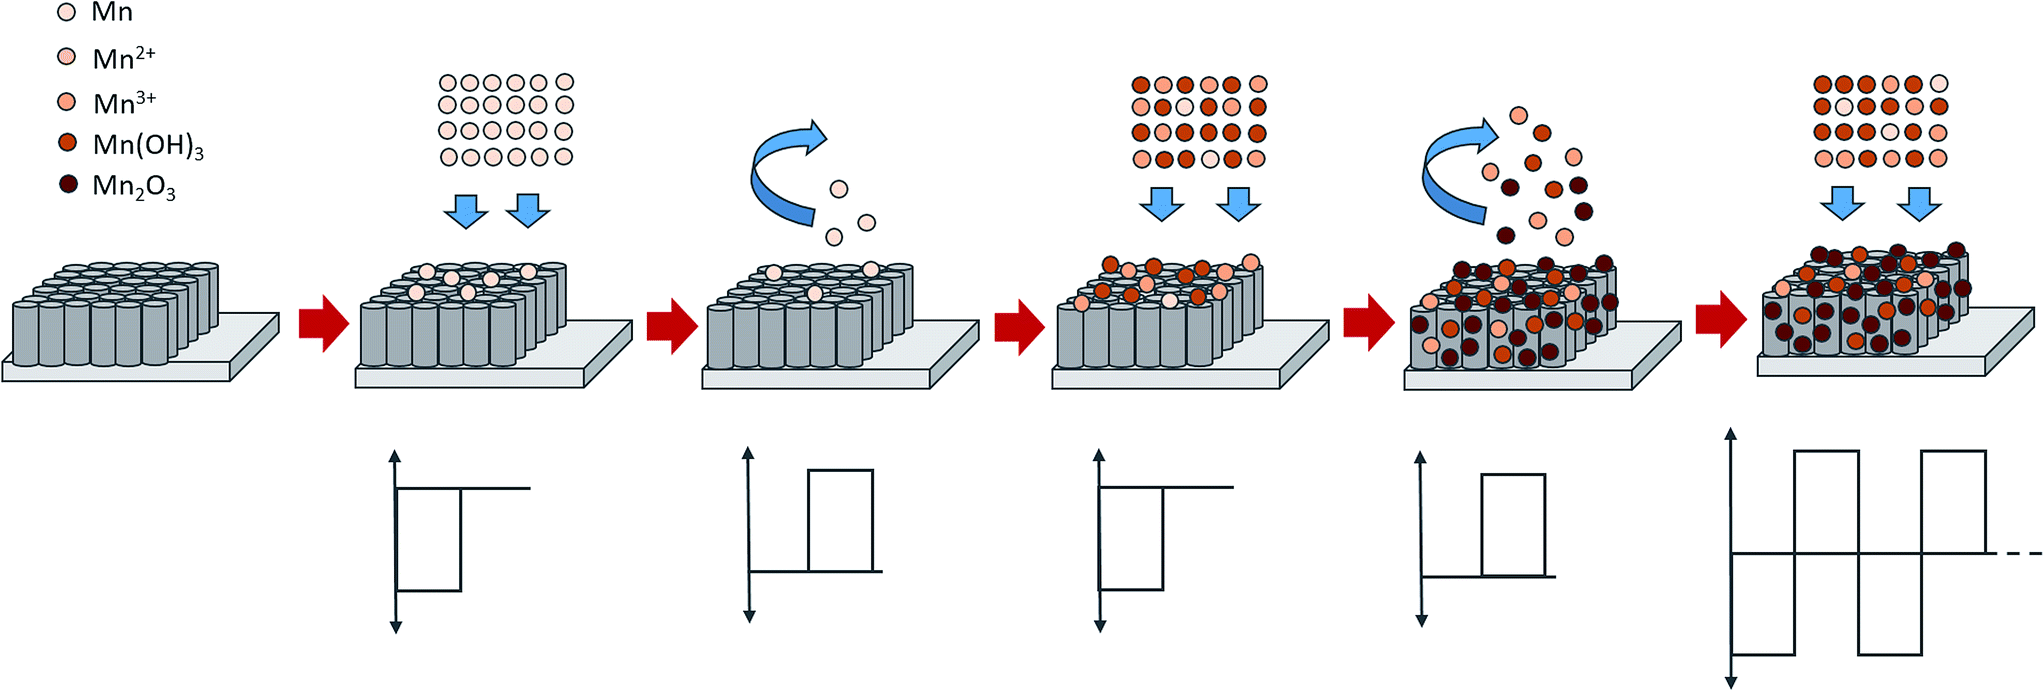
The resulting FESEM images proved that by adjusting the duty cycle of the electrodeposition process, a desired morphological structure could be obtained. By varying the duty cycle, the deposition time interval known as on-time and off-time can be controlled as these settings may affect the size and morphology of the deposit. At 10% duty cycle, when the potential at −0.90 V was supplied during on-time for 1 s, Mn2O3 nuclei were formed on the active site of the nanotube walls. When the off-time (9 s) was applied, re-establishment of the ion concentration to achieve a balanced condition inside the nanotubes may have occurred. During the off-time, the partial dissolution or removal of the passive intermediate species took place longer than the deposition time. Therefore, relatively low amounts of Mn2O3 nuclei will successfully be deposited at the end of the cycle. In the next deposition cycle, new Mn2O3 nuclei will form at the other active site of the nanotube walls leading to a very small number of Mn2O3 nanoparticles being successfully deposited. It is believed that a longer off-time promotes better ion diffusion into the nanotubes, leading to the formation of homogeneous deposition occurring inside the tubes. In comparison to the higher duty cycles, for example the 90% duty cycle, the on-time applied was longer than the off-time (Ton ∼ 9 s, Toff ∼ 1 s), hence this leads to a longer deposition period compared to relaxation time. During the on-time, once a certain amount of Mn2O3 nuclei were formed at the initial stage of deposition, this process will keep on occurring at the same active site as the pulse cycle continues, due to a longer deposition time. The off-time applied is too short to remove the excess passive intermediate species. Therefore, as the new deposition cycle starts, new Mn2O3 nuclei are deposited on the previously deposited nuclei leading to the growth of Mn2O3 nanoparticles.
The plausible formation mechanisms during the reverse pulse electrodeposition involved reduction and oxidation reactions during the on-time and off-time, respectively. At the first pulse cycle, when the on-time was applied, pulse potential was supplied to the system, and the reduction reaction occurred on the surface of the R-TNTs, as below:
It is postulated that some of the remaining Mn2+ ions in the electrolyte were oxidised to Mn3+ during the off-time. In addition, the oxidation reaction also involved Mn(OH)2 and Mn(OH)3. Further oxidation to Mn2O3 may have occurred as well.
| | |
Mn(OH)2 + OH− → Mn(OH)3 + e−
| (6) |
| | |
2Mn2+ + 3H2O → Mn2O3 + 6H+ + 2e−
| (7) |
As the pulse cycle continues, the reduction reaction resumes during the on-time.
| | |
Mn2O3 + 6H+ + 2e− → 2Mn2+ + 3H2O
| (9) |
The oxidation and reduction reactions continued until the end of the electrodeposition process. Even though oxidation and reduction reactions continuously occurred upon electrodeposition, some of the Mn2O3 nanoparticles are successfully deposited, as confirmed by the XRD results. The schematic representation of the proposed mechanisms of reverse pulse electrodeposition is shown in Fig. 3.
 |
| | Fig. 3 The schematic representations of the proposed mechanisms of reverse pulse electrodeposition. | |
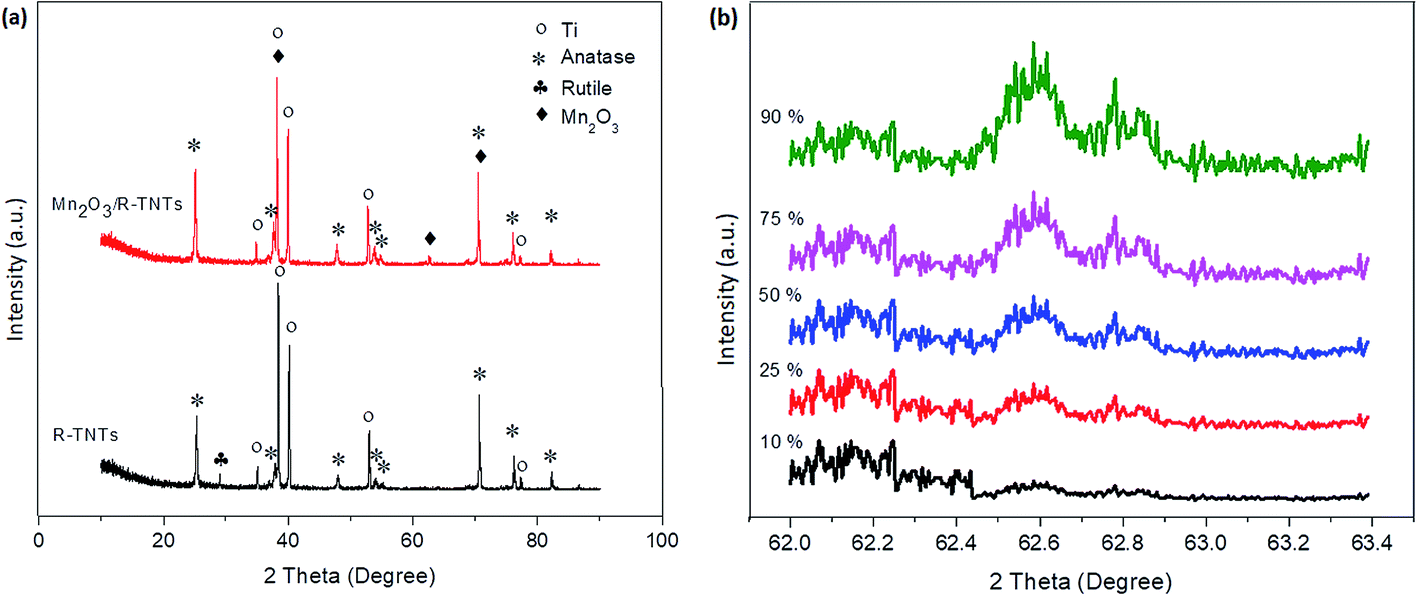
X-ray diffractograms of the R-TNTs and Mn2O3/R-TNTs synthesized at a 10% duty cycle are shown in Fig. 4a. It was found that Mn2O3/R-TNTs were thin film samples with a thickness of approximately ∼2 μm. Therefore, the corresponding diffraction peak for Mn2O3 was not very prominent. A small peak around 2θ ∼ 62.71° was attributed to the main characteristic feature of the [620] plane of the Mn2O3 phase, indexed to JCPDS no. 002-0902. Another three peaks corresponding to Mn2O3 were observed at 2θ ∼ 38.26°, 70.68° and 82.29°, which also overlapped with the diffraction peaks of the Ti substrate. However, these peaks that generated from Mn2O3/R-TNTs appeared to be slightly shifted (±0.05) from the X-ray diffraction peaks of R-TNTs. The crystallite sizes of the synthesized samples were calculated using the Debye–Scherrer equation, as below:
| |
 | (10) |
where
d is the crystallite size,
λ is the wavelength of the Cu K
α radiation (1.542 Å),
θ is the Bragg diffraction angle and
β is the full width of the half maximum (FWHM) of the diffraction peak. The diffraction peaks of TiO
2 (2
θ = 25.25°) and Mn
2O
3 (2
θ = 62.71°) were selected for the calculation of the crystallite size. The crystallite size of TiO
2 was found to be 38.0 nm, while Mn
2O
3 nanoparticles synthesized at 10%, 25%, 50%, 75% and 90% duty cycles were 13.6 nm, 18.5 nm, 21.3 nm, 22.7 nm and 23.1 nm, respectively.
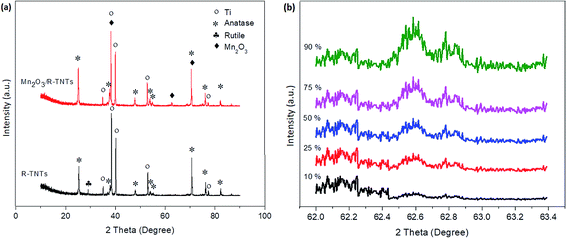 |
| | Fig. 4 XRD patterns of (a) R-TNTs and Mn2O3/R-TNTs synthesized at 10% duty cycle and (b) Mn2O3/R-TNTs synthesized at various duty cycles for the diffraction peak of Mn2O3 (2θ = 62.71°). | |
Fig. 4b displays the XRD of Mn2O3/R-TNTs synthesized at various duty cycles for the diffraction peak of Mn2O3 (2θ = 62.71°). It can be observed that the intensity of the diffraction peak of Mn2O3 increased as a function of duty cycle as this confirmed that the amount of Mn2O3 deposited onto the R-TNTs increased at higher duty cycles.
Electrochemical performance
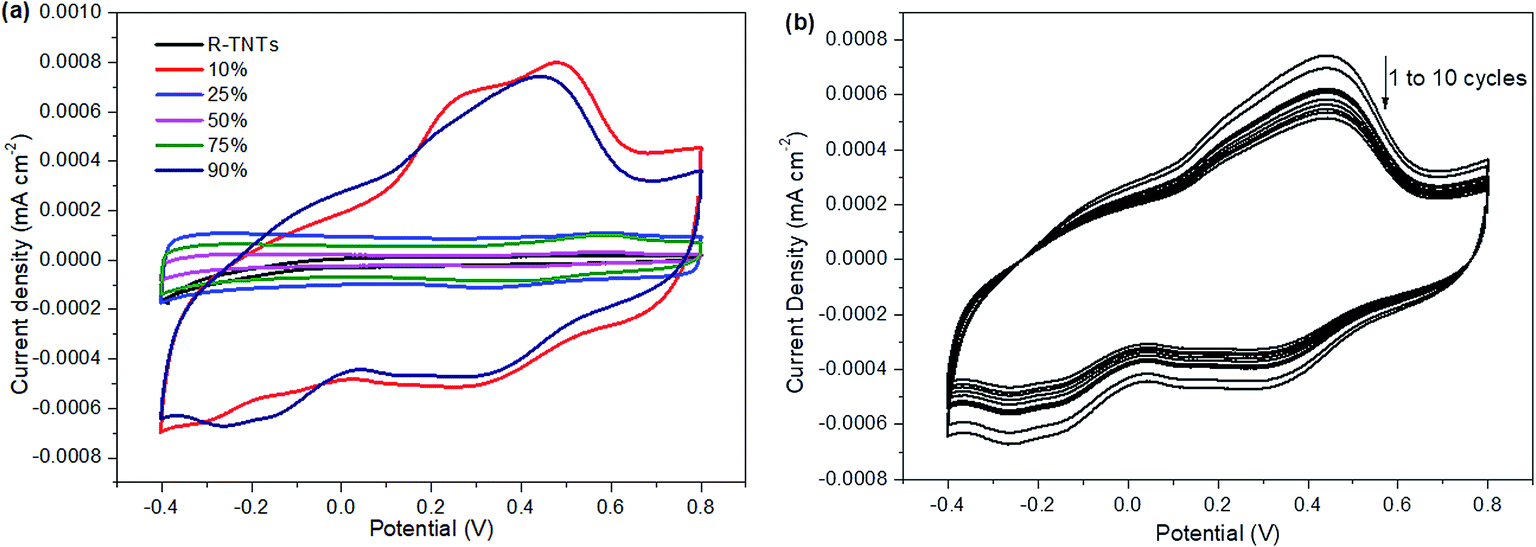
The electrochemical performance of the synthesized samples was measured in 1 M KCl aqueous electrolyte with the applied potential ranging from −0.4 to 0.8 V vs. Ag/AgCl. Fig. 5 displays the voltammograms of R-TNTs and R-TNTs/Mn2O3 deposited at various duty cycles at a scan rate of 5 mV s−1. The synthesized samples exhibited a capacitive-like-current-potential response by displaying rectangular CV profiles with the presence of redox peaks. The observed shape can be attributed to the combination of two different simultaneous charge storage mechanisms: (i) electric double-layer in R-TNTs and (ii) pseudocapacitance in Mn2O3. The capacitive current increases with the incorporation of Mn2O3 and this leads to higher specific capacitance of the synthesized samples.24 However, it was observed that the capacitive current generated decreases as the applied duty cycle increases to 25%, 50% and 75%, indicating that the high amount of Mn2O3 nanoparticle loading was not fully utilized in the charge storage. Moreover, as shown in Fig. 1b–d, the openings of the nanotubes are partially covered by the Mn2O3 nanoparticles which lead to lower surface area and blocking ion diffusion through the nanotubes. The specific capacitance values of all the synthesized samples were calculated and recorded at 19.85 mF cm−2, 4.86 mF cm−2, 1.15 mF cm−2, 3.43 mF cm−2 and 18.95 mF cm−2 for Mn2O3/R-TNTs synthesized at 10%, 25%, 50%, 75%, and 90% duty cycle, respectively. Although Mn2O3/R-TNTs synthesized at 90% duty cycle display outstanding capacitive performance, it was found that this sample exhibits low capacitive retention even after 10 CV cycles, as shown in Fig. 5b, due to the blocked nanotubes. The XRD results showed that the crystallite size of Mn2O3 synthesized at 90% duty cycle displays the largest size compared to other samples. This is caused by the deposition of a huge amount of Mn2O3, whereby the sample becomes a thick film and leads to insufficient diffusion of the active ion throughout the sample. Therefore, an applied high duty cycle was not recommended for this study.
 |
| | Fig. 5 Cyclic voltammograms of (a) R-TNTs and Mn2O3/R-TNTs deposited at different duty cycles at a scan rate of 5 mV s−1 and (b) Mn2O3/R-TNTs deposited at a 90% duty cycle at a scan rate of 5 mV s−1 for a longer cycling process. | |
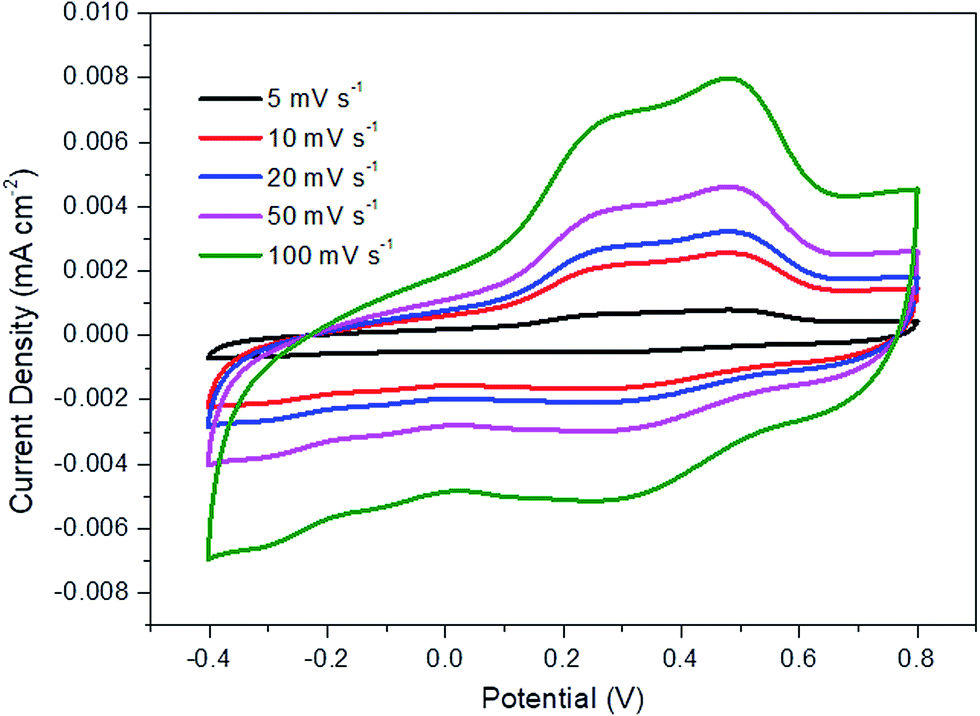
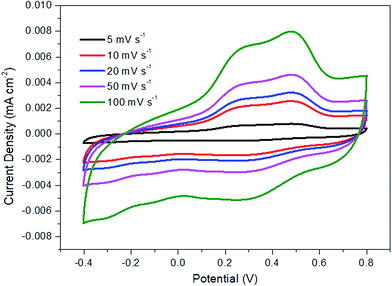
Fig. 6 displays the current density vs. potential profile as a function of scan rate for R-TNTs/Mn2O3 synthesized at a 10% duty cycle. The current response showed a slight compression as the scan rate decreased. The degree of compression could be correlated to the ionic diffusion on the electrode surface, suggesting that prolonged duration was required to charge the capacitor.47 This sample displays significant diffusion rate capability as it was able to maintain a consistent shape with increasing scan rate without any pronounced shape distortion. The specific capacitance value of this sample decreases as the scan rate increases (Table 3).
 |
| | Fig. 6 Cyclic voltammograms for Mn2O3/R-TNTs deposited at 10% duty cycle. | |
Table 3 Specific capacitance of Mn2O3/R-TNTs synthesized at 10% duty cycle as a function of scan rate
| Scan rate (mV s−1) |
Specific capacitance (mF cm−2) |
| 100 |
4.86 |
| 50 |
9.36 |
| 20 |
12.57 |
| 10 |
14.05 |
| 5 |
18.32 |
Galvanostatic charge–discharge was performed at a constant current density of 0.1 mA cm−2 with the potential window of −0.4 V to 0.8 V to study the electrochemical behaviour of the synthesized samples. The specific capacitance (SC) is calculated based on the charge–discharge curves using the following equation:
| |
 | (11) |
where
i is the discharge current in amperes, Δ
t is the discharge time in seconds, Δ
E is the difference in discharge voltage in volts and
A is the area of the active electrode (cm
2).
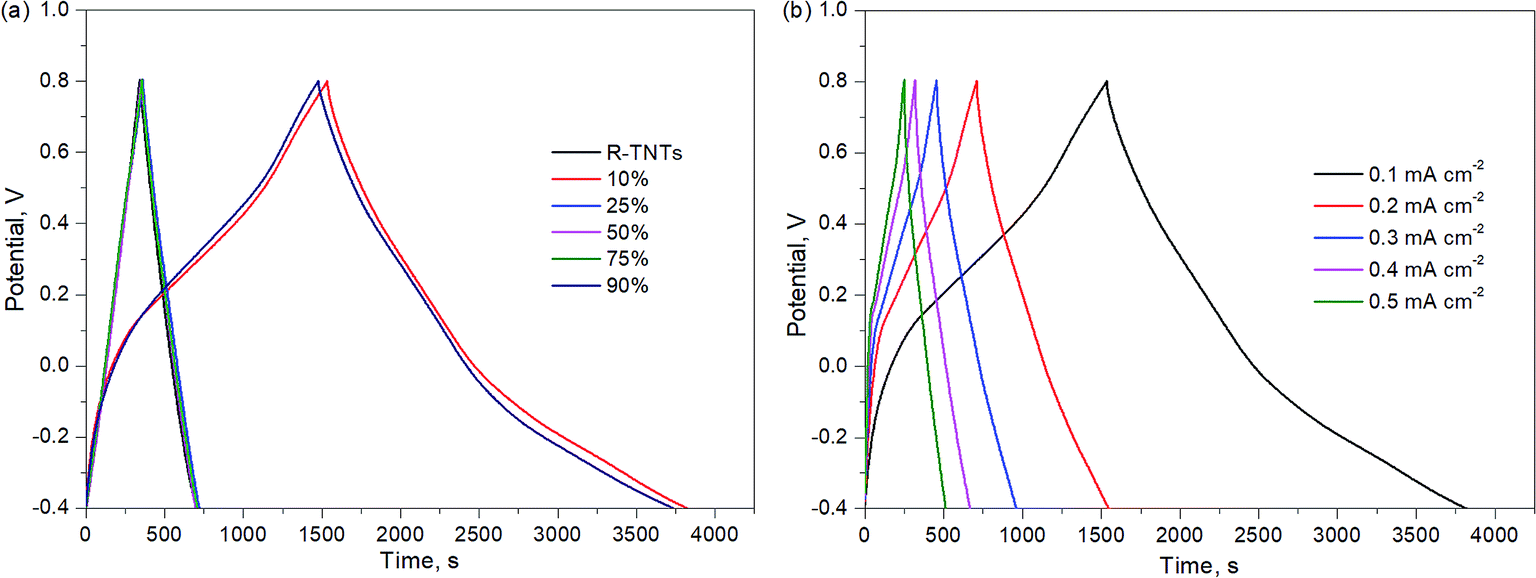
The charge–discharge profiles of all synthesized samples are displayed in Fig. 7a. The charge–discharge curves of R-TNTs and Mn2O3/R-TNTs synthesized at 25%, 50% and 75% duty cycles were almost identical and this represents the similar energy storage within these samples. On the other hand, different charge–discharge profiles could be observed in Mn2O3/R-TNTs synthesized at 10% and 90% duty cycles, whereby an unsymmetrical triangle can be observed as the charge and discharge curves displayed a slight bend with a longer discharge time that was attributed to the typical faradaic reaction of the oxides. The specific capacitance values obtained from the galvanostatic charge–discharge analysis are tabulated in Table 4. The results showed a drastic decrement in specific capacitance value as duty cycle increased. Although the specific capacitance of R-TNTs/Mn2O3 synthesized at a 90% duty cycle exhibited an insignificant difference compared to that of R-TNTs/Mn2O3 synthesized at a 10% duty cycle, it was notable to mention that Mn2O3/R-TNTs synthesized at a 90% duty cycle displayed instability for a longer cycling number. Therefore, R-TNTs/Mn2O3 synthesized at a 10% duty cycle were selected as the optimised sample.
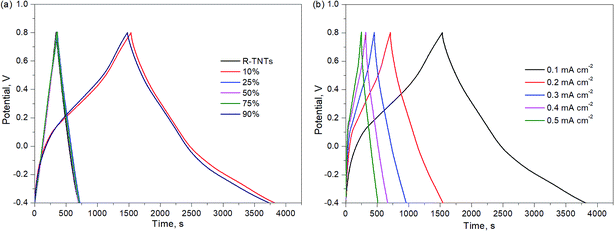 |
| | Fig. 7 Galvanostatic charge–discharge of (a) R-TNTs and Mn2O3/R-TNTs deposited using various duty cycles at the current density of 0.1 mA cm−2 and (b) Mn2O3/R-TNTs deposited at 10% duty cycle at different current densities. | |
Table 4 Specific capacitance of Mn2O3/R-TNTs synthesized at various duty cycles at the current density of 0.1 mA cm−2
| Samples |
Specific capacitance (mF cm−2) |
| R-TNTs |
3.05 |
| 10% |
18.32 |
| 25% |
2.97 |
| 50% |
2.88 |
| 75% |
2.93 |
| 90% |
18.79 |
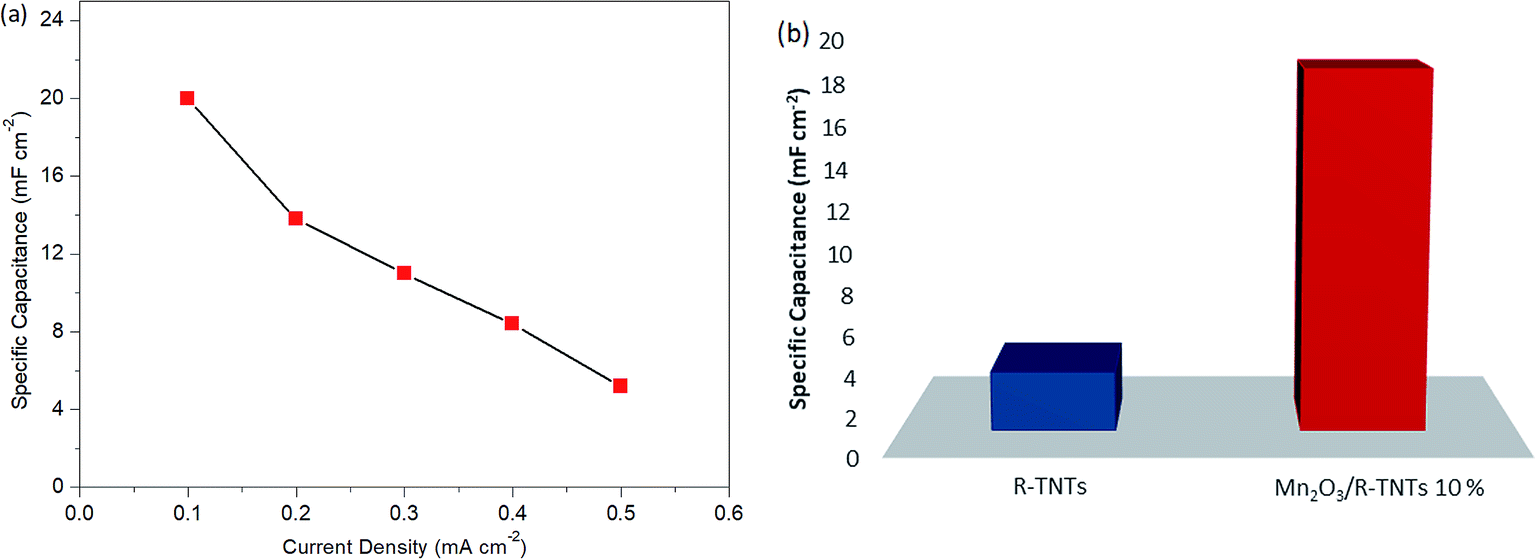
Fig. 7b shows the charge–discharge curves of R-TNTs/Mn2O3 deposited at a 10% duty cycle at various current densities from 0.1 mA cm−2 to 0.5 mA cm−2. Evidently, the obtained specific capacitance values decreased with increasing current density, as shown in Fig. 8a. This may be due to an insufficient response time for the electrolyte ions to reach the active surface of this particular sample at a high flow rate of current.48 R-TNTs/Mn2O3 deposited at a 10% duty cycle present the highest specific capacitance as the Mn2O3 nanoparticles were deposited homogeneously without covering the opening of the nanotubes, and this provides a clear pathway for electrochemical reactions to occur.
 |
| | Fig. 8 Specific capacitance of (a) Mn2O3/R-TNTs deposited at 10% duty cycle at various current densities and (b) R-TNTs and Mn2O3/R-TNTs synthesized at 10% duty cycle. | |
Fig. 8b displays the specific capacitance of bare R-TNTs and Mn2O3/R-TNTs synthesised at a 10% duty cycle. Remarkably, Mn2O3/R-TNTs synthesised at a 10% duty cycle exhibit an impressive specific capacitance of 18.32 mF cm−2, which was 6 times higher than the bare R-TNTs. This confirmed that the capacitive performance of the R-TNTs can be improved with the incorporation of a superior morphology of the Mn2O3 nanoparticles. The obtained specific capacitance value in this work was comparable to MnO2/self-doped TiO2 nanotubes (14.8 mF cm−2),49 the MnO2/Al–TiO2 composite (∼17 mF cm−2)50 and a MnOx/TiO2 nanotube composite (12.51 mF cm−2).51
Conclusions
Mn2O3/R-TNTs were synthesised via the reverse pulse electrodeposition technique and the influence of duty cycle on the morphological, structural and electrochemical performance was studied. It was proven that by adjusting the duty cycle of the electrodeposition process, a desired, tuneable morphology could be obtained. Electrodeposition at 10% duty cycle gave a homogeneous deposition whereby the Mn2O3 nanoparticles were well dispersed on the opening of the nanotubes. In addition, the shapes of the nanotubes were maintained upon Mn2O3 electrodeposition. These nanotubes exhibited high surface area characteristics and contributed to the excellent ionic diffusion process. The presence of the Mn2O3 nanoparticles significantly enhanced the specific capacitance of Mn2O3/R-TNTs. It was highlighted that Mn2O3/R-TNTs synthesized at a 10% duty cycle achieved a specific capacitance value of 18.32 mF cm−2 at the current density of 0.1 mA cm−2, which was 6 times higher than that of bare R-TNTs.
Conflicts of interest
The authors declare that there is no conflict of interest regarding the publication of this paper.
Acknowledgements
Financial support from Putra Grant, UPM/700-2/1/GPB/2017, is gratefully appreciated. The authors thank the Ministry of Higher Education of Malaysia for financial support of the MyBrain15 scholarship for Nurul Asma Samsudin. Special thanks are extended to the Microscopy Unit, Institute of Bioscience, Universiti Putra Malaysia and the School of Chemistry and Environment, Faculty of Applied Sciences, Universiti Teknologi MARA for the provision of laboratory facilities.
References
- R. M. John and S. Patrice, Science, 2008, 321, 651 CrossRef PubMed
 .
. - B. E. Conway, Electrochemical supercapacitor: Scientific fundamentals and technological applications, Kulwer Acadamic/Plenum Publisher, New York, 1999 Search PubMed .
- H. Chen, S. Zeng, M. Chen, Y. Zhang and Q. Li, RSC Adv., 2017, 7, 8561 RSC .
- F. Baizeng and B. Leo, Electrochim. Acta, 2007, 52, 6916 CrossRef .
- F. Baizeng, B. Arman, K. Min-Sik, K. Jung-Ho, W. P. David and Y. Jong-Sung, Microporous Mesoporous Mater., 2013, 182, 1 CrossRef .
- F. Baizeng, K. Jung-Ho, K. Min-Sik, B. Arman, L. Alfred, W. David and Y. Jong-Sung, J. Mater. Chem., 2012, 22, 19031 RSC .
- F. Baizeng and B. Leo, J. Phys. Chem. B, 2006, 15, 7877 Search PubMed .
- R. Yverick, T. Xiaowu and N. Linda, ACS Nano, 2015, 7, 7248 Search PubMed .
- V. Subramanian, H. Sean, S. H. Patricia and B. Rambabu, Solid State Ionics, 2004, 175, 511 CrossRef .
- U. M. Patil, S. B. Kulkarni, V. S. Jamadade and C. D. Lokhande, J. Alloys Compd., 2011, 209, 1677 CrossRef .
- Z. Xiaojun, S. Wenhui, Z. Jixin, Z. Weiyun, M. Jan, M. Subodh, M. Tuti Lim, Y. Yanhui, Z. Hua, H. Huey Hoon and Y. Qingyu, Nano Res., 2010, 9, 643 Search PubMed .
- L. Shude, L. Su Chan, P. Umakant, R. Chaiti, S. K. Vijaya, Z. Kan, K. Aniruddha, K. Shinill, P. Jong Hyeok and J. Seong Chan, J. Mater. Chem. A, 2017, 5, 4543 RSC .
- M. Sumanta Kumar and R. G. Ranga, J. Phys. Chem. C, 2011, 31, 15646 Search PubMed .
- S. A. Pawar, D. S. Patil and J. C. Shin, J. Ind. Eng. Chem., 2017, 54, 162 CrossRef .
- H. Ming, L. Fei, D. Dan, Z. Yu Xin and Z. Li Li, J. Mater. Chem. A, 2015, 3, 21380 RSC .
- X. Xiaoying, Z. Chen, W. Ming-Bo, T. Ying, L. Wei and Y. Quan-Hong, Chem. Commun., 2013, 49, 11092 RSC .
- W. Dezhi, X. Yuanyuan, L. Xiaonan, W. Zhuangzi, W. Yan-Jie and F. Baizeng, ACS Sustainable Chem. Eng., 2017, 3, 2509 Search PubMed .
- B. Venkataramana, G. Bhavana, C. Sharat, D. Arindam, D. Sandip and A. K. Tyagi, Electrochim. Acta, 2016, 203, 230 CrossRef .
- X. Yali, D. Weimin, D. Lulu, Z. Wenjuan, G. Wei, C. Jingjing, Z. Bing and D. Dehua, RSC Adv., 2017, 7, 22553 RSC .
- W. Zhuo, N. Caiyun, W. Dingsheng and L. Yadong, RSC Adv., 2014, 4, 47513 RSC .
- Z. Huanhuan, L. Jinyu, G. Cheng, Y. Mingming, Y. Bing, L. Ping and M. Yuguang, J. Power Sources, 2016, 332, 413 CrossRef .
- W. Kai, H. Jiyong and W. Zhixiang, J. Phys. Chem. C, 2010, 114, 8062 CrossRef .
- H. Yang, L. Hongfei, W. Zifeng, Z. Minshen, P. Zengxia, X. Qi, H. Yan and Z. Chunyi, Nano Energy, 2016, 22, 422 CrossRef .
- S. L. Chou, J. Z. Wang, S. Y. Chew, H. K. Liu and S. X. Dou, Electrochem. Commun., 2008, 10, 1724 CrossRef .
- Y. Xie, L. Zhou, C. Huang, H. Huang and J. Lu, Electrochim. Acta, 2008, 53, 3643 CrossRef .
- Y. R. Ahn, M. Y. Song, S. M. Jo, C. R. Park and D. Y. Kim, Nanotechnology, 2009, 17, 2865 CrossRef .
- P. Roy, S. Berger and P. Schmuki, Angew. Chem., Int. Ed., 2011, 50, 2904 CrossRef PubMed .
- M. Salari, S. H. Aboutalebi, K. Konstantinov and H. K. Liu, Phys. Chem. Chem. Phys., 2011, 13, 5038 RSC .
- Z. Endut, M. Hamdi and W. J. Basirun, Appl. Surf. Sci., 2013, 280, 962 CrossRef .
- M. Zhou, A. M. Glushenkov, O. Kartachova, Y. Li and Y. Chena, J. Electrochem. Soc., 2015, 162, A5065 CrossRef .
- M. Salari, K. Konstantinov and H. K. Liu, J. Mater. Chem., 2011, 21, 5128 RSC .
- H. Wu, D. Li, X. Zhu, C. Yang, D. Liu, X. Chen, Y. Song and L. Lu, Electrochim. Acta, 2014, 116, 129 CrossRef .
- H. Zhou and Y. Zhang, J. Power Sources, 2013, 239, 128 CrossRef .
- M. Salari, S. H. Aboutalebi, A. T. Chidembo, I. P. Nevirkovets, K. Konstantinov and H. K. Liu, Phys. Chem. Chem. Phys., 2012, 14, 4770 RSC .
- X. Lu, G. Wang, T. Zahi, M. Yu, J. Gan, Y. Tong and Y. Li, Nano Lett., 2013, 12, 1690 CrossRef PubMed .
- N. A. Samsudin, Z. Zainal, H. N. Lim, Y. Sulaiman, S. K. Chang, Y. C. Lim and W. N. Mohd Amin, Enhancement of capacitive performance in titania nanotubes modified by an electrochemical reduction method, J. Nanomater., 2018, 2018, 9 Search PubMed .
- H. Xu, D. Shao, Q. Zhang, H. Yang and Y. Wei, RSC Adv., 2014, 4, 25011 RSC .
- Z. Zeng, P. Su, J. Zhu and X. Zhu, RSC Adv., 2015, 5, 17550 RSC .
- M. Paunovic and M. Schlesinger, Fundamental of electrodeposition, John Wiley and Sons, New Jersey, 2nd edn, 2005 Search PubMed .
- A. D. Jagadale, V. S. Kumbhar and C. D. Lokhande, J. Colloid Interface Sci., 2013, 406, 225 CrossRef PubMed .
- Z. Endut, M. Hamdi and W. J. Basirun, Thin Solid Films, 2013, 549, 306 CrossRef .
- Y. Xie, L. Zhou, C. Huang, H. Huang and J. Lu, Electrochim. Acta, 2008, 53, 3643 CrossRef .
- A. J. Bard and L. R. Faulkner, Electrochemical methods: Fundamentals and applications, John Wiley and Sons 2, United State of America, 2nd edn, 2001 Search PubMed .
- G. H. A. Therese and P. V. Kamath, Chem. Mater., 2000, 5, 1195 CrossRef .
- S. H. Lee, H. Lee, M. S. Cho, J. D. Nam and Y. K. Lee, J. Mater. Chem. A, 2013, 1, 14606 RSC .
- W. Tang, Y. Hu and S. Huang, Met. Mater. Int., 2012, 18, 177 CrossRef .
- J. H. Jang, S. Han, T. Hyeon and S. M. Oh, J. Power Sources, 2003, 123, 79 CrossRef .
- L. L. Zhang, S. Zhao, X. N. Tian and X. S. Zhao, Langmuir, 2010, 26, 17624 CrossRef PubMed .
- H. Zhou and Y. Zhang, J. Power Sources, 2013, 239, 128 CrossRef .
- W. J. Zhong, S. B. Sang, Y. Y. Liu, Q. M. Wu, K. Y. Liu and H. T. Liu, J. Power Sources, 2015, 294, 216 CrossRef .
- Z. X. Pei, M. S. Zhu, Y. Huang, Y. Huang, Q. Xue, H. Y. Geng and C. Y. Zhi, Nano Energy, 2016, 20, 254 CrossRef .
|
| This journal is © The Royal Society of Chemistry 2018 |
Click here to see how this site uses Cookies. View our privacy policy here. 
 Open Access Article
 This Open Access Article is licensed under a Creative Commons Attribution-Non Commercial 3.0 Unported Licence
 a,
Zulkarnain Zainal
a,
Zulkarnain Zainal