 Open Access Article
Characterization of NaxLi0.67+yNi0.33Mn0.67O2 as a positive electrode material for lithium-ion batteries†
K. Chibaab,
M. Shikano *a and
H. Sakaebe
 a
a
aResearch Institute of Electrochemical Energy, National Institute of Advanced Industrial Science and Technology (AIST), Ikeda, Osaka 563-8577, Japan. E-mail: shikano.masahiro@aist.go.jp; Fax: +81-72-751-9609; Tel: +81-72-751-8460
bOffice of Society-Academia Collaboration for Innovation, Kyoto University, Uji, Kyoto 611-0011, Japan
First published on 24th July 2018
Abstract
The relationship between the charge–discharge properties and crystal structure of NaxLi0.67+yNi0.33Mn0.67O2 (0.010 ≤ x ≤ 0.013, 0.16 ≤ y ≤ 0.20) has been investigated. Li/NaxLi0.67+yNi0.33Mn0.67O2 cells exhibit gradually sloping initial charge and discharge voltage–capacity curves. The initial charge capacity increased from 171 mA h g−1 for thermally-treated Na0.15Li0.51Ni0.33Mn0.67O2 to 226 mA h g−1 for Na0.010Li0.83Ni0.33Mn0.67O2 with an increase in the Li content. The initial maximum discharge capacity was 252 mA h g−1 in the case of Na0.010Li0.83Ni0.33Mn0.67O2 between 4.8 and 2.0 V at a fixed current density of 15 mA g−1 (0.06C) at 25 °C. The predominance of the spinel phase leads to the high initial discharge capacity of Na0.010Li0.83Ni0.33Mn0.67O2. This study shows that chemical lithiation using LiI is effective to improve the electrochemical properties.
Introduction
Lithium nickel manganese oxides have attracted a great deal of interest as a positive electrode material for lithium-ion batteries owing to their high capacity and high voltage. In particular, lithium-deficient Li0.67Ni0.33Mn0.67O2 with an O3-type layered structure has been extensively investigated as a promising material for a positive electrode.1–4 The O3-Li0.67Ni0.33Mn0.67O2 is known to be a metastable phase and can readily be synthesized by the Na/Li ion-exchange reaction of a Na-based layered compound, P3-Na0.67Ni0.33Mn0.67O2. It may be noted that the layered structures are named according to the packing designation commonly used for layered oxides.5 For example, the letters P and O describe the alkali ion environment (prismatic and octahedral, respectively), whereas the numbers 1, 2, and 3 indicate the number of slabs required to describe the unit cell.5 The discharge capacity of the O3-Li0.67Ni0.33Mn0.67O2 has been reported to be about 200 mA h g−1 between 4.8 and 2.0 V.4 In addition, it exhibits poor cycle performance as it undergoes a phase transformation to the spinel structure upon electrochemical cycling as is commonly known in the O3-type structure. Since the oxygen array in the O3-type structure is very similar to that of the spinel structure, a direct phase transformation is often observed.1Recently, we reported that thermal treatment after the ion-exchange reaction by a molten salt method improved the cycle performance of O3-Li0.67Ni0.33Mn0.67O2.4 The charge and discharge voltage–capacity curves of the thermally treated O3-Li0.67Ni0.33Mn0.67O2 exhibited a plateau around about 4.8 V and a high discharge capacity of 257 mA h g−1 between 4.8 and 2.0 V. The thermal treatment for O3-Li0.67Ni0.33Mn0.67O2 is extremely interesting as it affords better cycle performance, a higher discharge voltage, and higher specific capacity compared to the values for as-prepared O3-Li0.67Ni0.33Mn0.67O2.4 However, the discharge voltage-capacity curve showed a steep slope between 4.7 and 3.0 V, owing to the increased spinel phase content as a result of the thermal treatment.
We previously investigated sample preparation by a reflux method followed by thermal treatment and have successfully improved the discharge capacity. The initial discharge capacity increased from 257 mA h g−1 for the molten salt method to 265 mA h g−1 for the reflux method.6 In addition, the discharge voltage–capacity curve showed a gradual slope between 4.7 and 3.0 V and a plateau around about 4.8 V, owing to the decreased spinel phase content as a result of higher residual Na content. However, the high discharge performance could not be utilized in the present battery system by using graphite as the negative electrode material, because the initial charge capacity was only about 180 mA h g−1 in the thermally treated Na0.093Li0.57Ni0.33Mn0.67O2 by using Li metal. From this viewpoint, further lithiation should be performed during the synthesis of thermally treated samples.
In this paper, we have studied NaxLi0.67+yNi0.33Mn0.67O2 (0.010 ≤ x ≤ 0.013, 0.16 ≤ y ≤ 0.20) synthesized by chemical lithiation using LiI.7,8 To the best of our knowledge, this is the first attempt to clarify the relationship between the charge–discharge properties and crystal structure of NaxLi0.67+yNi0.33Mn0.67O2.
Experimental
Synthesis
The precursor P3-Na0.67Ni0.33Mn0.67O2 was synthesized by the conventional solid state reaction of a stoichiometric mixture of CH3COONa (98.5% pure), Ni(OH)2 (99.9% pure), and Mn2O3 (99.9% pure) with 3% excess sodium.1–4 Firstly, the weighed powder was mixed using the ball milling method and then pressed into pellets. Secondly, the pellets were heated at 650 °C for 10 h under O2 flow to obtain a pure P3 phase, following which the pellets were pulverized. For conducting the Na/Li ion-exchange reaction, the host material P3-Na0.67Ni0.33Mn0.67O2 was refluxed with 0.4, 0.8, and 1.6-fold excesses of lithium supplied in the form of a solution of LiBr (99.9% pure) in methanol (MeOH) at 110 °C for 5 h.6 The sample was filtered, washed by MeOH, and then dried at 90 °C overnight. To induce a change in the crystal structure, the sample was heated at 500 °C for 5 h in air.4,6 Hereafter, the thermally treated NazLi0.67−zNi0.33Mn0.67O2 will be referred to as HT-NazLi0.67−zNi0.33Mn0.67O2. The thermally treated sample was refluxed with a 2.0-fold excess of lithium supplied in the form of a LiI solution (99.9% pure) in acetonitrile (CH3CN) at 140 °C for 5 h.7,8 After LiI chemical lithiation, the sample was filtered, washed by CH3CN and MeOH, and then dried at 90 °C overnight.Characterization
The samples were characterized by powder X-ray diffraction (XRD) using a D8 ADVANCE diffractometer (Bruker) with a Cu Kα radiation source (operating conditions: 40 kV and 55 mA). XRD intensity data were collected for 0.25 s at 2θ intervals of 0.02° over a range of 10 to 70°. TOPAS ver. 4.2 software package was used for Pawley analysis.9 Cationic chemical composition of Li, Na, Ni and Mn was determined from inductively coupled plasma-atomic emission spectroscopy (ICP-AES; Shimadzu ICPS-8000). The solid-state 6Li magic-angle spinning nuclear magnetic resonance (6Li MAS-NMR) spectra were recorded at room temperature using an AVANCE300 spectrometer (Bruker) at 44 MHz with a spinning rate of 50 kHz for 6Li nuclei by a rotor-synchronized spin-echo pulse sequence. The pulse width was 3.6 μs (π/2 pulse) and the chemical shift was recorded relative to a 1.0 mol dm−3 6LiCl aqueous solution. 6Li spectral decomposition was performed using the DMFit software, which allows for the variation of peak position, peak height, line width, and the ratio of Gaussian to Lorentzian functions.10 Further, scanning electron microscopy (SEM, Keyence VE-8800) was used to characterize the morphology and crystal sizes of the samples obtained before and after chemical lithiation.Electrochemical properties
Electrochemical cycling test was performed using a lithium coin-type cell (CR2032). The working electrode was prepared using a mixture of 10 mg of active material, 10 mg of acetylene black as the conductive agent and 2 mg of polytetrafluoroethylene as the binder. The mixture was cast on the Al mesh, the current collector, and pressed, and then the circular working electrode with a diameter of 14 mm was obtained. A Li foil, cut in a circle with a diameter of 16 mm and thickness of 0.2 mm was used as the counter electrode, while a microporous polypropylene sheet was used as the separator. A 1 mol dm−3 LiPF6 solution in a 1![[thin space (1/6-em)]](https://www.rsc.org/images/entities/char_2009.gif) :
:![[thin space (1/6-em)]](https://www.rsc.org/images/entities/char_2009.gif) 2 (v/v) mixture of ethylene carbonate and diethyl carbonate was used as the electrolyte. Cells were fabricated in a dry room with a dew point below −50 °C and tested at 25 °C. Charge capacity was measured in the constant current and constant voltage (CCCV) mode up to 4.8 V with a current density of 15 mA g−1 (19 mA cm−2) and then using a potentiostatic step for 15 min, while the discharge capacity was measured in the constant current (CC) mode with a current density of 15 mA g−1 to 2.0 V.
2 (v/v) mixture of ethylene carbonate and diethyl carbonate was used as the electrolyte. Cells were fabricated in a dry room with a dew point below −50 °C and tested at 25 °C. Charge capacity was measured in the constant current and constant voltage (CCCV) mode up to 4.8 V with a current density of 15 mA g−1 (19 mA cm−2) and then using a potentiostatic step for 15 min, while the discharge capacity was measured in the constant current (CC) mode with a current density of 15 mA g−1 to 2.0 V.
Results and discussion
P3-Na0.67Ni0.33Mn0.67O2 was used as the precursor for the ion-exchange reaction. Table 1 shows the cationic chemical compositions of all the samples. The residual Na content was successfully adjusted by the LiBr concentration. The Li content in all the samples was increased by chemical lithiation, while the residual Na content was close to 0. Fig. 1a shows the XRD patterns of P3-Na0.67Ni0.33Mn0.67O2 and thermally treated samples. All the patterns exhibited some very weak peaks corresponding to rock-salt-type NiO, which is a trace impurity. P3-Na0.67Ni0.33Mn0.67O2 can be obtained as a nearly single phase with the space group of R3m.2 All the patterns showed phase separation of the layered and spinel-type structures. With decreasing residual Na content x, the four-phase coexistence of the P3, OP2, O3, and spinel phases in HT-Na0.27Li0.39Ni0.33Mn0.67O2 was transformed to the three-phase state consisting of OP2, O3 and spinel phases in HT-Na0.19Li0.47Ni0.33Mn0.67O2 and Na0.15Li0.51Ni0.33Mn0.67O2.4,6,11 Hereafter, we denote NaxLi0.67+yNi0.33Mn0.67O2 by a residual Na content before chemical lithiation, 0.15, 0.19, and 0.27, as Sample015, Sample019 and Sample027, respectively. The powder XRD patterns of them (Fig. 1b) were fully indexed with the space group R![[3 with combining macron]](https://www.rsc.org/images/entities/char_0033_0304.gif) m. Before chemical lithiation, a clear separation of the diffraction peaks between 15 and 20° was observed (Fig. 1a), while a single broad diffraction peak was observed after chemical lithiation (Fig. 1b). P3 and OP2 phases disappeared upon chemical lithium insertion. The broad XRD patterns observed for Sample015, Sample019 and Sample027 may be considered to originate from a mixture of the layered and spinel-type structures. By using the layered structure model (space group: R
m. Before chemical lithiation, a clear separation of the diffraction peaks between 15 and 20° was observed (Fig. 1a), while a single broad diffraction peak was observed after chemical lithiation (Fig. 1b). P3 and OP2 phases disappeared upon chemical lithium insertion. The broad XRD patterns observed for Sample015, Sample019 and Sample027 may be considered to originate from a mixture of the layered and spinel-type structures. By using the layered structure model (space group: R![[3 with combining macron]](https://www.rsc.org/images/entities/char_0033_0304.gif) m), the lattice parameters of Sample015, Sample019 and Sample027 were calculated with TOPAS ver. 4.2 and the results are presented in Table 2. The lattice parameter a, which reflects the nearest-neighbor O–O distance,12 decreased slightly with increasing the residual Na content. On the other hand, the lattice parameter c increased significantly from 14.313 to 14.403 Å. This can be explained by the expansion of the interlayer space, which was occupied by the alkali ions,1–4 because the ionic radius of Na+ (1.02 Å) is larger than that of Li+ (0.76 Å).13 In addition, the c/a ratio approached 4.90 with decreasing the residual Na content, which is the theoretical value for a spinel structure.14,15 In other words, the cubic-close-packed oxygen array of the rhombohedral structure approached cubic symmetry.16 The stacking of oxide ions in both the layered rock-salt and spinel-type structures is identical, and the only difference between the structures is the site occupied by the transition metal (TM).17 However, considering that the residual Na content in the chemical lithiation samples is subtle, significant changes in the coordination environment around Na atom could not be expected. The coordination environment around Li atoms is more important, because it induces significant differences among the chemical lithiation samples.
m), the lattice parameters of Sample015, Sample019 and Sample027 were calculated with TOPAS ver. 4.2 and the results are presented in Table 2. The lattice parameter a, which reflects the nearest-neighbor O–O distance,12 decreased slightly with increasing the residual Na content. On the other hand, the lattice parameter c increased significantly from 14.313 to 14.403 Å. This can be explained by the expansion of the interlayer space, which was occupied by the alkali ions,1–4 because the ionic radius of Na+ (1.02 Å) is larger than that of Li+ (0.76 Å).13 In addition, the c/a ratio approached 4.90 with decreasing the residual Na content, which is the theoretical value for a spinel structure.14,15 In other words, the cubic-close-packed oxygen array of the rhombohedral structure approached cubic symmetry.16 The stacking of oxide ions in both the layered rock-salt and spinel-type structures is identical, and the only difference between the structures is the site occupied by the transition metal (TM).17 However, considering that the residual Na content in the chemical lithiation samples is subtle, significant changes in the coordination environment around Na atom could not be expected. The coordination environment around Li atoms is more important, because it induces significant differences among the chemical lithiation samples.
| Concentration | Na | Li | Ni | Mn |
|---|---|---|---|---|
| LiBr 0.4-fold molar | 0.27 | 0.39 | 0.33 | 0.67 |
| Chemical lithium insertion | 0.013 | 0.86 | 0.33 | 0.67 |
| LiBr 0.8-fold molar | 0.19 | 0.47 | 0.33 | 0.67 |
| Chemical lithium insertion | 0.012 | 0.87 | 0.33 | 0.67 |
| LiBr 1.6-fold molar | 0.15 | 0.51 | 0.33 | 0.67 |
| Chemical lithium insertion | 0.010 | 0.83 | 0.33 | 0.67 |
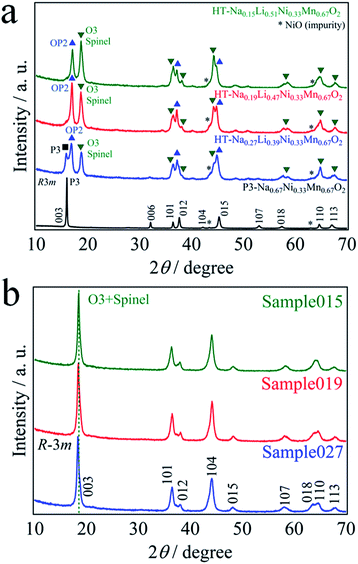 | ||
| Fig. 1 XRD patterns of (a) the as-prepared P3-Na0.67Ni0.33Mn0.67O2 and before chemical lithiation, and (b) after chemical lithiation. | ||
![[3 with combining macron]](https://www.rsc.org/images/entities/char_0033_0304.gif) m)
m)
| Sample | a/Å | c/Å | c/a |
|---|---|---|---|
| Sample027 (Na0.013Li0.86Ni0.33Mn0.67O2) | 2.8819(1) | 14.403(1) | 5.00 |
| Sample019 (Na0.012Li0.87Ni0.33Mn0.67O2) | 2.8821(1) | 14.362(1) | 4.98 |
| Sample015 (Na0.010Li0.83Ni0.33Mn0.67O2) | 2.8898(1) | 14.313(1) | 4.95 |
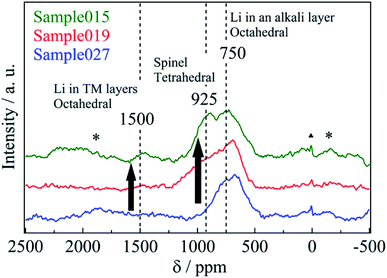
Fig. 2 shows the 6Li MAS-NMR spectra of Sample015, Sample019 and Sample027. Three resonances were observed at 1500, 925, and 750 ppm, indicating that Li occupied three crystallographically different sites in the structure (an additional resonance at 0 ppm is attributed to traces of Li salt).18 The small, broad resonance at 1500 ppm was assigned to Li+ in a honeycomb-like arrangement surrounded by the 6 manganese ions within the TM layer, as observed in Li[Li1/3Mn2/3]O2 (Li2MnO3).19,20 The resonance at 750 ppm was attributed to the layered structure O3-Li0.67Ni0.33Mn0.67O2, which is assigned to LiO6 in octahedral coordination.21 The resonance at 925 ppm was attributed to the spinel structure LiNi0.5Mn1.5O4, which is assigned to LiO4 in tetrahedral coordination.22 A distinct difference in the variation of 1500 and 925 ppm resonances at various c/a ratios was observed (Table 2). Table S1† shows the spinel phase content for Sample015, Sample019 and Sample027. The spinel phase content for the peak at 925 ppm increased from 7.1% (Sample027) to 31% (Sample015) with decreasing the residual Na content. The chemical lithiation samples have almost the same chemical composition although the 6Li MAS-NMR spectra and the c/a ratio of the lattice parameter vary (Table 2). To illustrate this clearly, the difference of the 6Li MAS-NMR spectra of the samples before chemical lithiation is compared. Fig. 3 shows the 6Li MAS-NMR spectra of HT-NazLi0.67−zNi0.33Mn0.67O2. HT-Na0.27Li0.39Ni0.33Mn0.67O2 spectrum is plotted together with HT-Na0.034Li0.63Ni0.33Mn0.67O2 spectrum reported previously for comparison.4 Four observed resonances indicated that the Li occupied four crystallographically different sites in HT-Na0.27Li0.39Ni0.33Mn0.67O2. The resonance at the 925 ppm which showed Li occupied the tetrahedral site in the spinel phase component increased with decreasing the value of the Na content. In other words, a fraction of the spinel phase component for the samples has been dominated by the residual Na content after the Na/Li ion-exchange reaction of the Na-based layered compound, P3-Na0.67Ni0.33Mn0.67O2. The resonance at 550 ppm is attributed to OP2-type layered structure, which is presumably assigned to LiO6 in octahedral coordination. To illustrate 550 ppm peak, XRD patterns and 6Li MAS-NMR spectrum of Na0.27Li0.39Ni0.33Mn0.67O2 before heat treatment are compared. Fig. S1 and S2† show the XRD patterns and 6Li MAS-NMR spectrum, respectively. As shown in Fig. S1,† Na0.27Li0.39Ni0.33Mn0.67O2 was identified to be a nearly single phase of OP2-type layered structure with space group P3m1.11 The strong peak at 550 ppm was observed (Fig. S2†). However, the resonance at 750 ppm was not observed, which is attributed to O3-type layered structure with LiO6 in octahedral coordination.21
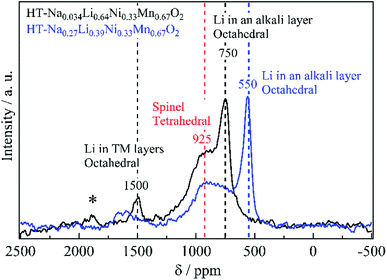 | ||
| Fig. 3 6Li-MAS-NMR spectra of HT-NazLi0.67-zNi0.33Mn0.67O2 (before chemical lithiation) measured at room temperature. “*” indicates a spinning sideband. | ||
The high resolution SEM micrographs (Fig. S3†) indicate that the powders obtained consisted of submicron particles and showed no change in morphology after chemical lithiation.
Fig. 4a shows the initial charge and discharge voltage–capacity curves of Sample015, Sample019 and Sample027 starting from charging in the voltage range between 2.0 and 4.8 V at a current density of 15 mA g−1 (0.06C), at 25 °C. The initial discharge voltage–capacity curves exhibited two plateaus. The plateaus at around 4.7 and 2.8 V were attributed to the Ni2+/4+ and Mn3+/4+ redox reactions in the spinel phase, respectively.23 In addition, the initial discharge voltage–capacity curve exhibited a gradual slope between 4.7 and 2.8 V, which is attributed to the layered rock-salt structure.4,6 Fig. 4b shows the initial differential (dis)charge voltage curves for Sample015, Sample019 and Sample027. The peaks highlighted in red circles at around 4.7 and 2.8 V assigned to the redox reaction of the spinel phase component as mentioned above were observed and intensity of the peaks increased with increasing the value of the resonance at 925 ppm (Fig. 2).23
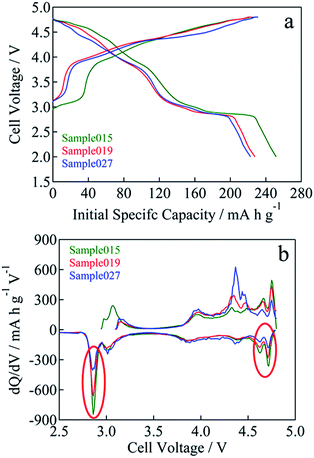 | ||
| Fig. 4 (a) Initial charge and discharge voltage curves for Sample015, Sample019 and Sample027. (b) Initial differential (dis)charge voltage plots for Sample015, Sample019 and Sample027. | ||
In case of Li-rich layered structure, the cation rearrangement in the initial charge delivered high discharge capacity.24 The characteristic voltage plateau at 4.5 V in the initial charge was observed.25 In case of Li-deficient layered structure, the heat treatment at 500 °C caused the cation rearrangement including (i) the migration of transition metals to the lithium layer and (ii) the amount of oxide ions removed from the crystal lattice: the layered structure transformed to the spinel structure.6 Therefore, the initial charge curve of Sample015, Sample019 and Sample027 did not exhibit the 4.5 V plateau.
In the case of Sample015, the initial charge capacity increased from 171 mA h g−1 for before chemical lithiation to 226 mA h g−1 for after chemical lithiation with increasing the Li content (Fig. 5a). The initial maximum discharge capacity and energy density were 252 mA h g−1 and 893 W h kg−1, respectively. Fig. 5b and S4† show the cycle performances of Sample015, Sample019 and Sample027. The discharge capacity retention of Sample015, Sample019 and Sample027 increased from 83 to 87% at the 10th cycle with decreasing the residual Na content (Fig. 5b). Similarly, the average discharge voltage at the 10th cycle almost linearly increased with decreasing the residual Na content (Fig. S4†). One can say that the high carbon content in the composite electrode seems to affect the capacity obtained. Therefore, the electrochemical performance was tested by a conventional composition with the lower carbon content. The composite electrode comprised the active material (95 wt%) with Super-P carbon (2.5 wt%) and PVdF (2.5 wt%). A 27.0 mg cm−2 of coating area density was used. As shown in Fig. 6a and b, Sample015 can sustain a high capacity and good capacity retention. In NaxLi0.67+yNi0.33Mn0.67O2 (0.010 ≤ x ≤ 0.013, 0.16 ≤ y ≤ 0.20), the c/a ratio should reflect the spinel phase content, which would affect the charge and discharge voltage–capacity curves and cycle performance.
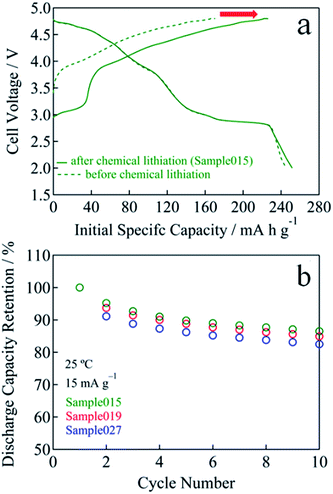 | ||
| Fig. 5 (a) Initial charge and discharge voltage curves for before and after chemical lithiation sample (Sample015). (b) Cycle performance of Sample015, Sample019 and Sample027. | ||
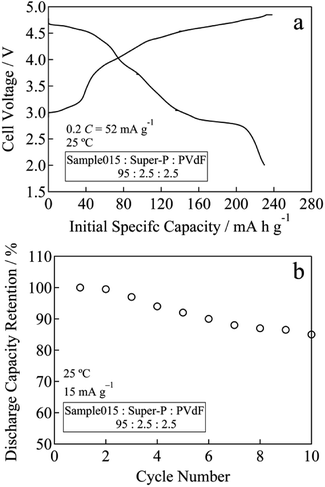 | ||
| Fig. 6 (a) Initial specific capacity and (b) cycle performance for Sample015 at a rate of 52 mA g−1 (0.2C) between 2.0 and 4.8 V at 25 °C. | ||
Conclusions
In summary, we have synthesized NaxLi0.67+yNi0.33Mn0.67O2 (0.010 ≤ x ≤ 0.013, 0.16 ≤ y ≤ 0.20) positive electrode materials by chemical lithiation using LiI. Cells containing these materials exhibited a gradually sloping curve. The initial maximum discharge capacity was 252 mA h g−1 in the case of Sample015 (Na0.010Li0.83Ni0.33Mn0.67O2). This study clearly demonstrates the feasibility of obtaining suitable voltage–capacity characteristics by judiciously controlling the residual Na content x in NaxLi0.67+yNi0.33Mn0.67O2 (0.010 ≤ x ≤ 0.013, 0.16 ≤ y ≤ 0.20) and related compositions. We show the relationship between the charge–discharge properties and crystal structure of NaxLi0.67+yNi0.33Mn0.67O2 by chemical lithiation using LiI. Although the chemical lithiation process in this study is a little cumbersome, the good electrochemical performance demonstrated by the obtained material is an advantage for the practical utilization. We are currently continuing our attempts to improve the electrochemical performance and synthesis procedure of these materials.Conflicts of interest
The authors declare that there is no conflicts of interest.Acknowledgements
This work was supported by the “Research and Development Initiative for Scientific Innovation of New Generation Batteries (RISING project)” of the New Energy and Industrial Technology Development Organization (NEDO), Japan.Notes and references
- J. M. Paulsen and J. R. Dahn, J. Electrochem. Soc., 2000, 147, 2478–2485 CrossRef.
- Z. Lu, R. A. Donaberger and J. R. Dahn, Chem. Mater., 2000, 12, 3583–3590 CrossRef.
- W. Zhao, S. Harada, Y. Furuya, S. Yamamoto and H. Noguchi, J. Power Sources, 2014, 261, 324–331 CrossRef.
- K. Chiba, M. Shikano and H. Sakaebe, J. Power Sources, 2016, 304, 60–63 CrossRef.
- C. Delmas, C. Fouassier and P. Hagenmuller, Physica B+C, 1980, 99, 81–85 CrossRef.
- K. Chiba, N. Taguchi, M. Shikano and H. Sakaebe, J. Power Sources, 2016, 311, 103–110 CrossRef.
- N. Ishida, H. Hayakawa, H. Shibuya, J. Imaizumi and J. Akimoto, J. Electrochem. Soc., 2013, 160, A297–A2013 CrossRef.
- N. Ishida, H. Hayakawa, J. Akimoto, H. Shibuya and J. Imaizumi, J. Power Sources, 2013, 244, 505–509 CrossRef.
- TOPAS V4: General Profile and Structure Analysis Software for Powder Diffraction Data, Bruker AXS, Karlsruhe, Germany, 2008 Search PubMed.
- D. Massiot, F. Fayon, M. Capron, I. King, S. L. Calvé, B. Alonso, J. O. Durand, B. Bujoli, Z. Gan and G. Hoatson, Magn. Reson. Chem., 2002, 40, 70 CrossRef.
- N. Yabuuchi, M. Kajiyama, J. Iwatate, H. Nishikawa, S. Hitomi, R. Okuyama, R. Usui, Y. Yamada and S. Komaba, Nat. Mater., 2012, 11, 512–517 CrossRef PubMed.
- J. Cabana, S. H. Kang, C. S. Johnson, M. M. Thackeray and C. P. Grey, J. Electrochem. Soc., 2009, 156, 730–736 CrossRef.
- R. D. Shannon, Acta Crystallogr., Sect. A: Cryst. Phys., Diffr., Theor. Gen. Crystallogr., 1976, 32, 751–766 CrossRef.
- E. Rossen, J. N. Reimers and J. R. Dahn, Solid State Ionics, 1993, 62, 53–60 CrossRef.
- R. J. Gummow, D. C. Liles and M. M. Thackeray, Mater. Res. Bull., 1993, 28, 235–246 CrossRef.
- N. Yabuuchi, Y. T. Kim, H. H. Li and Y. S. Horn, Chem. Mater., 2008, 20, 4936–4951 CrossRef.
- H. B. Yahia, M. Shikano and H. Kobayashi, Chem. Mater., 2013, 25, 3687–3701 CrossRef.
- N. Treuil, C. Labrugére, M. Menetrier, J. Portier, G. Campet, A. Deshayes, J. C. Frison, S. J. Hwang, S. W. Song and J. H. Choy, J. Phys. Chem. B, 1999, 103, 2100–2106 CrossRef.
- P. Mustarelli, V. Massarotti, M. Bini and D. Capsoni, Phys. Rev. B: Condens. Matter Mater. Phys., 1997, 55, 12018–12024 CrossRef.
- J. Bréger, M. Jiang, N. Dupré, Y. S. Meng, Y. S. Horn, G. Ceder and C. P. Grey, J. Solid State Chem., 2005, 178, 2575–2585 CrossRef.
- J. Cabana, N. A. Chernova, J. Xiao, M. Roppolo, K. A. Aldi, M. S. Whittingham and C. P. Grey, Inorg. Chem., 2013, 52, 8540–8550 CrossRef PubMed.
- Y. J. Lee, C. Eng and C. P. Grey, J. Electrochem. Soc., 2001, 148, A249–A257 CrossRef.
- S. H. Park, S.-W. Oh, S. H. Kang, I. Belharouak, K. Amine and Y.-K. Sun, Electrochim. Acta, 2007, 52, 7226–7230 CrossRef.
- N. Yabuuchi, K. Yoshii, S. T. Myung, I. Nakai and S. Komaba, J. Am. Chem. Soc., 2011, 133, 4404–4419 CrossRef PubMed.
- W. Zhao, S. Harada, Y. Furuya, S. Yamamoto and H. Noguchi, J. Power Sources, 2014, 261, 324–331 CrossRef.
Footnote |
| † Electronic supplementary information (ESI) available: Spinel content, XRD, SEM, 6Li-MAS-NMR and the electrochemical properties results. See DOI: 10.1039/c8ra03889a |
| This journal is © The Royal Society of Chemistry 2018 |

