DOI:
10.1039/C8RA03888K
(Paper)
RSC Adv., 2018,
8, 24485-24499
Synthesis, characterization, physical and thermodynamic properties of a novel anionic surfactant derived from Sapindus laurifolius
Received
7th May 2018
, Accepted 23rd June 2018
First published on 6th July 2018
Abstract
The present study deals with the synthesis, characterization, physical and thermodynamic properties of a novel anionic surfactant derived from Sapindus laurifolius for its potential application against conventional non-biodegradable surfactants. The synthesized surfactant was characterized by FTIR, GC-MS, EDX and FE-SEM analyses. The surfactant showed good thermal stability at different temperatures as obtained from TGA studies. Critical micelle concentration (CMC) values were obtained by surface tensiometry measurements. DLS studies revealed the micelle structures of the CMC aggregates at higher concentrations. Low interfacial tension values were obtained at the oil–aqueous interfaces for surfactant solutions. The effect of temperature on the interfacial behaviour was also investigated. Thermodynamic studies showed that adsorption was more favoured in comparison to micellization for all systems. Foam stability studies were performed as a function of time and concentration by the Bartsch method. The surfactant also formed stable emulsions at concentrations near the CMC value. A comprehensive assessment of the thermal, interfacial, foaming and emulsifying properties of the soap-nut-based surfactant provides grounds for potential application in a wide range of industries.
Introduction
Surfactants are organic compounds possessing both hydrophilic and hydrophobic groups. Because of their behavioural characteristic of reducing surface tension at the water–air and oil–water interfaces, they are used widely in various industries as flocculating and wetting agents, adhesives, inks, emulsifiers and de-emulsifiers and in the oil and gas industries.1–4 However, most of the commercial synthetic surfactants have significant detrimental effects on the environment, which has driven researchers to synthesize natural surfactants from renewable resources.5–7 The focus on an eco-friendly environment concerns the use of surfactants and creates interest to develop a natural surfactant against commercial non-biodegradable surfactant.
Natural surfactants are directly obtained from natural resources or represent a modified form of natural resources that are biodegradable in nature. In the past years, various natural surfactants have been reported that have been directly or indirectly derived from natural raw material belonging to the genus Sapindacea and that can serve as an alternative source to other commercially available surfactants.8,9 Surfactants obtained from fatty acid esters of sugars, amides and the esters of fatty acids can be used as a substituent for synthetic surfactants.10,11 Natural surfactant can also be prepared from the esterification of vegetable oils12–14 or the epoxidation of various edible and non-edible oil. These naturally synthesized surfactants have an advantage over synthetic surfactants as they are cost effective and biodegradable. A new non-edible source, namely the Sapindus mukorossi fruit, has been identified and studies have been conducted to investigate the possibility to use it in the field of surfactant science. S. mukorossi is a large tree belonging to the family Sapindacea. This species is widely spread in a wide range and flourishes well in loamy soil and in regions experiencing around 80–100 cm annual rainfall. The fruit is about 2–2.5 cm in diameter and consists of a pericarp and a hard seed. The soap-nut kernel has about 30% oil content by weight. The soap-nut fruits are reported to contain glycosides and fatty ester of tetracyclic triterpenoids. Soap-nut pericarp is traditionally used as a cleaning agent in laundries.
The increased use of commercial surfactants for industrial and domestic purposes imposes serious concerns for the environment as most of their constituents are dispersed in various compartments of the environment, like in soil, water, sediment, etc. The synthetic surfactants used nowadays can restrict the auto-filtering activity of marine animals.15 Such synthetic compounds thus cause serious pollution to the marine life and can also cause much damage to humans in the form of dermatitis, irritation and respiratory problems. Consequently, researchers around the world are actively seeking alternative sources of these synthetic surfactants that are economically viable and environmental friendly.16
The main objective of the present study is to synthesize a natural surfactant from soap-nut and to provide a substitute to commercially available surfactants. Characterization of the synthesized product was done using GC-MS, FTIR analysis, FE-SEM and EDX analysis. The interfacial properties at the air–water interface of the synthesized surfactant were investigated at different concentrations and as a function of temperature. The interfacial tension of the soap-nut surfactant at the oil–water interface was studied by varying the effective alkane carbon number (EACN). The thermodynamic and adsorption properties were also studied for the surfactant system using parameters like micellization, the Gibbs free energy of micellization and adsorption derived from a surface tension study. The foamability of the surfactant solution was studied as a function of time to predict the particle adsorption at the bubble surface and foam stability. The emulsion stability was also studied with heptane to determine the efficiency of the surfactant to be used as an emulsifier.
Experimental methods
Materials required
Soap-nut fruits were procured from a local market. Ethanol, concentrated sulfuric acid, diethyl ethyl ether, pyridine, chloro-sulfonic acid, sodium carbonate, sodium hydrogen carbonate and normal butanol were obtained from Merck (India). Alkanes, like heptane, decane and dodecane, were obtained from Rankem, India. Table 1 represents the constituents of the soap-nut oil derived from the soap-nut fruit obtained from the central region of India.
Table 1 Properties and composition of the soap-nut oil
| Properties |
Value |
| Acid value (mg KOH per g) |
13.14 |
| Density (kg m−3)@288 K |
912 |
| Kinematic viscosity (mm2 s−1)@313 K |
40.08 |
| Saponification value (mg KOH per g) |
201.2 |
Synthesis of an anionic surfactant from soap-nut pericarp
Step 2 Sulfonation reaction. The intermediate product (compound 1) obtained in the trans-esterification reaction was used to synthesize the desired surfactant by sulfonation of the soap-nut oil methyl ester. In this the sulfonation process, chloro-sulfonic acid was added to pyridine in a round-bottomed reaction flask. The reaction was carried out under constant stirring for 30 min in an ice bath as the reaction was exothermic in nature and soap-nut methyl ester was added to the reaction mixture. The reaction mixture was heated at 333 K to obtain a clear solution, which was then quenched with a saturated solution of sodium carbonate and sodium hydrogen carbonate. Normal butanol was used to dissolve the unreacted components in the organic layer and to obtain the desired product in an aqueous layer, which was then rota-evaporated to obtain a solid mixture. The organic impurities from the final product were eliminated by washing it with petroleum ether carefully. The final slightly brown solid product (compound 2) was obtained by vacuum drying the product at 338 K overnight and was then characterized by FTIR and GC-MS. The soap-nut oil used in the synthesis chiefly contained oleic acid, palmitic acid, linoleic acid and arachidic acid along with traces of unidentified saturated and unsaturated fatty acids. Hence, the final solid surfactant formed in the sulfonation process was a mixture of the sulfonated ester. A flowchart representing the preparation step of the soap-nut surfactant is shown in Fig. 2.
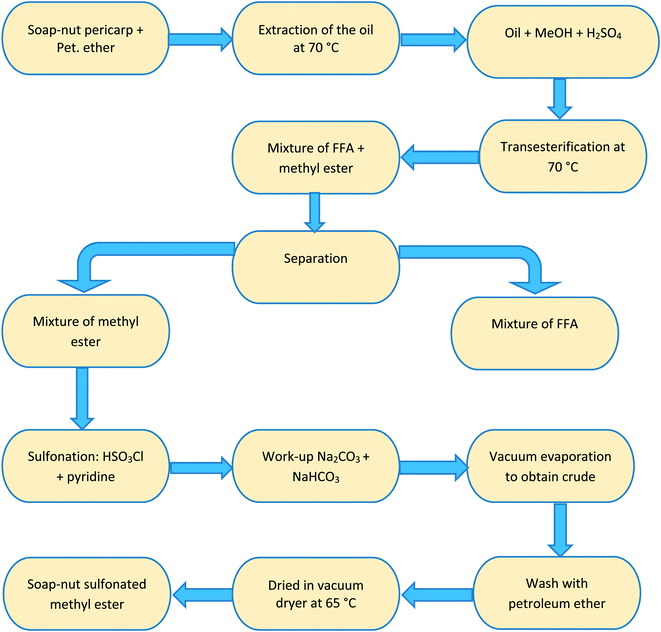 |
| | Fig. 2 Flowchart showing the stepwise synthesis of the soap-nut surfactant. | |
Characterization by FTIR, GC-MS, TGA and FE-SEM analyses
The FTIR analysis of the synthesized surfactant was done using a Perkin Elmer-Spectrum 2 spectrophotometer to detect the functional group constituents of the newly synthesized sulfonated ester surfactant derived from the soap-nut oil. A pellet of synthesized soap-nut surfactant was prepared using KBr for FTIR analysis. The surface morphology of the synthesized surfactant was analyzed by FE-SEM analysis using a SUPRA-55 instrument (ZEISS, Germany). The soap-nut surfactant was made moisture free by keeping it in a desiccator for 24 h. Gas chromatography coupled with mass spectrometry (Jeol GC-Mate II GC-MS) was used to determine the constituents of the methyl ester synthesized from the soap-nut oil. TGA analysis of the surfactant synthesized from the soap-nut oil was done to calculate its thermal stability using a thermogravimeter analyzer (Netzsch-STA 449 Jupiter).
Conductivity measurements
The electrical conductivities of the synthesized soap-nut surfactant solutions with varying concentrations were determined using a Hanna HI-2003 conductivity meter at 298 K, 313 K, 323 K, 333 K and 348 K. The electrical conductivity of a solution depends on the mobility and number of ions or charged particles present in the solution. In the case of ionic surfactants, the electrical conductivity increases upon increasing the surfactant concentration. The formation of micelles affect the conductivity of an ionic solution. The critical micelle concentration (CMC) was obtained from the break or inflection point (intersection of linear fits) in the conductivity versus surfactant concentration curve. The value of the conductivity was taken after allowing the readings to stabilize and reach a constant value. After each measurement, the probe was immersed in a standard solution for calibration.
Interfacial tension measurements at the air–water interface
The interfacial tension at the air–water interface and the CMC of the synthesized surfactant were measured using the Du Nouy ring method (Easy Dyne, Kruss Germany) in a wide range of temperatures (298 K, 313 K, 323 K, 333 K, 348 K). The surface tension was calculated for the aqueous solution of the synthesized surfactant at different surfactant concentrations. Surface tension values for each individual sample were measured three times to maintain the consistency of the results, and the final recorded values were taken as the average of the measured values. After measuring each set of different concentrations, the platinum ring used in the experiment was cleaned using acetone and was dried with a flame for the next set of experiments. Electrical conductivity measurements were performed with a Hanna HI-2003 conductivity meter to determine the Krafft temperature.
Dynamic light scattering measurements
The size distribution of surfactant molecules in aqueous solution was determined by dynamic light scattering experiments at 298 K using Zetasizer Nano S90 (Malvern Instruments, UK). It measures the particle size by measuring rate of diffusion of particles in solution using Stokes–Einstein equation. Measurements were performed at two different concentrations of surfactant solution, one at the CMC (9.3 mM) and the other at a higher concentration (11.3 mM). In this technique, the diffusion of particles moving under Brownian motion is measured and converted to the hydrodynamic diameter (dh) of droplets using Stokes–Einstein eqn (2), which is expressed below as| |
 | (2) |
where kb is the Boltzmann constant, D is the diffusion coefficient and η is the viscosity of solvents at temperature (T). Three measurements were taken for each sample to check the consistency of the results.
Interfacial tension measurements at the oil–water interface
The interfacial tension at the oil–water interface and the CMC of the synthesized soap-nut surfactant was measured by using a spinning drop tensiometer (Data Physics) at 303 K. Interfacial tension was measured for an aqueous solution of the synthesized surfactant at different concentrations. Interfacial tension values for each individual sample were measured twice to check the accuracy of the results. The measured value of the interfacial tension of distilled water at the oil–water interface using heptane was found to be 48 mN m−1 at 303 K.
Foamability and foam stability studies
Foams were prepared by the Bartsch method,18 whereby the foam was created by 20 vigorous shakings by hand of a closed cylinder containing 15 mL of surfactant solution and the remaining air (60 mL height). The mixture was shaken 10 times, with the same intensity for every set of experiments, and the foam height was observed for a period of 60 minutes.19 This method was used to evaluate the foam stability. At any instant, the foam height was measured as the difference between the total height of the foam–liquid system and the liquid level in the column. In this study, another important parameter known as the half-decay time was determined for each surfactant concentration. The half-decay time is defined as the time taken by the foam to reach one-half of its initial foam height value. It is also a parameter of the foam stability property, whereby the longer the half-decay time value, the greater is the foam stability.
Emulsion stability
The emulsification properties of the soap-nut surfactant were studied.20 Oil and the aqueous surfactant solution at different concentrations were mixed thoroughly by vigorous shaking in conical graduated tubes. The stability of the emulsion was tested by measuring the time required to separate the surfactant solution from the emulsion.
Results and discussion
FTIR spectrum analysis
The FTIR spectrum of the synthesized surfactant was recorded in the range of 4000–400 cm−1. The IR spectra of the soap-nut ester and soap-nut sulfonated ester are shown in (Fig. 3 and 4), respectively. The absorption band at 3452 cm−1 displays a weak stretching vibration of an hydroxyl group. The peak at 2939 cm−1 indicated the symmetrical vibration of a cis olefinic ![[double bond, length as m-dash]](https://www.rsc.org/images/entities/char_e001.gif) C–H double bond. The sharp peak at 1750 cm−1 is the characteristic stretching vibration of a carbonyl carbon C
C–H double bond. The sharp peak at 1750 cm−1 is the characteristic stretching vibration of a carbonyl carbon C![[double bond, length as m-dash]](https://www.rsc.org/images/entities/char_e001.gif) O bond constituted by the ester group. Bending vibrations of aliphatic groups –CH2 and –CH3 are depicted at 1448 cm−1. The absorption bands at 1250 cm−1, 1136 cm−1 and 1052 cm−1 indicate the asymmetrical axial stretching vibration of the C–O ester group.
O bond constituted by the ester group. Bending vibrations of aliphatic groups –CH2 and –CH3 are depicted at 1448 cm−1. The absorption bands at 1250 cm−1, 1136 cm−1 and 1052 cm−1 indicate the asymmetrical axial stretching vibration of the C–O ester group.
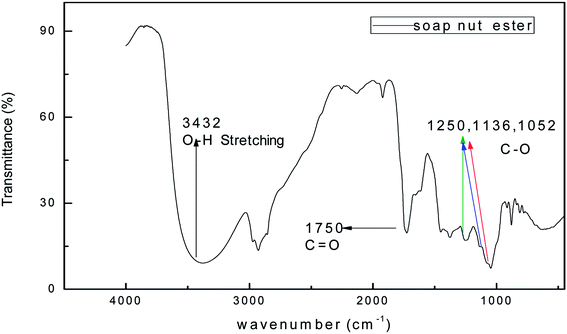 |
| | Fig. 3 FTIR spectrum of the soap-nut ester formed as an intermediate product. | |
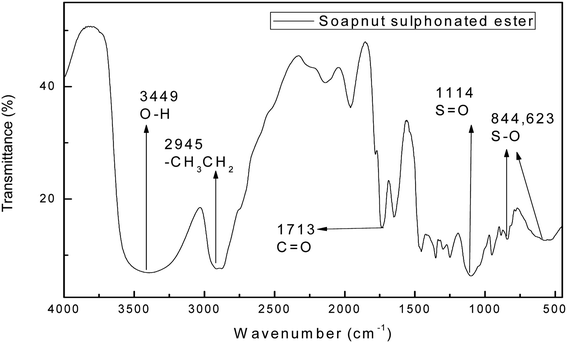 |
| | Fig. 4 FTIR study of the soap-nut sulfonated ester surfactant. | |
Fig. 4 shows the FTIR spectrum of the surfactant derived from the soap-nut oil methyl ester. The characteristic peak for the ester group of the intermediate ester is also present in the final synthesized product. The ester group peak is slightly shifted from the previous point, which may be due to the introduction of a polar group, which leads to the shift in peak to 1713 cm−1. The absorbance bands for different functional groups and bonds are depicted in Fig. 4. The newly introduced absorption peaks for the stretching vibration of sulfonate groups S![[double bond, length as m-dash]](https://www.rsc.org/images/entities/char_e001.gif) O and S–O appear at 1114 cm−1, 844 cm−1 and 623 cm−1 respectively. Thus, the FTIR results confirm the sulfonation of the soap-nut methyl ester to form the resultant desired product of a methyl ester sulfonate.
O and S–O appear at 1114 cm−1, 844 cm−1 and 623 cm−1 respectively. Thus, the FTIR results confirm the sulfonation of the soap-nut methyl ester to form the resultant desired product of a methyl ester sulfonate.
GC-MS analysis of the soap-nut surfactant
Seven fatty acid methyl esters were analyzed and identified using gas chromatography combined with mass spectrometry (GC-MS) in the soap-nut oil methyl ester formed after trans-esterification of the extracted soap-nut oil. The fatty acid methyl ester detected was a mixture of unsaturated and saturated forms, mainly palmitic (16![[thin space (1/6-em)]](https://www.rsc.org/images/entities/char_2009.gif) :
:![[thin space (1/6-em)]](https://www.rsc.org/images/entities/char_2009.gif) 0), linoleic (18
0), linoleic (18![[thin space (1/6-em)]](https://www.rsc.org/images/entities/char_2009.gif) :
:![[thin space (1/6-em)]](https://www.rsc.org/images/entities/char_2009.gif) 2), oleic (18
2), oleic (18![[thin space (1/6-em)]](https://www.rsc.org/images/entities/char_2009.gif) :
:![[thin space (1/6-em)]](https://www.rsc.org/images/entities/char_2009.gif) 1), stearic (18
1), stearic (18![[thin space (1/6-em)]](https://www.rsc.org/images/entities/char_2009.gif) :
:![[thin space (1/6-em)]](https://www.rsc.org/images/entities/char_2009.gif) 0), eicosenoic (20
0), eicosenoic (20![[thin space (1/6-em)]](https://www.rsc.org/images/entities/char_2009.gif) :
:![[thin space (1/6-em)]](https://www.rsc.org/images/entities/char_2009.gif) 1), arachidic (20
1), arachidic (20![[thin space (1/6-em)]](https://www.rsc.org/images/entities/char_2009.gif) :
:![[thin space (1/6-em)]](https://www.rsc.org/images/entities/char_2009.gif) 0) and behenic (22
0) and behenic (22![[thin space (1/6-em)]](https://www.rsc.org/images/entities/char_2009.gif) :
:![[thin space (1/6-em)]](https://www.rsc.org/images/entities/char_2009.gif) 0), as depicted in Fig. 5. The fatty acid methyl ester composition was identified using mass spectrometry and compared to the library, which permitted us to attribute the molecular formulae of different derivatives forming the constituents of the fatty acid. Table 2 also provides the retention time of the elutions along with the relative area of each peak identified in the gas chromatogram. Among the all identified esters, it was observed that oleic acid was the major component in the soap-nut oil extracted from the soap-nut fruit. The composition of the soap-nut oil methyl ester was found to be similar to the composition reported by other research groups.21,22
0), as depicted in Fig. 5. The fatty acid methyl ester composition was identified using mass spectrometry and compared to the library, which permitted us to attribute the molecular formulae of different derivatives forming the constituents of the fatty acid. Table 2 also provides the retention time of the elutions along with the relative area of each peak identified in the gas chromatogram. Among the all identified esters, it was observed that oleic acid was the major component in the soap-nut oil extracted from the soap-nut fruit. The composition of the soap-nut oil methyl ester was found to be similar to the composition reported by other research groups.21,22
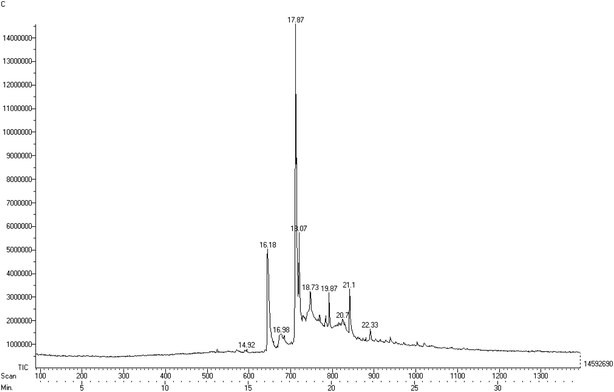 |
| | Fig. 5 Gas chromatogram of the different components of the soap-nut oil methyl ester. | |
Table 2 Results of the GC-MS analysis of the soap-nut oil methyl ester
| Acid methyl ester |
Molecular ion M+ (m/z) |
Retention time in the chromatogram (min) |
Concentration (% ±SD of total area in chromatogram) |
| Present study |
Deka et al.21 |
Jia et al.22 |
| Palmitic |
270 |
16.18 |
(20.83 ± 1.26) |
4.78 |
3.89 |
| Linoleic |
294 |
16.98 |
(0.91 ± 0.10) |
— |
8.24 |
| Oleic |
296 |
17.87 |
(52.68 ± 0.99) |
58.8 |
54.19 |
| Stearic |
298 |
18.07 |
(6.58 ± 0.09) |
1.78 |
1.17 |
| 11-Eicosenoic |
324 |
19.87 |
(4.11 ± 0.23) |
25.93 |
22.31 |
| Arachidic |
326 |
20.7 |
(13.09 ± 0.09) |
8.61 |
5.31 |
| Behenic |
354 |
21.1 |
(1.02 ± 0.03) |
— |
0.97 |
Reaction scheme of the soap-nut surfactant
Fig. 6 shows the mechanism of reaction for the synthesis of the soap-nut surfactant. The fatty acid obtained after extraction was first esterified in an acid-catalyzed reaction in the presence of methanol to obtain a methyl ester moiety in the fatty acid chain. In the sulfonation step, pyridine is added as a base to abstract the α-hydrogen from the ester group, being the most reactive site for the reaction to take place easily compared to the other available reactive sites, like the unsaturation sites present in the fatty acid. The sulfonate group was attached to the α-position of the ester group.23–25
 |
| | Fig. 6 Reaction scheme for the synthesis of the soap-nut surfactant. | |
FE-SEM analysis of the soap-nut surfactant
FE-SEM analysis of the surfactant derived from soap-nut oil was performed to study the surface morphology. Fig. 7a at 25k× zoom shows that the surfactant molecules appear to be in cluster form and are compact and bound tightly with the vicinal molecules. The image shown in Fig. 7b at 50k× zoom illustrates that the particles are rod-like and irregular in shape, and are well dispersed within the area under analysis.
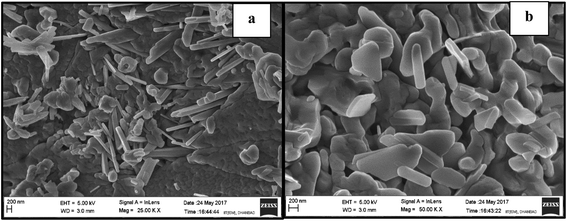 |
| | Fig. 7 FE-SEM images of the soap-nut surfactant at magnifications of: (a) 25k× (b) 50k×. | |
EDX spectrum of the soap-nut oil surfactant
In EDX analysis of the soap-nut surfactant, five elements were observed: carbon (C), oxygen (O), sodium (Na), sulfur (S) and platinum (Pt), as shown in (Fig. 8). The platinum (Pt) peak characterized in the spectra was due to the presence of coating materials used along with the surfactant during the analysis. All the remaining elements present correspond to different components of the synthesized surfactant. The EDX data clearly show the presence of sulfur as a chloro-sulfonic acid used in the sulfonation reaction, which indicates the formation of the desired product. The presence of sodium shows that the anionic surfactant exists in the form of a sodium salt. No extra peak of any other element is depicted in the EDX spectra, which indicates that the synthesized surfactant is pure and free from any other elemental impurities.
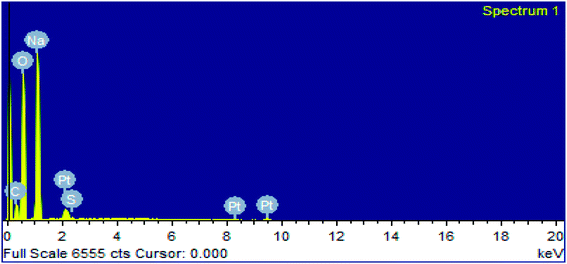 |
| | Fig. 8 EDX analysis of the synthesized surfactant. | |
Thermal gravimetric analysis of the synthesized surfactant
The thermal stability of the soap-nut surfactant was studied by thermogravimetric analysis (TGA). The weight loss percentages are depicted with the increase in temperature in Fig. 9. The TGA plot shows that the initial thermal loss occurs from 373 K to 533 K, wherein about a 6% loss in weight is observed. The initial decomposition up to 373 K marks the removal of moisture from the surfactant. The second decomposition peak marks the decomposition of any oxides present as impurities in the surfactant and the final peaks marks the degradation of surfactant at a temperature of around 523 K. No further loss in weight was observed above this temperature, which shows that the soap-nut surfactant was thermally stable even at higher temperatures. The presence of both saturated and unsaturated fatty acids in the soap-nut oil supports the good thermal stability of the synthesized surfactant as these fatty acids require a high temperature for their degradation. The anti-oxidants present in soap-nut oil aid have good thermal stability.
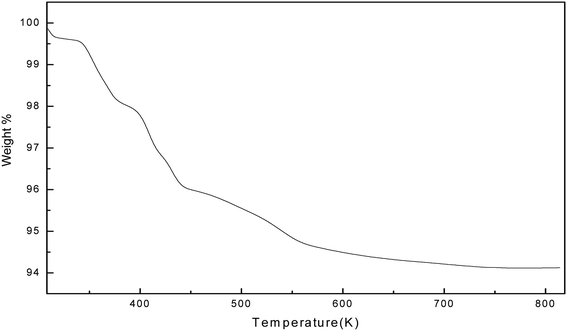 |
| | Fig. 9 Thermal stability curve for the synthesized surfactant. | |
The thermogravimetric analysis of the soap-nut surfactant was compared with the other commercial surfactants available on the market, like sodium dodecyl sulfate (SDS) and a natural surfactant derived from castor oil. Upon comparing the results of TGA, it was found that the soap-nut surfactant was stable at up to 473 K for its first weight loss but SDS and castor oil surfactant showed their initial degradation below 400 K and even a loss of 30–40% weight up to 450 K. This clearly indicates that the surfactant synthesized from soap-nut oil can be applied for application in diverse fields where there is a requirement for high temperature stability.26,27
Determination of the critical micelle concentration
Conductivity studies were conducted to determine the CMC of the surfactant system. The effects of concentration and temperature on the CMC are shown in Fig. 10. Using Williams' method, the CMC value was obtained at the breakpoint of the linear points of the conductivity versus concentration plots.28,29 The sudden change in slope was attributed to the binding of counterions to the micelles to flocculate and shows the lower mobility of micelles in comparison to surfactant molecules that do not flocculate at a lower surfactant concentration. It was observed that the CMC increased with temperature due to a delay in the micellization process in the aqueous phase. The increase in temperature distorts the structured water contiguous to the hydrophobic group, which leads to a shifting of the monomers–micelle equilibrium in favour of the monomer and promotes micellization at a higher concentration of surfactant.30 The CMC values of the soap-nut surfactant were found to be 9.3 mM at 298 K, 9.8 mM at 313 K, 10.3 mM at 323 K, 10.8 mM at 333 K and 11.3 mM at 348 K.
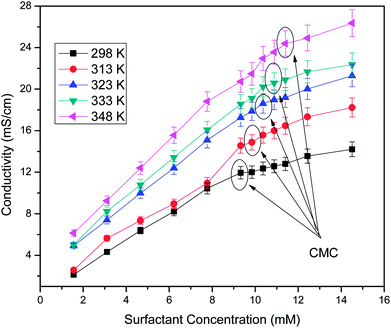 |
| | Fig. 10 Electrical conductivity versus surfactant concentration at different temperatures. | |
Surface tension, Krafft temperature and critical micelle concentration at the air–water interface
The surface tension of water at the air–water interface decreases to a minimum value and becomes almost constant or it may show a slight increase in this value with the increase in concentration of the surfactant solution, causing an improved adsorption ability at the interface with the increase in concentration. The sharp decrease in the value of surface tension indicates that the surfactant molecules have greater affinity towards the air–water interface. The specific concentration value at which the surfactant molecules are completely adsorbed at the air–water interface, thus favouring the formation of micelles, is called the critical micelle concentration (CMC). To determine the Krafft temperature, the surfactant solution (0.9 wt%) was prepared by adding 50 mL of hot water and then keeping under refrigeration at around 277–278 K for 24 h. The temperature of the cooled surfactant solution was raised gradually under constant stirring, and the conductance (κ) was measured with every 2 K rise in temperature. A sudden change in the value of κ versus temperature was not seen as the Krafft temperature of the surfactant solution was observed to be less than 277 K. The surfactant solution showed clear visibility at room temperature of 303 K, which showed its good water solubility due to the polar sulfonate group present in the chemical compound.
Natural surfactants prepared from vegetables oil have higher CMC values and show a greater tendency of adsorption at air–water interfaces. These types of surfactant require more a number of surfactant molecules to be adsorbed at the interface. The surface activity of the surfactant molecules at the air–water interface varies with the concentration of the surfactant solution in the bulk phase. The surface tension verses concentration curves of surfactant solutions at different temperatures are depicted in Fig. 11. As the concentration of the synthesized surfactant solution increases, the surface tension values decrease as there is an enhancement in adsorption of the surfactant molecules at the interface of air and water,31 and this trend was observed until the concentration reached the CMC value at approx. (as also observed by conductivity studies) 9.3 mM, 9.8 mM, 10.3 mM, 10.8 mM and 11.3 mM at 298 K, 313 K, 323 K, 333 K and 348 K having respective surface tension values of 37.1, 33.4, 32.4, 29.6 and 28.6 mN m−1. It was observed that as the temperature increases, the CMC of the surfactant increases, due to the lower probability of hydrogen bond formation at higher temperatures. A similar trend of increasing CMC and decreasing surface tension values was observed by other researchers.32,33 After the CMC, the surface tension curve attains a constant value as the surface becomes saturated with the surfactant molecules. The experiment was repeated three times to check the consistency of the results and the average of three readings was taken into consideration.
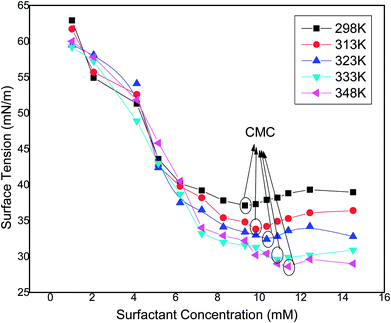 |
| | Fig. 11 Variation of surface tension (standard deviation ± 0.05 mN m−1) with the concentration of the synthesized surfactant at different temperatures. | |
Dynamic light scattering measurements
Fig. 12 shows the intensity-weighted distribution profile of different surfactants at 9.3 mM (CMC), 10.3 mM and 11.3 mM. At the CMC, the micellar structures begin to form and a single peak in the size ranges from 5–25 nm of the micelles is observed. At higher concentrations, additional surfactant molecules aggregate towards the micellar structures. This is because of the non-availability of vacant sites for surfactant adsorption at the interface. The intensity of particle distribution profile increases with concentration, due to the greater tendency of the surfactant monomers to form aggregates. Thus, micellization is more favoured when the surfactant concentration exceeds the (CMC value). At the CMC, the adsorption of surfactant molecules at the interface ceases and additional monomers interact with the micelles present at the bulk aqueous phase, resulting in the micellar size to increase.
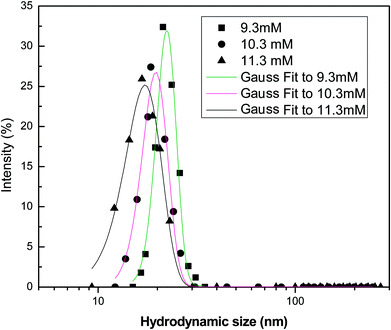 |
| | Fig. 12 Intensity-weighted particle size distribution profile of the soap-nut surfactant at different surfactant concentrations. | |
In a surfactant system, continuous flocculation and de-flocculation of the surfactant molecules occur, which is due to the variation in particle size and their distribution. Therefore, modelling of the DLS data is important to analyse the size and behaviour of molecules in the aqueous system. The probability distribution analysis showed good fitting with the experimental data as the adjusted coefficients of determination for the Gaussian model were found to be 0.967, 0.984 and 0.991 for the 9.3 mM, 10.3 mM and 11.3 mM solutions, respectively. This shows that the size distribution profile obtained from analysis of the surfactant solutions follows a normal or Gaussian statistical behaviour. This was also supported by the low values of offset obtained for the different analyzed systems. The adjusted coefficient values of distribution parameters are represented in Table 3.
Table 3 Analysis of the scattering intensity versus size plots of the surfactant system using a Gaussian probability distribution function
| Surfactant concentration |
Fitting parameters |
Distribution function (Gaussian) |
| 9.3 mM |
Std. deviation (w) |
2.598 |
| Area (A) |
207.093 |
| Offset (yo) |
0.145 |
| Centre (xc) |
22.321 |
| Adj R2 |
0.967 |
| 10.3 mM |
Std. deviation (w) |
2.922 |
| Area (A) |
195.942 |
| Offset (yo) |
0.038 |
| Centre (xc) |
19.62 |
| Adj R2 |
0.984 |
| 11.3 mM |
Std. deviation (w) |
3.679 |
| Area (A) |
232.901 |
| Offset (yo) |
−0.07 |
| Centre (xc) |
17.313 |
| Adj R2 |
0.991 |
Interfacial tension measurements at the oil–water interface
Studies of the interfacial tension between oil (heptane, decane and dodecane) and the soap-nut surfactant solutions at different concentrations at 303 K are depicted in (Fig. 13). The interfacial tension initially decreases to a minimum value, due to the dynamic equilibrium existing between adsorption and desorption of the surfactant molecules at the oil–water interface. As the aqueous phase interacts with the oil phase, surfactant molecules show a diffusion phenomenon from the bulk to the water interface, while at the interface of oil and water, phase adsorption occurs. Here, at first, the adsorption rate of molecules was higher than the desorption rate, leading to a lowering of the interfacial tension. Finally, when an equilibrium state was achieved and the adsorption and desorption forces were balanced, the IFT approached towards a constant value.34 At 9.3 mM (the CMC), the value of IFT was found to be lowest in all the oils tested. As the surfactant concentration was further increased, micelle formation took place, resulting in a slight increase in IFT. It was found that with the increasing EACN number of the alkanes, the tendency to reduce the IFT decreases.35
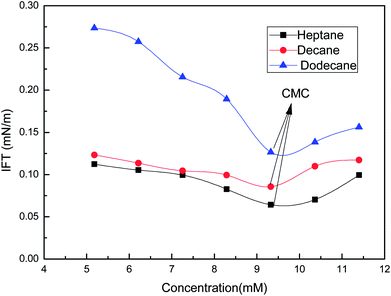 |
| | Fig. 13 Variation of the interfacial tension with the concentration of the soap-nut surfactant at the oil–water interface. | |
Foamability and foam stability of the synthesized surfactant
The foam height can be calculated by the net foam generated in the foaming process. At a particular instance of time, the foam height can be evaluated from eqn (3);| | |
hfoam = htotal − hliquid
| (3) |
where hfoam, htotal and hliquid as a function of time are depicted in Fig. 14a. The foam stability increases with increasing the concentration36 of the surfactant solution and becomes constant after it has reached a certain value. At low surfactant concentration, the free concentration of the surfactant is depleted because of its adsorption onto the particles. The surfactant molecules cannot stabilize the foam, but with increasing the concentration, the drainage from the foam slows down, which favours the foam stability.37 Amphiphilic particles promote foaming by attachment to the bubble surface as individual particles but at higher concentration, say above the CMC, the particles concentration foamability is inhibited due to flocculation of the bubbles.38 In addition, it can be observed from Fig. 14b that the half-life time increases with the surfactant concentration. The half-decay time values for the surfactant solutions were 48, 49, 52, 54, 55, 58 and 59 min for 7, 9, 11, 13 mM solutions, respectively. However, it was also evident that the foam stability does not increase drastically, but gradually with the surfactant concentration, showing that a quite longer foam life could be observed as a result of the optimization of the surface and interfacial properties of the surfactant.39
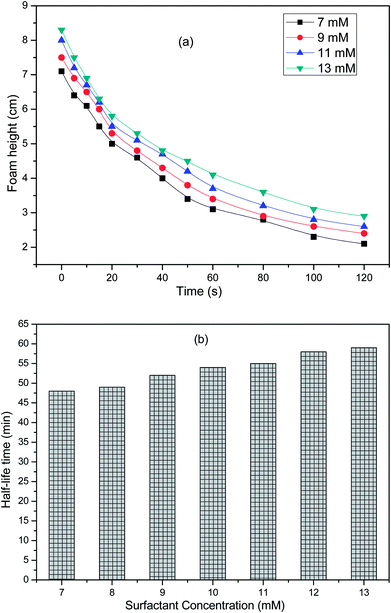 |
| | Fig. 14 Foaming properties of the surfactant solutions: (a) foam height as a function of time at different surfactant concentrations, (b) half-life time as a function of the surfactant concentration. | |
Emulsion stability
Surfactants possess an important property of emulsification, which leads to their use as emulsifying agents in various industrial applications. The amphiphilic property of a surfactant helps in solubilizing the water in non-polar liquids, like oils. Surfactants get adsorbed on the oil–water interface to reduce interfacial tension. This subsequently leads to a decrease in the energy required to form the oil–water interface for the emulsion. The oil-in-water emulsion so formed shows the emulsification ability of the surfactant. Here, emulsions formed by a surfactant near the CMC were found to be stable and did not separate for more than 180 min, when compared to the other lower concentrations, which were less stable for the time lapse the experiment was under observation for, as shown in (Fig. 15). At the CMC, it was observed that the stability time was the highest, showing the greatest packing density within the cross-sectional area per adsorbed surfactant molecule.40–44 With the further increase in concentration, the packing density of surfactant molecules at the oil–water interface remain unaltered, due to the unavailability of vacant sites for adsorption. The stabilizing effect of oil-in-water emulsions at concentrations near the CMC could be attributed to the ability of long-chain alkanes in the oil to associate and form mixed monolayers with the adsorbed ionic surfactant at the oil–water interface.45–47 Therefore, the adsorption tendency is favoured till the CMC concentration is reached, following which the micellization tendency in the bulk oil phase is favoured. The emulsions formed in the presence of 5% oil (heptane, decane and dodecane) were found to remain stable even after 24 h visual observation, as evident from Fig. 15 and 16. Emulsions formed with decane and dodecane were found to be more pronounced as compared to the heptane system with the lapse of time.
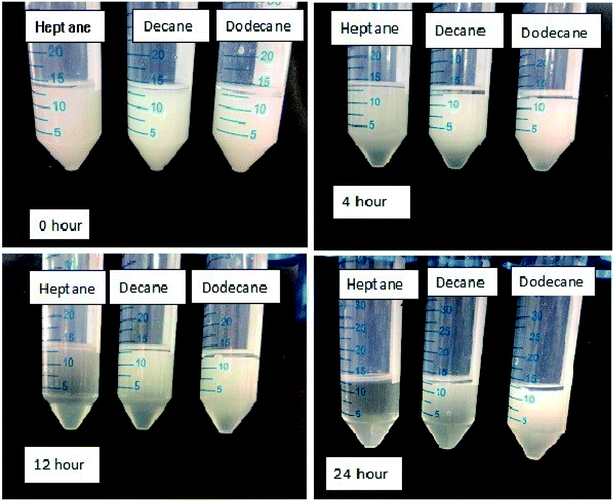 |
| | Fig. 15 Images depicting the stability of emulsions at the CMC with the lapse of time at 303 K. | |
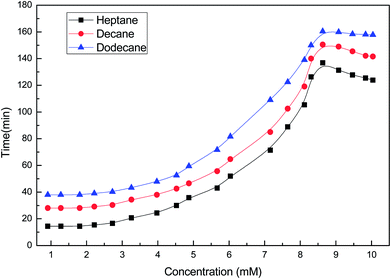 |
| | Fig. 16 Emulsion stability tests of the soap-nut surfactant at different concentrations. | |
Adsorption behaviour at the air–aqueous interface
The surface excess concentration, (Γmax) is an important parameter for calculating the degree of adsorption of surfactant molecules at the air interface48 as obtained by using Gibb's isotherm eqn (4):| |
Γmax = −1/RT(∂γ/(∂![[thin space (1/6-em)]](https://www.rsc.org/images/entities/char_2009.gif) ln ln![[thin space (1/6-em)]](https://www.rsc.org/images/entities/char_2009.gif) c))T c))T
| (4) |
where Γmax corresponds to the surface excess concentration of the surfactant solution calculated in mol m−2, R represents the gas constant (R = 8.314 J mol−1 K−1), T represents the temperature measured in K, γ represents the surface tension measured in mN m−1, c is the surfactant concentration in the aqueous phase and (dγ/d![[thin space (1/6-em)]](https://www.rsc.org/images/entities/char_2009.gif) ln
ln![[thin space (1/6-em)]](https://www.rsc.org/images/entities/char_2009.gif) c) corresponds to the surface tension isotherm slope up to the CMC (the concentration at which the surface tension isotherm curve shows a sharp break). To determine the surface activity of a surfactant solution, it is essential to consider the packing density of the surfactant solution at the air interface. The orientation and degree of packing of the adsorbed surfactant molecules can be calculated using the area per molecule at the interface. From the surface excess concentration, the minimum area (Amin) occupied per surfactant molecule (in Å2 per molecule) at the air interface can be obtained using eqn (5):
c) corresponds to the surface tension isotherm slope up to the CMC (the concentration at which the surface tension isotherm curve shows a sharp break). To determine the surface activity of a surfactant solution, it is essential to consider the packing density of the surfactant solution at the air interface. The orientation and degree of packing of the adsorbed surfactant molecules can be calculated using the area per molecule at the interface. From the surface excess concentration, the minimum area (Amin) occupied per surfactant molecule (in Å2 per molecule) at the air interface can be obtained using eqn (5):| |
 | (5) |
where NA is Avogadro's number and Γmax represents the surface excess concentration measured in mol m−2. The values of Γmax and Amin calculated from Gibbs adsorption isotherm predict the molecular arrangement of surfactant molecules at the air interface.49 The greater the adsorption, the smaller is the effective area (Amin) of surfactant molecules at the surface.
The adsorption efficiency, pC20, and surface tension reduction effectiveness, ΠCMC are supplementary parameters that show the surface activity of the surfactant molecules in solution.50 The adsorption efficiency can be calculated using eqn (6):
| |
pC20 = −log![[thin space (1/6-em)]](https://www.rsc.org/images/entities/char_2009.gif) C20 C20
| (6) |
where
pC20 is the surfactant concentration which lowers the pure solvent surface tension by 20 mN m
−2 and is the minimum concentration required for saturation of the surface adsorption.
The other parameter ΠCMC indicates the minimum value of the surface tension caused by dissolution of the surfactant molecules and hence represents the surfactant efficiency to lower the surface tension of the solvent, as calculated using eqn (7):
where
γCMC and
γo are the surface tensions of the solution at the CMC and of pure solvent, respectively. A greater value of Π
CMC or smaller value of
γCMC predicts a better ability to lower the surface tension of a solution. This clearly shows that with an increase in temperature, the ability to lower the surface tension of aqueous solutions is significantly enhanced. The different adsorption parameters are depicted in
Table 4.
Table 4 Adsorption parameters calculated for the soap-nut surfactant at different temperatures
| Temp (K) |
CMC (M) |
γCMC (mN m1) |
Γmax (μmol m−2) × 10−3 |
Amin (Å2 per molecule) |
pC20 |
ΠCMC (mN m−1) |
| 298 |
9.3 × 10⁻³ |
37.1 |
5.67 |
29.24 |
2.69 |
34.8 |
| 313 |
9.8 × 10⁻³ |
33.8 |
5.79 |
28.64 |
2.70 |
35.8 |
| 323 |
10.3 × 10⁻³ |
32.4 |
5.86 |
28.31 |
2.74 |
35.6 |
| 333 |
10.8 × 10⁻³ |
29.6 |
5.93 |
27.65 |
2.75 |
36.3 |
| 348 |
11.3 × 10⁻³ |
28.6 |
5.95 |
27.86 |
2.77 |
36.0 |
Thermodynamics of micellization and adsorption
Micellization is the process of an association–dissociation phenomenon in which both micelles and surfactant molecules simultaneously exist in a surfactant solution. Fig. 17 shows a schematic explaining the micellization process with increasing surfactant concentration. A coulombic force of repulsion exists between the polar head group acting against the attractive force between the hydrophobic hydrocarbon tail chains of the surfactant in order to form agglomerates, which separate them continuously.49 The Gibbs free energy change of micellization (ΔGmic) can be calculated by using eqn (8):| |
ΔGmic = RT![[thin space (1/6-em)]](https://www.rsc.org/images/entities/char_2009.gif) ln ln![[thin space (1/6-em)]](https://www.rsc.org/images/entities/char_2009.gif) XCMC XCMC
| (8) |
where R is the universal gas constant (8.314 J K−1 mol−1), T is the temperature (K) and XCMC is a ratio of the molar concentration of the surfactant in the liquid phase at the CMC and that of the solvent in the liquid phase. The values of ΔGmic were found to be negative for the soap-nut oil-based surfactant system at different temperatures, showing that the micellization process was feasible.
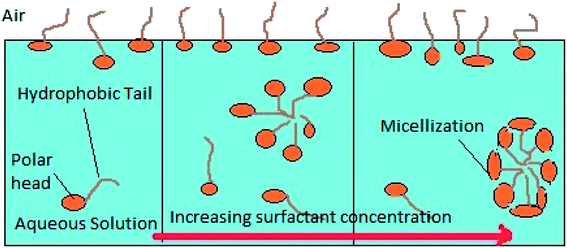 |
| | Fig. 17 Micellization process with increasing surfactant concentration. | |
The enthalpy of micellization for the soap-nut oil derived surfactant system was determined by using the values of ΔGmic in the Gibbs–Helmholtz relation, as shown in eqn (9):
| |
 | (9) |
The value of the ΔHmic is negative, which proves that micellization was favourable for its application. The higher the negative value of ΔHmic, the greater is the tendency of micellization.
The entropy change can be calculated easily with the already calculated values of Gibbs free energy change and the enthalpy change. Taking entropy as a function of the temperature and volume of surfactant solution, the TΔSmic equation can be expressed according to the second law of thermodynamics in eqn (10):
| | |
TΔSmic = ΔHmic − ΔGmic
| (10) |
The values of ΔSmic were found to be positive. As we know, the entropy of a system is the degree of randomness, here is was observed that the entropy increased with the increase in temperature as the randomness of the system increased by the destruction of micellar structures. This result further validates the more negative values of ΔGmic with the increase in temperature. Table 5 shows different parameters calculated during the micellization study.
Table 5 Micellization parameters for the soap-nut surfactant at different temperatures
| Temperature (K) |
ΔGmic (kJ mol−1) |
ΔHmic (kJ mol−1) |
ΔSmic (kJ mol−1 K) |
TΔSmic (kJ mol−1) |
| 298 |
−21.53 |
−2.96 |
0.062 |
18.47 |
| 313 |
−22.47 |
−3.26 |
0.061 |
19.18 |
| 323 |
−23.06 |
−3.48 |
0.060 |
19.38 |
| 333 |
−23.67 |
−3.70 |
0.059 |
19.64 |
| 348 |
−24.57 |
−4.04 |
0.058 |
20.18 |
A complete analysis of the adsorption parameters at the air interface was performed from the surface tension data for air–aqueous systems at different temperatures. The amount of surfactant solution adsorbed at the air interface per unit area was calculated using Gibbs adsorption equation. With the addition of the surfactant in the aqueous phase, the surfactant molecules initially adsorb at the interface between air and aqueous solution. The Gibbs free energy of adsorption (ΔGads) in kJ mol−1 was determined from the calculated value of ΔGmic (kJ mol−1) in eqn (11):
| | |
ΔGads = [ΔGads − 6.023ΠCMCAmin] × 10−3
| (11) |
here, the Δ
Gads values are more negative than Δ
Gmic for the surfactants at all temperatures, confirming that the adsorption process is generally favoured over micellization, as depicted in (
Fig. 18).
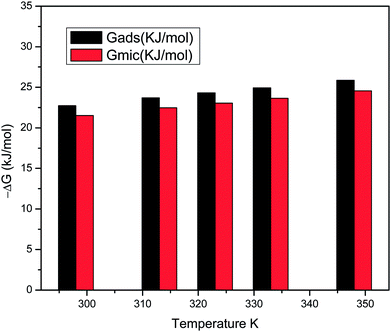 |
| | Fig. 18 Comparison of ΔGmic and ΔGads values for the surfactant solutions at different temperatures. | |
Fig. 19 shows the variation of TΔSmic with −ΔHmic for the soap-nut oil surfactant solutions. Initially, ΔHmic shows a linear relationship with TΔSmic. After a threshold value of ΔHmic is reached, the slope of the curve slightly decreases due to the reduction in micellization. Studies involving enthalpy–entropy compensations show that (−ΔHmic) < (TΔSmic). Therefore, it is evident that the micellization behaviour of the surfactant is entropy driven, not enthalpy driven.
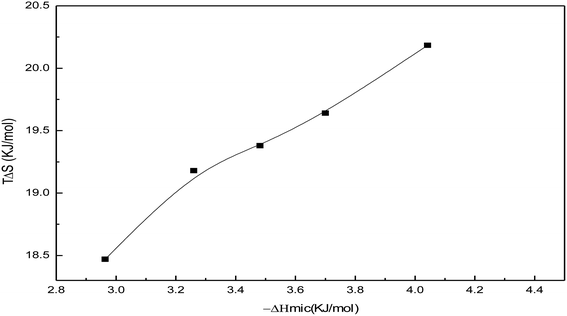 |
| | Fig. 19 Enthalpy–entropy compensation showing −ΔHmic versus TΔSmic plots for the soap-nut oil surfactant. | |
Conclusion
The effectiveness of an anionic surfactant synthesized from a natural vegetable resource, soap-nut pericarp was evaluated with an objective to find an alternative to the commercial surfactants available in the market. The surfactant synthesized was suitably characterized by FTIR, GC-MS, EDX and FE-SEM techniques for the determination of the functional groups, various composition of esters, elemental composition and molecular surface morphology, respectively. Thermogravimetric analysis was performed and showed good thermal stability of the synthesized surfactant, suggesting it could be used for industrial applications at varying temperatures. The Krafft temperature of the synthesized surfactant solution was observed at below 277 K. The CMC of the soap-nut surfactant was calculated using the conductivity method and was found to be 9.3 mM at 298 K. Low interfacial tension values at the air–water and oil–water interfaces predicted its efficacy to be employed as a surface active agent in different industries. DLS studies revealed that a fraction of the micellar structures at the CMC aggregate to form clusters as the additional surfactant is added to an aqueous solution. The effect of temperature on the surface tension values was also studied and it was found that the surface tension values decreased with the increase in temperature. Further, it was noticed that the CMC of the surfactant increased with increases in the temperature because of distortion of the structured water molecules adjoining to the hydrophobic group of the surfactant. The aggregation process of surfactant molecules was entropy driven, not enthalpy driven. Thermodynamic studies revealed that the adsorption tendency was more favoured than micellization in air–aqueous systems at a varied temperature range. This may be attributed to the greater tendency of surfactant molecules to migrate to the interface rather than aggregating to micellar structures. The adsorption and micellization behaviours were observed to critically depend on temperature. The foam stability of the surfactant solution is an important property as it facilitates the adsorption of surfactant molecules at the air–water interface. In the emulsion stability at the CMC with oil, a low value of surface tension at the air–water interface and oil–water interfaces provided ground to suggest its potential application in various fields of application as an eco-friendly and biodegradable surfactant.
Conflicts of interest
There are no conflicts of interest to declare.
Acknowledgements
The authors gratefully acknowledge the financial assistance provided by Oil India Limited [Contract No. 62O6917], Duliajan, Assam, India to the Department of Petroleum Engineering, Indian Institute of Technology (ISM), Dhanbad, India.
References
- D. Mańko, A. Zdziennicka and B. Jańczuk, Appl. Surf. Sci., 2017, 392, 17–125 CrossRef.
- A. N. Bondarchuk, L. M. Peter, G. P. Kissling, E. Madrid, J. A. Aguilar-Martínez, Z. Rymansaib, P. Iravani, M. Gromboni, L. H. Mascaro, A. Walsh and F. Marken, Appl. Catal., B, 2017, 211, 289–295 CrossRef.
- R. Zhang, J. Huo, Z. Peng, Q. Feng, J. Zhang and J. Wang, Colloids Surf., A, 2017, 520, 855–863 CrossRef.
- L. Torres, A. Moctezuma, J. R. Avendaño, A. Muñoz and J. Gracida, J. Pet. Sci. Eng., 2011, 76(1), 6–11 CrossRef.
- N. Pal, K. Babu and A. Mandal, J. Pet. Sci. Eng., 2016, 146, 591–600 CrossRef.
- I. Zhang, B. Cai, W. Xu, H. Gang, J. Liu, S. Yang and B. Mu, Colloids Surf., A, 2015, 483, 87–95 CrossRef.
- A. M. Rabiu, S. Elias and O. Oyekola, Energy Procedia, 2016, 100, 88–192 CrossRef.
- D. Roy, R. R. Kommalapati, S. S. Mandava, K. T. Valsaraj and W. D. Constant, Environ. Sci. Technol., 1997, 31, 670–675 CrossRef.
- N. Singh, A. Kaur and K. Yadav, Nat. Sci., 2010, 8, 41–47 Search PubMed.
- K. Holmberg, Curr. Opin. Colloid Interface Sci., 2001, 6, 148–159 CrossRef.
- S. Salati, G. Papa and F. Adani, Biotechnol. Adv., 2011, 29, 913–922 CrossRef PubMed.
- K. Babu, N. Pal, V. K. Saxena and A. Mandal, Korean J. Chem. Eng., 2016, 33, 711–719 CrossRef.
- N. A. Negm, A. S. El-Tabl, I. A. Aiad, K. Zakareya and A. H. Moustafa, J. Surfactants Deterg., 2013, 16(6), 857–863 CrossRef.
- S. Kumar, A. Kumar and A. Mandal, AIChE J., 2017, 63, 2731–2741 CrossRef.
- S. A. Ostroumov, Hydrobiologia, 2003, 500, 341–344 CrossRef.
- S. Song, L. Zhu and W. Zhou, Environ. Pollut., 2008, 156, 1368–1370 CrossRef PubMed.
- S. S. Vieira, Z. M. Magriotis, N. A. V. Santos, A. A. Saczk, C. E. Hori and P. A. Arroyo, Bioresour. Technol., 2013, 133, 248–255 CrossRef PubMed.
- O. Bartsch and U. Schaumsysteme, Fortschrittsber. Kolloide Polym., 1924, 20, 1–49 Search PubMed.
- K. G. Marinova, E. S. Basheva, B. Nenova, M. Temelska, A. Y. Mirarefi, B. Campbell and I. B. Ivanov, Food Hydrocolloids, 2009, 23, 1864–1876 CrossRef.
- S. C. Kothekar, A. M. Ware, J. T. Waghmare and S. A. Momin, J. Dispersion Sci. Technol., 2007, 28, 477–484 CrossRef.
- M. A. H. Shah, K. Dutta and D. C. Deka, Adv. Appl. Sci. Res., 2015, 5(4), 43–50 Search PubMed.
- C. Sun, L. Jia, B. Xi, L. Wang and X. Wang, Ind. Crops Prod., 2017, 102, 97–104 CrossRef.
- A. Mariod, H. Hassan and K. M. Saeed, Eurasian Journal of Forest Science, 2018, 6(1), 52–67 Search PubMed.
- K. A. Elaries, I. M. Tan, M. Awang and I. Saaid, Pet. Sci. Technol., 2010, 28, 1799–1806 CrossRef.
- J. A. Torres, L. A. Diaz and J. F. Sanchez, Ing. Invest., 2009, 29, 48–53 Search PubMed.
- B. Meschi, A. J. Trinidad, G. Rivers, S. Sy, P. Russo, A. Yu, N. Y. Zhou and B. Zhao, Carbon, 2015, 91, 188–199 CrossRef.
- K. Babu, N. K. Maurya, A. Mandal and V. K. Saxena, Braz. J. Chem. Eng., 2015, 32, 795–803 CrossRef.
- R. J. Williams, J. N. Phillips and K. J. Mysels, Trans. Faraday Soc., 1954, 51, 728–737 RSC.
- N. Pal, N. Saxena and A. Mandal, Colloid Polym. Sci., 2017, 295, 2261–2277 Search PubMed.
- S. Kumar and A. Mandal, Tenside, Surfactants, Deterg., 2017, 54(5), 427–436 CrossRef.
- B. Gao and M. M. Sharma, J. Colloid Interface Sci., 2013, 407, 375–381 CrossRef PubMed.
- E. Mohajeri and G. D. Noudeh, J. Chem., 2012, 9(4), 2268–2274 Search PubMed.
- P. Pillai, N. Pal and A. Mandal, J. Surfactants Deterg., 2017, 20, 1321–1335 CrossRef.
- H. Zhao, S. Xia and P. Ma, J. Chem. Technol. Biotechnol., 2005, 80(10), 1089–1096 CrossRef.
- J. Lu, P. J. Liyanage, S. Solairaj, S. Adkins, G. P. Arachchilage, D. H. Kim, C. Britton, U. Weerasooriya and G. A. Pope, J. Pet. Sci. Eng., 2014, 120, 94–101 CrossRef.
- A. Pradhan and A. Bhattacharyya, J. Surf. Sci. Technol., 2014, 30, 59–76 Search PubMed.
- A. Verma, G. Chauhan and K. Ojha, Asia-Pac. J. Chem. Eng., 2017, 12(6), 872–883 CrossRef.
- H. Azira, A. Tazerouti and J. P. Canselie, J. Surfactants Deterg., 2008, 11(4), 279–286 CrossRef.
- S. Kumar and A. Mandal, Appl. Surf. Sci., 2017, 420, 9–20 CrossRef.
- S. J. Rehfeld, J. Phys. Chem., 1962, 66(10), 1966–1968 CrossRef.
- H. Katepalli and A. Bose, Langmuir, 2014, 30(43), 12736–12742 CrossRef PubMed.
- Z. G. Cui, L. L. Yang, Y. Z. Cui and B. P. Binks, Langmuir, 2010, 26(7), 4717–4724 CrossRef PubMed.
- D. Kurukji, R. Pichot, F. Spyropoulos and I. T. Norton, J. Colloid Interface Sci., 2013, 409, 88–97 CrossRef PubMed.
- N. Pal, N. Saxena and A. Mandal, J. Chem. Eng. Data, 2017, 62, 1278–1291 CrossRef.
- J. E. Carless and G. W. Hallworth, J. Colloid Interface Sci., 1968, 26(1), 75–88 CrossRef.
- J. Sjöblom, P. Stenius, S. Simon and B. A. Grimes, Encyclopedia of Colloid and Interface Science, 2013, pp. 415–454 Search PubMed.
- W. Wu, H. Fang, F. Yang, S. Chen, X. Zhu, Q. Yuan and W. Gan, J. Phys. Chem. C, 2016, 120(12), 6515–6523 CrossRef.
- Z. Zhao, Z. Li, W. Qiao and L. Cheng, Colloids Surf., A, 2005, 259(1–3), 71–80 CrossRef.
- N. Pal, N. Saxena and A. Mandal, Colloids Surf., A, 2017, 533, 20–32 CrossRef.
- M. J. Rosen, Surfactants and Interfacial Phenomena, John Wiley and Sons, Inc., New York, 3rd edn, 2004 Search PubMed.
|
| This journal is © The Royal Society of Chemistry 2018 |
Click here to see how this site uses Cookies. View our privacy policy here.  Open Access Article
 *a
*a
![[thin space (1/6-em)]](https://www.rsc.org/images/entities/char_2009.gif) :
:![[thin space (1/6-em)]](https://www.rsc.org/images/entities/char_2009.gif) 5 and 1
5 and 1![[thin space (1/6-em)]](https://www.rsc.org/images/entities/char_2009.gif) :
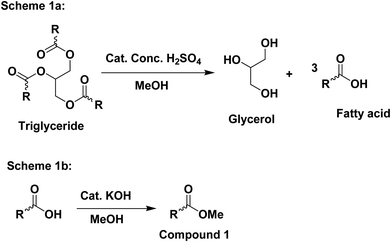
:![[thin space (1/6-em)]](https://www.rsc.org/images/entities/char_2009.gif) 10) and a drop of KOH (base) was added to the reaction mixture to catalyze the reaction. The alcoholysis reaction in (Fig. 1) was reversible, therefore, an excess amount of alcohol was used to shift the equilibrium in the direction of product formation. The soap-nut oil used in the trans-esterified process was pre-treated to remove the free fatty acid content.
10) and a drop of KOH (base) was added to the reaction mixture to catalyze the reaction. The alcoholysis reaction in (Fig. 1) was reversible, therefore, an excess amount of alcohol was used to shift the equilibrium in the direction of product formation. The soap-nut oil used in the trans-esterified process was pre-treated to remove the free fatty acid content.

![[thin space (1/6-em)]](https://www.rsc.org/images/entities/char_2009.gif) :
:![[thin space (1/6-em)]](https://www.rsc.org/images/entities/char_2009.gif) 5, 1
5, 1![[thin space (1/6-em)]](https://www.rsc.org/images/entities/char_2009.gif) :
:![[thin space (1/6-em)]](https://www.rsc.org/images/entities/char_2009.gif) 10), and the percentage yield for the above two ratios was found to 87.6% and 88.9%. With the increasing concentration of methanol, the percentage yield was found to increase.17
10), and the percentage yield for the above two ratios was found to 87.6% and 88.9%. With the increasing concentration of methanol, the percentage yield was found to increase.17
![[double bond, length as m-dash]](https://www.rsc.org/images/entities/char_e001.gif) C–H double bond. The sharp peak at 1750 cm−1 is the characteristic stretching vibration of a carbonyl carbon C
C–H double bond. The sharp peak at 1750 cm−1 is the characteristic stretching vibration of a carbonyl carbon C![[double bond, length as m-dash]](https://www.rsc.org/images/entities/char_e001.gif) O bond constituted by the ester group. Bending vibrations of aliphatic groups –CH2 and –CH3 are depicted at 1448 cm−1. The absorption bands at 1250 cm−1, 1136 cm−1 and 1052 cm−1 indicate the asymmetrical axial stretching vibration of the C–O ester group.
O bond constituted by the ester group. Bending vibrations of aliphatic groups –CH2 and –CH3 are depicted at 1448 cm−1. The absorption bands at 1250 cm−1, 1136 cm−1 and 1052 cm−1 indicate the asymmetrical axial stretching vibration of the C–O ester group.
![[double bond, length as m-dash]](https://www.rsc.org/images/entities/char_e001.gif) O and S–O appear at 1114 cm−1, 844 cm−1 and 623 cm−1 respectively. Thus, the FTIR results confirm the sulfonation of the soap-nut methyl ester to form the resultant desired product of a methyl ester sulfonate.
O and S–O appear at 1114 cm−1, 844 cm−1 and 623 cm−1 respectively. Thus, the FTIR results confirm the sulfonation of the soap-nut methyl ester to form the resultant desired product of a methyl ester sulfonate.![[thin space (1/6-em)]](https://www.rsc.org/images/entities/char_2009.gif) :
:![[thin space (1/6-em)]](https://www.rsc.org/images/entities/char_2009.gif) 0), linoleic (18
0), linoleic (18![[thin space (1/6-em)]](https://www.rsc.org/images/entities/char_2009.gif) :
:![[thin space (1/6-em)]](https://www.rsc.org/images/entities/char_2009.gif) 2), oleic (18
2), oleic (18![[thin space (1/6-em)]](https://www.rsc.org/images/entities/char_2009.gif) :
:![[thin space (1/6-em)]](https://www.rsc.org/images/entities/char_2009.gif) 1), stearic (18
1), stearic (18![[thin space (1/6-em)]](https://www.rsc.org/images/entities/char_2009.gif) :
:![[thin space (1/6-em)]](https://www.rsc.org/images/entities/char_2009.gif) 0), eicosenoic (20
0), eicosenoic (20![[thin space (1/6-em)]](https://www.rsc.org/images/entities/char_2009.gif) :
:![[thin space (1/6-em)]](https://www.rsc.org/images/entities/char_2009.gif) 1), arachidic (20
1), arachidic (20![[thin space (1/6-em)]](https://www.rsc.org/images/entities/char_2009.gif) :
:![[thin space (1/6-em)]](https://www.rsc.org/images/entities/char_2009.gif) 0) and behenic (22
0) and behenic (22![[thin space (1/6-em)]](https://www.rsc.org/images/entities/char_2009.gif) :
:![[thin space (1/6-em)]](https://www.rsc.org/images/entities/char_2009.gif) 0), as depicted in Fig. 5. The fatty acid methyl ester composition was identified using mass spectrometry and compared to the library, which permitted us to attribute the molecular formulae of different derivatives forming the constituents of the fatty acid. Table 2 also provides the retention time of the elutions along with the relative area of each peak identified in the gas chromatogram. Among the all identified esters, it was observed that oleic acid was the major component in the soap-nut oil extracted from the soap-nut fruit. The composition of the soap-nut oil methyl ester was found to be similar to the composition reported by other research groups.21,22
0), as depicted in Fig. 5. The fatty acid methyl ester composition was identified using mass spectrometry and compared to the library, which permitted us to attribute the molecular formulae of different derivatives forming the constituents of the fatty acid. Table 2 also provides the retention time of the elutions along with the relative area of each peak identified in the gas chromatogram. Among the all identified esters, it was observed that oleic acid was the major component in the soap-nut oil extracted from the soap-nut fruit. The composition of the soap-nut oil methyl ester was found to be similar to the composition reported by other research groups.21,22


![[thin space (1/6-em)]](https://www.rsc.org/images/entities/char_2009.gif) ln
ln![[thin space (1/6-em)]](https://www.rsc.org/images/entities/char_2009.gif) c))T
c))T
![[thin space (1/6-em)]](https://www.rsc.org/images/entities/char_2009.gif) ln
ln![[thin space (1/6-em)]](https://www.rsc.org/images/entities/char_2009.gif) c) corresponds to the surface tension isotherm slope up to the CMC (the concentration at which the surface tension isotherm curve shows a sharp break). To determine the surface activity of a surfactant solution, it is essential to consider the packing density of the surfactant solution at the air interface. The orientation and degree of packing of the adsorbed surfactant molecules can be calculated using the area per molecule at the interface. From the surface excess concentration, the minimum area (Amin) occupied per surfactant molecule (in Å2 per molecule) at the air interface can be obtained using eqn (5):
c) corresponds to the surface tension isotherm slope up to the CMC (the concentration at which the surface tension isotherm curve shows a sharp break). To determine the surface activity of a surfactant solution, it is essential to consider the packing density of the surfactant solution at the air interface. The orientation and degree of packing of the adsorbed surfactant molecules can be calculated using the area per molecule at the interface. From the surface excess concentration, the minimum area (Amin) occupied per surfactant molecule (in Å2 per molecule) at the air interface can be obtained using eqn (5):
![[thin space (1/6-em)]](https://www.rsc.org/images/entities/char_2009.gif) C20
C20
![[thin space (1/6-em)]](https://www.rsc.org/images/entities/char_2009.gif) ln
ln![[thin space (1/6-em)]](https://www.rsc.org/images/entities/char_2009.gif) XCMC
XCMC


