
 Open Access Article
 This Open Access Article is licensed under a Creative Commons Attribution-Non Commercial 3.0 Unported Licence
Do the fragments from decomposed ZIF-8 greatly affect some of the intramolecular proton-transfer of thymine? A quantum chemical study†
Dejie Lia,
Ying Hanb,
Huijuan Lic,
Ping Zhanga,
Qi Kanga and
Dazhong Shen *a
*a
aCollege of Chemistry, Chemical Engineering and Materials Science, Collaborative Innovation Center of Functionalized Probes for Chemical Imaging in Universities of Shandong, Key Laboratory of Molecular and Nano Probes, Ministry of Education, Shandong Provincial Key Laboratory of Clean Production of Fine Chemicals, Shandong Normal University, Jinan 250014, P. R. China
bNational Engineering Research Center for Colloidal Materials, School of Chemistry and Chemical Engineering, Shandong University, Jinan 250100, P. R. China
cCollege of Chemical and Environmental Engineering, Shandong University of Science and Technology, Qingdao, 266590, P. R. China
First published on 31st July 2018
Abstract
The intramolecular proton-transfer processes of thymine were investigated by the density functional theory method. It is shown that the mutation from keto (T) to enol (T′) form is affected by zeolitic imidazolate framework-8 (ZIF-8) fragments such as single 2-methylimidazole neutral crystals (M), and negatively charged 2-methylimidazole ligands (M−). Results show that with the number (n) of water (w) molecules that assist proton-transfer increasing from 1 to 4, the order of the tautomeric energy barriers (in kcal mol−1) is T-2w (16.3) < T-1w (17.6) < T-3w (17.8) < T-4w (20.5). In the presence of M, the order of energy barrier is MT-2w (16.6) < MT-1w (17.7) < MT-3w (18.9) < MT-4w (20.8). M− has a catalysis effect on the energy barrier and the order is M−T-2w (14.4) < M−T-3w (15.2) < M−T-1w (16.3) < M−T-4w (16.8). The attachment of the M− fragment slightly promotes the proton-transfer processes in some instances. The characterization of the proton-transfer processes is helpful to understand the genotoxicity of ZIF-8 during drug delivery applications.
I. Introduction
Imparting porous nanomaterials as drug delivery tools has many advantages, such as controllable release,1 enhanced permeability and retention effect,2 and active targeting in tumor cells.3 Metal–organic frameworks (MOFs),4 composed of organic linkers and inorganic nodes, are crystalline porous nanomaterials that exhibit tunable porosity and high surface areas.5 Recently, a promising application for MOFs has emerged in the controllable delivery and release of several drug molecules.6–10Thus far, it is worth mentioning that one among the porous materials studied, zeolitic imidazolate framework-8 (ZIF-8) (based on its sodalite structure and its characteristic crystallization in a cubic lattice with a window diameter of 0.34 nm and a pore diameter of 11.6 nm![[thin space (1/6-em)]](https://www.rsc.org/images/entities/char_2009.gif) 11) has become one of the most frequently studied MOFs materials.12 Several researchers have succeeded in the encapsulation of hormones13 and antibiotics14 as well as antitumor and retroviral drugs15 in ZIF-8 by demonstrating high guest loading and controlled release. Moreover, it has been indicated that, with the release of drugs, some MOFs could irreversibly decompose and result in various fragmented units.16,17 For example, several researchers found that the presence of water causes a gradual change in ZIF-8 crystal structure,18,19 which creates zinc bivalent cations (Zn2+), single 2-methylimidazole crystals (M) and negatively charged 2-methylimidazole ligands (M−) (Fig. S1†).
11) has become one of the most frequently studied MOFs materials.12 Several researchers have succeeded in the encapsulation of hormones13 and antibiotics14 as well as antitumor and retroviral drugs15 in ZIF-8 by demonstrating high guest loading and controlled release. Moreover, it has been indicated that, with the release of drugs, some MOFs could irreversibly decompose and result in various fragmented units.16,17 For example, several researchers found that the presence of water causes a gradual change in ZIF-8 crystal structure,18,19 which creates zinc bivalent cations (Zn2+), single 2-methylimidazole crystals (M) and negatively charged 2-methylimidazole ligands (M−) (Fig. S1†).
Proton-transfer of nucleic acid bases induced by excitation20 including metal cations or charges always occurrs during the replication of DNA or RNA.21 As shown in Fig. 1, one nucleic acid base is “keto thymine” (T) and the other is “enol thymine” (T′). Clearly, if H10 transfers to the O7 site, then T will become T′, which corresponds to the T → T′ tautomeric process. For the adenine–T base pair, such a point mutation, i.e., a proton-transfer process, would lead to T tautomerization and guanine-T′ mispairing of the bases (Fig. S2†).22
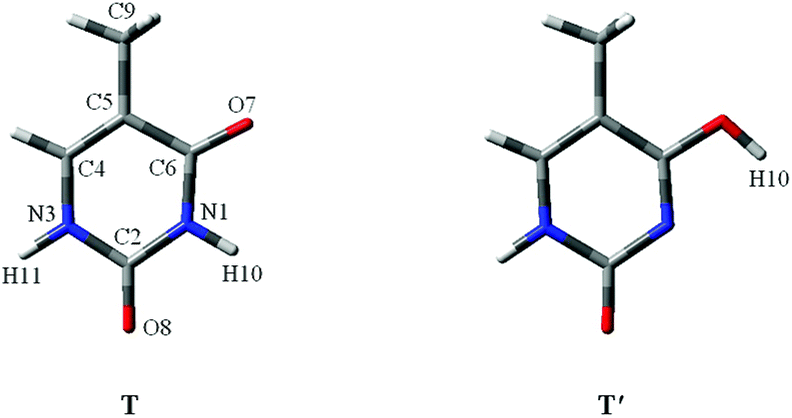 | ||
| Fig. 1 The molecular structures of two stable thymine tautomers investigated. O, C, N and atoms are shown in red, gray and blue colors, respectively. | ||
It has already been proven that Zn2+ does not affect the cell culture, and are also buffered by proteins existing in the media.23 In addition, Zn2+ has a primary hydration sphere of five in the water environment.24 The tautomeric process of bases under the influence of hydrated Zn2+ is thermodynamically unfavoured in vivo.25 Therefore, except for the fully studied Zn2+, other fragments from decomposed ZIF-8, particularly M−, an active intermediate,26 should be investigated when using ZIF-8 as drug delivery systems to assess whether they would cause proton-transfer of bases or even gene mutations.
In this study, we investigated the interactions of ZIF-8 fragments, namely, M and M−, with T. The surrounding water molecules were also included because they can act both as proton acceptors and donors, and accelerate the tautomeric processes from canonical base-pairing to rare base-pairing.21,26 The interactions between these fragments and thymine in the tautomeric equilibria are discussed. The structural parameters, energy changes, charge distributions and natural bond orbital (NBO) analysis were calculated via the density functional theory (DFT) method. Although the investigations focus on ZIF-8, it is expected that the conclusion is transferable to other ZIFs. Furthermore, it is likely that the conclusions made in this study would lead to deeper insight into the evaluation of MOFs material used as drug delivery systems.
II. Computational methods
It is expected that both B3LYP and MP2 methods would give very similar results for the geometrical and vibrational features of bases,27 and DFT is an excellent compromise between computational cost and reasonable results.28 Peiro-Garcia and Nebot-Gil employed the B3LYP/6-311++G** basis set, which provided a much better energy description of the interaction between the metal ions, NA bases, and micro-hydration bases.29 In this study, for a proper and accurate consideration, optimization was performed by using the [6-311++G**] basis set. Energy profile, frequency calculation, as well as zero-point energy (ZPE) corrections were performed at the same level. Moreover, the bond lengths and energies of the optimized structures were also compared with the results by MP2. All computed values were ZPE corrected unless otherwise noted.The computed stationary points were characterized as minima or transition states by diagonalizing the Hessian matrix and analyzing the vibrational normal modes. In this way, the stationary points could be classified as minima if no imaginary frequencies were observed, or as transition states if only one imaginary frequency was obtained.30 The intrinsic reaction coordinate (IRC) was followed with the DFT method to make sure that the transition state connects with the expected reactants and products. In order to investigate the nature of interactions between bases and the fragments, net atomic charges were obtained by using the NBO analysis of Weinhold et al.31 Correspondingly, analysis on the charge distribution and molecular orbital information was also performed. The abbreviations of n and w represent the number of water molecules and water molecule, respectively.
All calculations were performed with the GAUSSIAN 03 (ref. 32) suite of packages.
III. Results and discussion
It should be noted that all of the tautomeric processes are not discussed in this study because the tautomers of thymine can be produced by proton-transfer and internal rotation of the hydroxylic group of the enol form. It is believed that one tautomer can be converted into any other tautomer, directly or indirectly. The transitions can build up complicated networks between these tautomers. To make a concise but in-depth discussion, the most stable form,27 T, and its most stable tautomer30 in the gas phase or micro-water environment, T′, (Fig. 1) were taken as the main research objects for discussion. Moreover, the proton-transfer process between T and another stable tautomer,30 T′′, as shown in Fig. S3,† was investigated.It is worth noting that the influence of water assisting proton-transfer was also studies because water molecules can greatly decrease the energy barrier in base tautomerization.33 In the selected tautomeric process of T → T′, when water molecules act as both proton acceptor and donor, the energetically favoured location is in the vicinity of the O7–C6–N1–H10 region (Fig. 1). Therefore, the fragments are considered as external influencing factors via the interactions occurring through another active site of T, that is, the O8 area.34 In the process of T → T′′, the location of the water molecules is favoured in the vicinity of the O8–C2–N3–H11 region, and the external influencing fragments are considered at O7 area.
III.a. Proton-transfer process of T → T′
The geometrical parameters of T and T′, and T-ts (the transition state) are listed in Table S1.† Data comparison of the T structure indicates that results in this study are in good agreement not only with the theoretical results35 obtained at the P3/6-31++G** level, but also with those that have been obtained on investigation with multi-reference ab initio methods.36 The stable energy (in kcal mol−1) of T and T′ is 0 and 11.0, respectively, which is in good agreement with theoretical predictions of 0 and 10.2, obtained by the MP2 (RI-MP2) method.30In the tautomeric process of T → T′, as depicted in Fig. 2, the optimized bond lengths of N1–H10 are 1.015, 1.340, and 2.244 Å in T, T-ts, and T′, respectively. The energy barrier height is 28.8 kcal mol−1, which is the same as that obtained by Fan et al.30 (28.8 kcal mol−1) at MP2/6-311++G** level of theory. The value of 17.8 kcal mol−1 is larger than that of the reversed process. Therefore, the tautomeric process is not favoured on a thermo-dynamics basis, implying that it is not easy to transfer from a relatively stable tautomer to an unstable state.
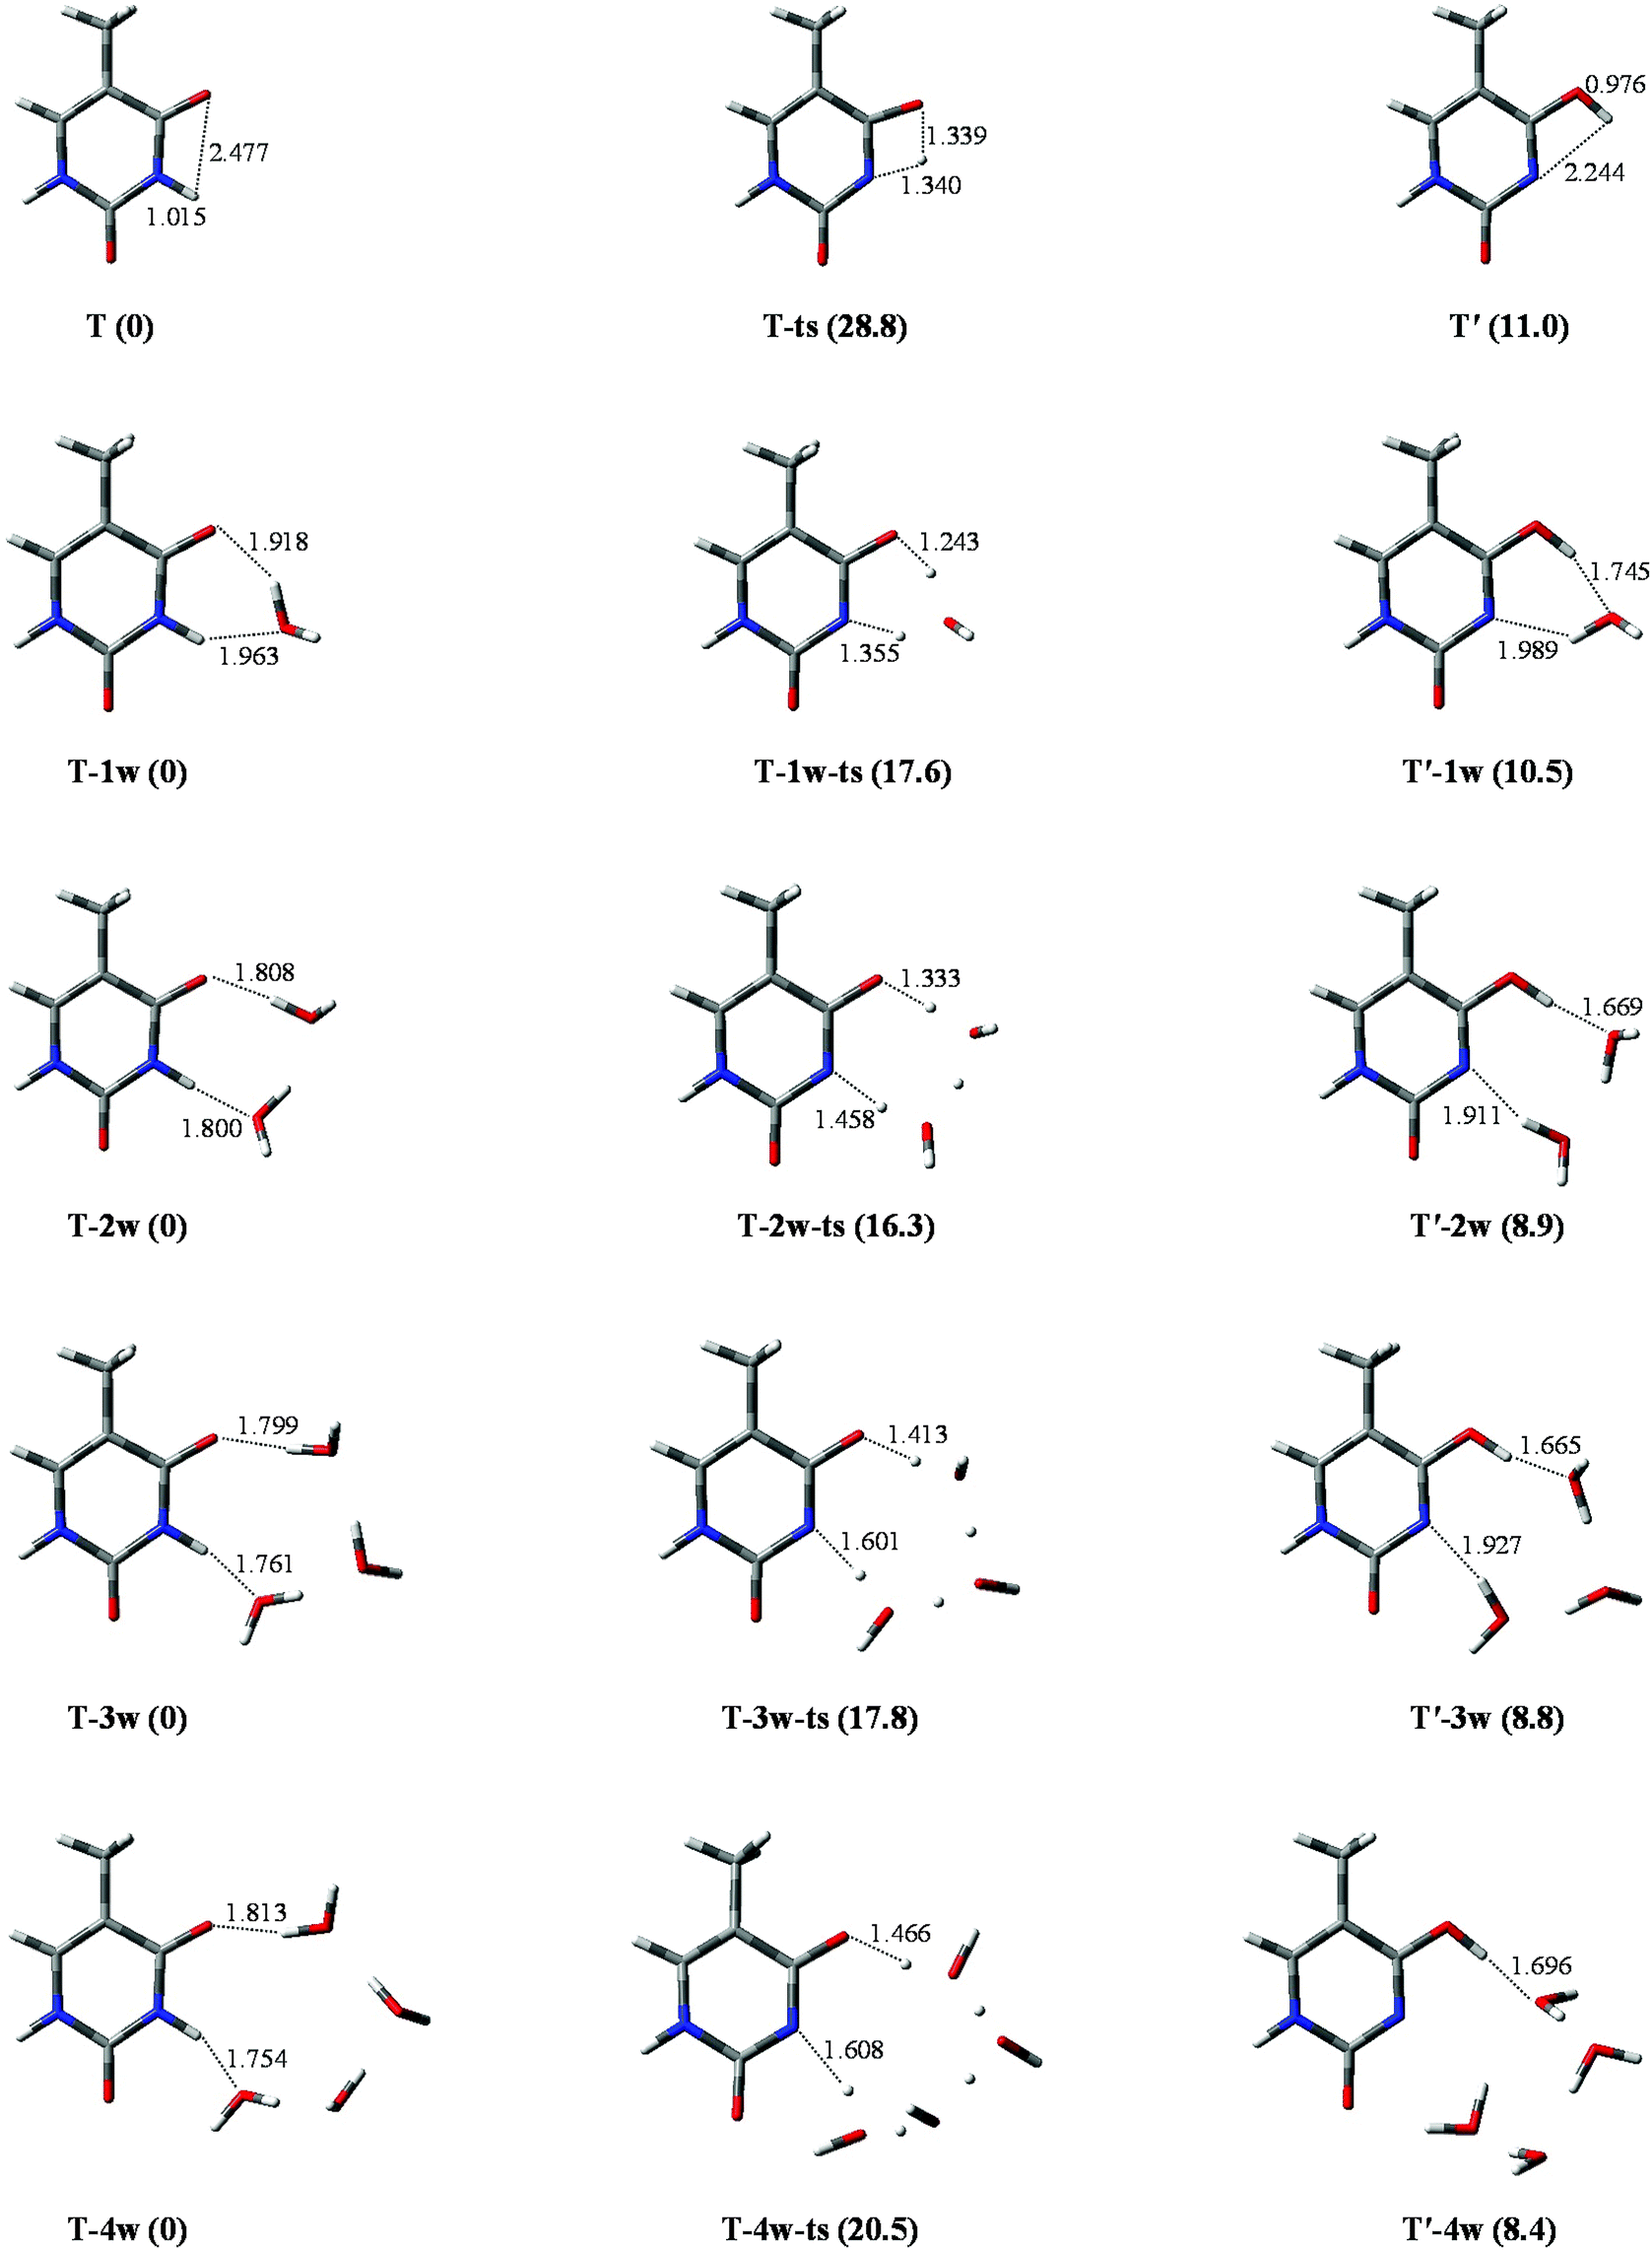 | ||
| Fig. 2 Optimized geometries in the tautomeric processes of T-nw → T′-nw. The route of proton-transfer are connected by dashed lines. Bond distances in angstrom (Å). Energies in kcal mol−1. | ||
III.b. T → T′ affected by hydration
The tautomeric processes of T-nw → T′-nw affected by water molecules are shown in Fig. 2. A large change is observed relative to that in the non-hydrated case. In the initial stable structure (T-1w), two hydrogen bond lengths between T and water are 1.918 and 1.963 Å, respectively, which are consistent with the corresponding bond lengths reported by Kim et al.37 calculated at the B3LYP/DZP++ level. The two hydrogen bond lengths optimized by MP2 are 1.863 and 1.859 Å, respectively, which are 0.055 and 0.104 Å shorter than those obtained by the other two methods. Then, the water molecule accepts the proton from N1 and donates its proton to O7, extending the bond length of N1–H10 to 1.355 Å (1.439 Å by MP2). The attachment of a water molecule plays the “bridge” role for proton-transfer, i.e., both acceptor and donator. Once the proton attaches to the O7 site, T-1w becomes T′-1w. Compared with T → T′, the attachment of a water molecule can decrease the energy barrier height by 11.2 kcal mol−1 (from 28.8 to 17.6 kcal mol−1), which is in good agreement with the result (12.6 kcal mol−1) reported by Fan et al.30According to the bond lengths shown in Fig. 2, two water molecules constitute the route of the “bridge” and decrease the distances of proton-transfer. Thus, the energy barrier height of T-2w → T′-2w is 16.3 kcal mol−1, which is lower by 1.3 kcal mol−1 relative to the monohydrated tautomeric process. Di-hydration further reinforces the assisted effect of the proton-transfer on the tautomeric process. Compared to the T-2w → T′-2w process, the energy barrier in the trihydrated tautomeric process, rather than decreasing, increased by 1.5 kcal mol−1. This is due to the high energy cost of proton-transfer in a long trihydrated chain. The addition of the fourth water molecule elongates the route of proton-transfer. Therefore, the energy barrier height of the tautomeric process is 20.5 kcal mol−1, which is 2.7 kcal mol−1 larger than that of trihydrated case.
III.c. T → T′ affected by M
To further investigate the influence of M on the tautomeric process, 20 structures (with/without hydration) were analyzed. All these structures were examined at the B3LYP/6-311++G** and MP2/6-311++G** levels. The optimized geometries reveal that M prefers to attach to the adjacent area of O8 and H11 rather than to other sites. Correspondingly, the selected monodentate coordination complexes (to O8) and the bi-dentate coordination complexes (to O8 and H11) are optimized. Furthermore, vibrational analysis indicates that only one structure in which two hydrogen bonds link M and T, forming an eight-membered ring with N17⋯H11 and H24⋯O8 bonds (Fig. 3a), is lowest on the potential energy surface. The bond lengths of the most stable structure are 1.909 and 2.335 Å, calculated by B3LYP, which are 0.019 and 0.116 Å longer than the corresponding bond length calculated by MP2.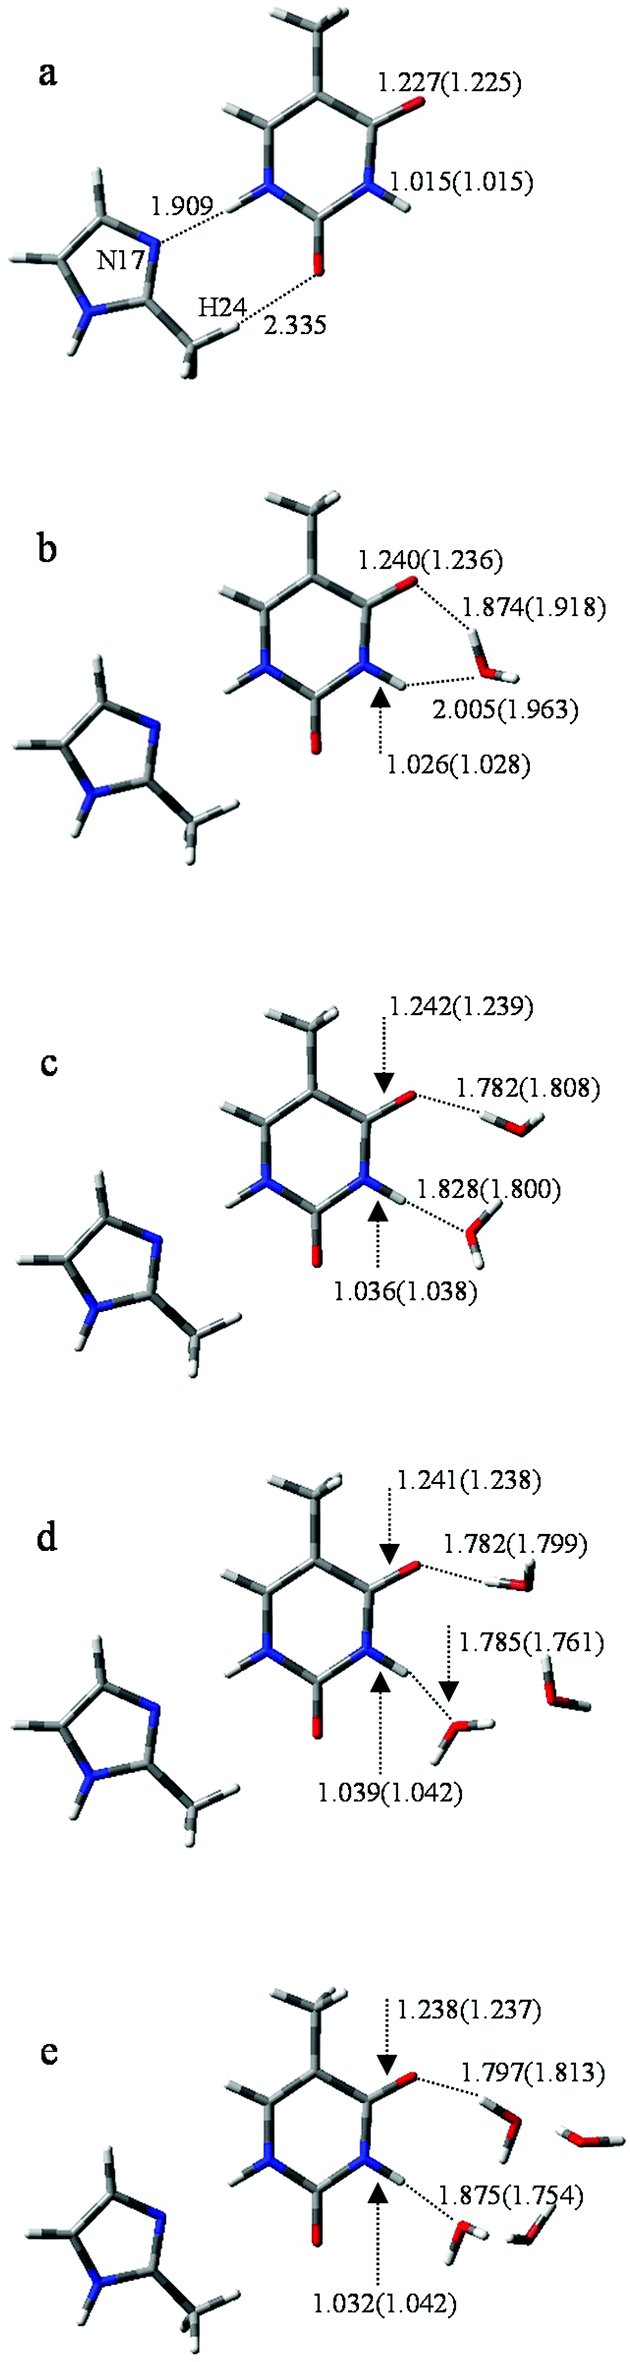 | ||
| Fig. 3 Optimized geometries of T-nw combined with M. Data listed in parentheses is the bond distances (Å) of T-nw. | ||
According to the bond lengths shown in Fig. 3 and the charge distributions listed in Table S2,† the attachment of M has negligible influence to the base. For example, the charge distribution on each atom in MT, particularly the bonding atoms, almost equals that in the T structure without M attached (N3: −0.638 in T and −0.647 in MT; H11: 0.456 in T and 0.477 in MT). The reason for this is that M is an electroneutral fragment and the electron cloud is concentrated in the internal area of the pentyl ring. Thus, the energy barriers in the tautomeric processes change slightly compared to the T-nw complexes, and the values are 28.6 kcal mol−1 (MT-ts), 17.7 kcal mol−1 (MT-1w-ts), 16.6 kcal mol−1 (MT-2w-ts), 18.9 kcal mol−1 (MT-3w-ts), 20.8 kcal mol−1 (MT-4w-ts) kcal mol−1. The results indicate that M has negligible influence on the T → T′ proton-transfer processes and on the probability of gene mutation in a micro-water environment.
In addition, the relative energy of the proton-transferred structures is not influenced by M. The energies are 12.0 (MT′), 10.9 (MT′-1w), 9.2 (MT′-2w), 9.1 (MT′-3w), and 9.9 (MT′-4w) kcal mol−1, which are the same as those in the T structures (Table S3†).
III.d. T → T′ affected by M−
The optimized results for anion radical structure, namely, M−T, shows some interesting structural changes compared to neutral MT. As shown in Fig. 4a, a distinct change is the length of the two hydrogen bonds: lengths of H11⋯N17 and H24⋯O8 are 1.882 and 2.663 Å, respectively, while the corresponding hydrogen bond lengths in MT are 1.909 and 2.335 Å. These changes in the strength of the two hydrogen bonds result in a slight rocking of the M−T structure. H10 initially bonds to N1 with a bond length of 1.012 Å and the distance between H10 and O7 is 2.465 Å. As the proton transfers to O7, such distances are changed to 1.321 and 1.322 Å at the transition state and finally to 2.181 and 0.974 Å when the proton-transfer process is completed. The optimized results of the bond lengths obtained by the MP2 method also confirm the reliability of the hydrogen-bonding structures and transition states.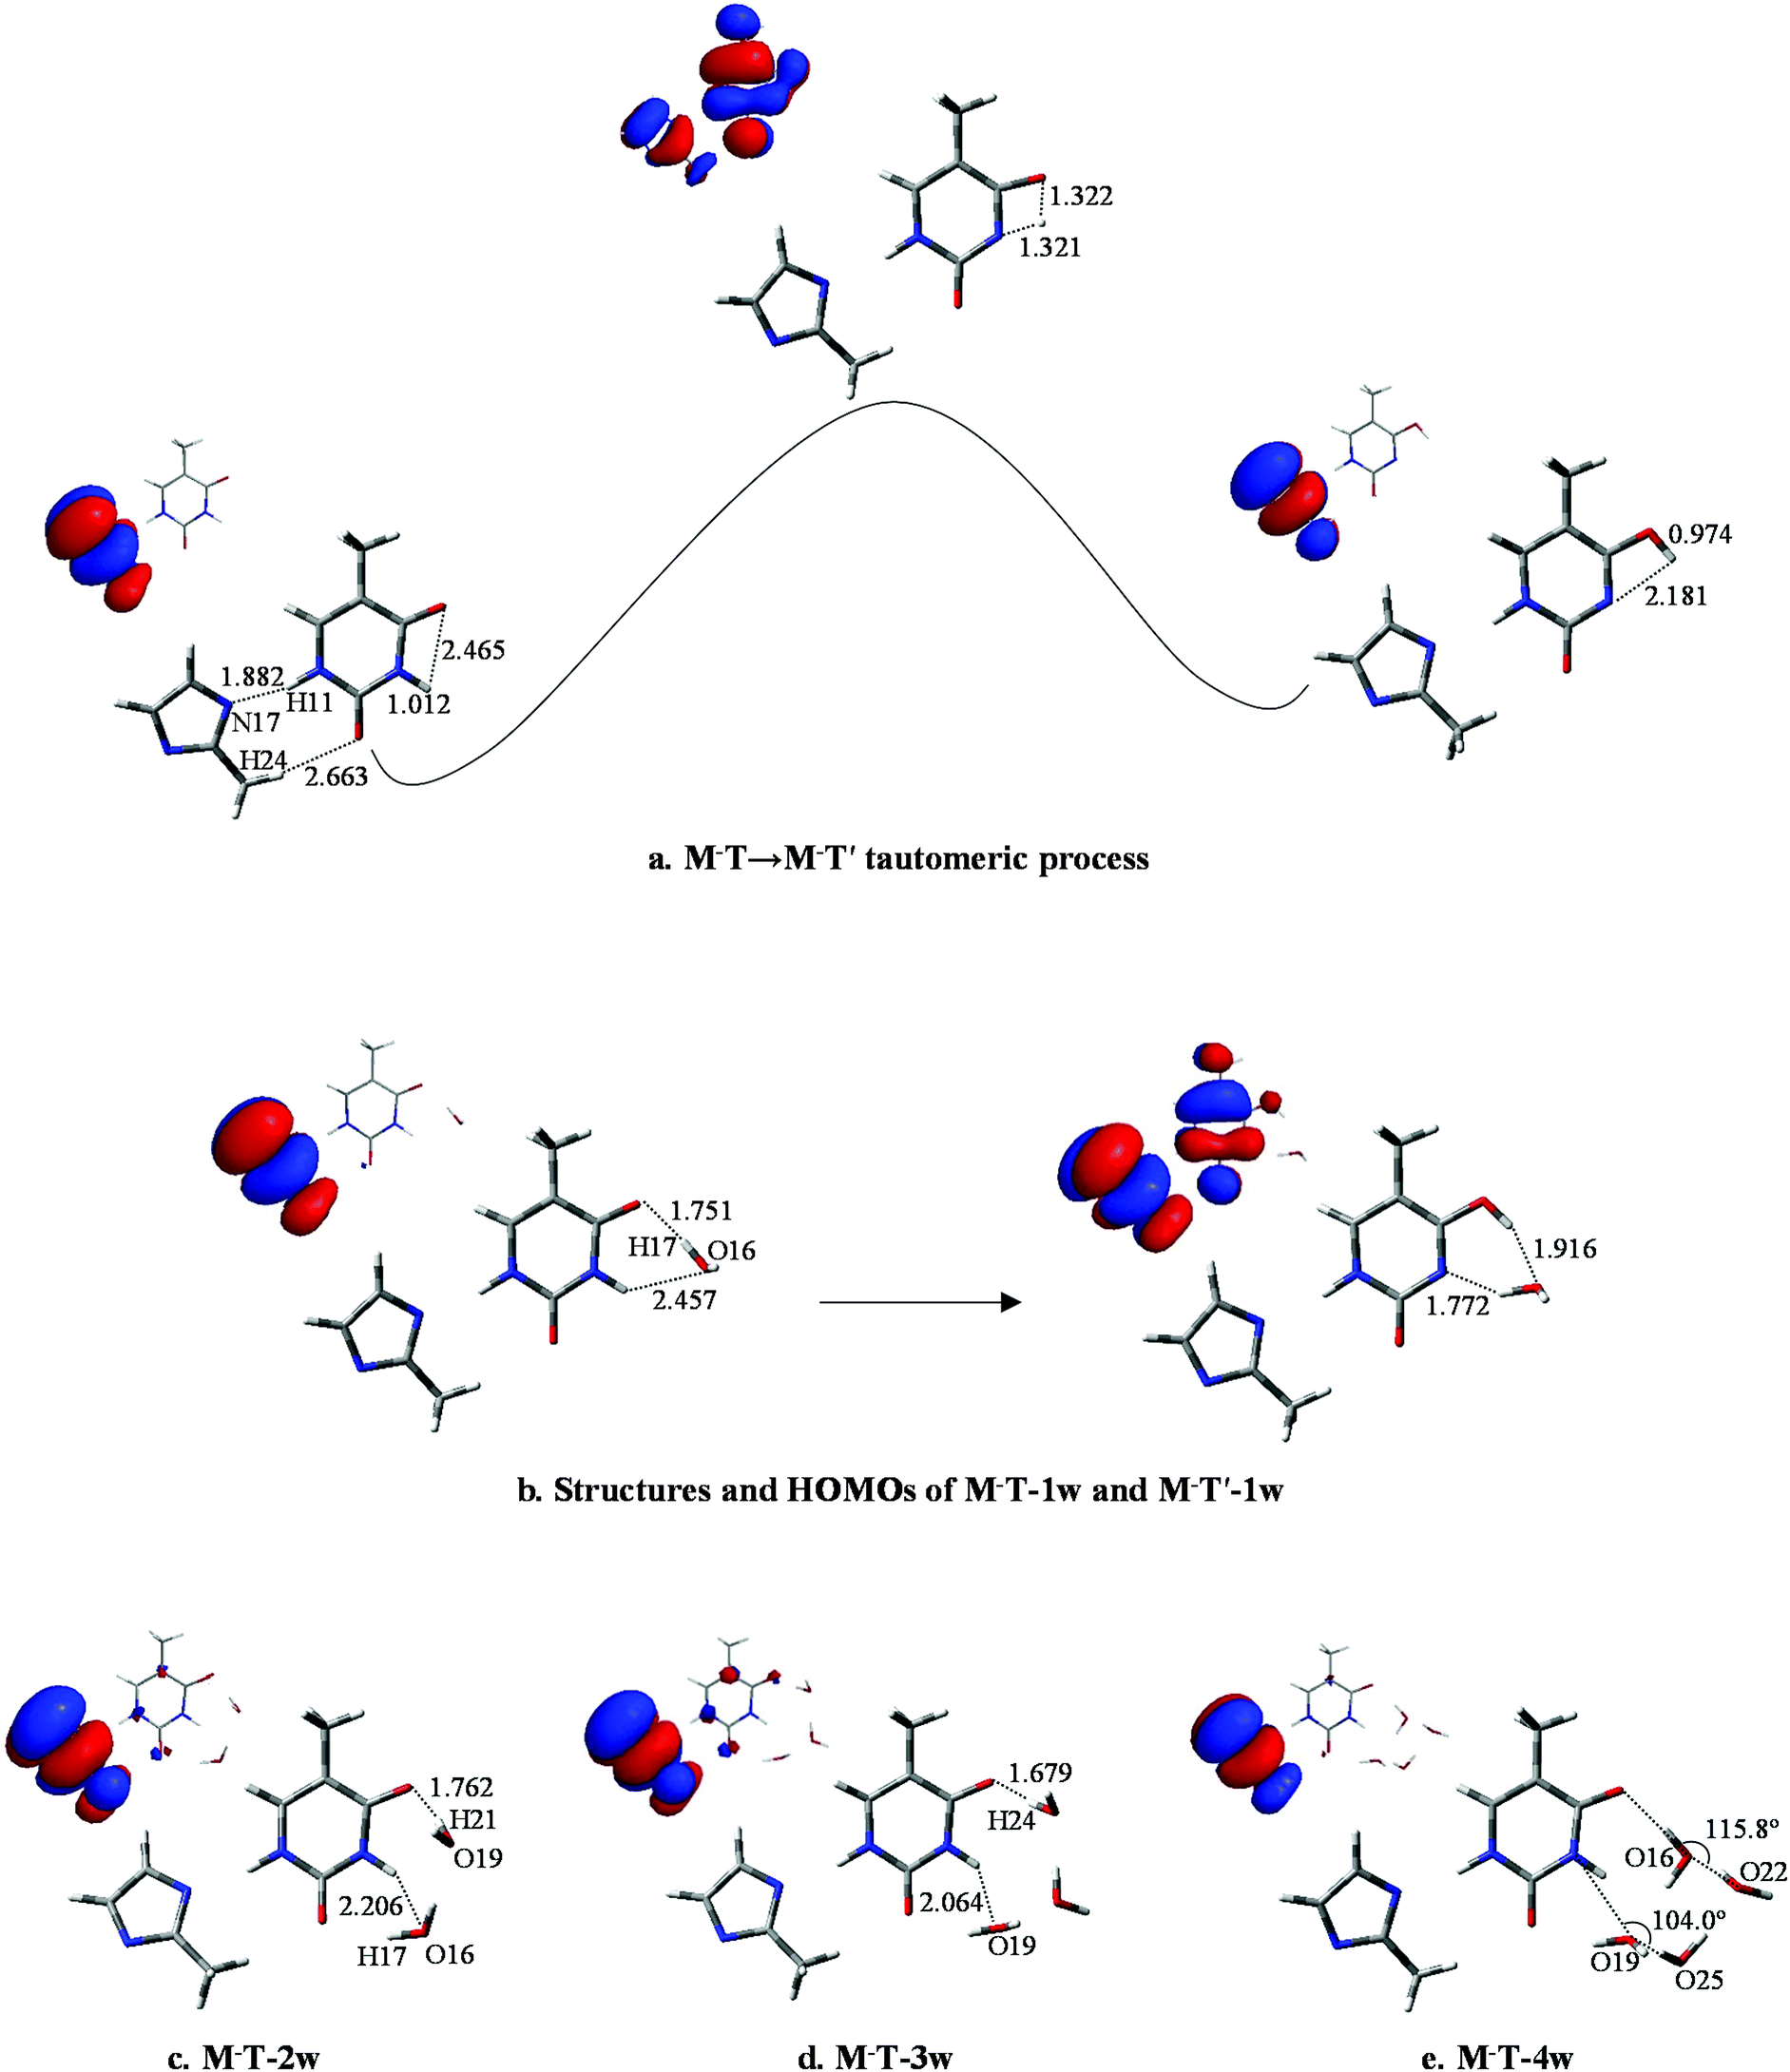 | ||
| Fig. 4 Typical structures and HOMOs profiles of M−T-nw. Bond distances in angstrom (Å). | ||
In M−T, the excess electron is localized on a π* orbital of the M− moiety and affects the T structure, causing the bond lengths of N1–H10 and C5–O7 to be reduced to 1.012 and 1.225 Å, respectively. The structure variation increases the distance between H10 and O7. The energy barrier height of M−T → M−T′ is 37.0 kcal mol−1, which is 8.4 kcal mol−1 larger than that of MT → MT′. Hence, the tautomeric process of M−T → M−T′ is less favourable than MT → MT′ due to the higher energy barrier for H10 to overcome.
In M−T-1w, the charges are redistributed and the energy barrier height in the tautomeric process is decreased. When fragment M− attaches to the base, as shown in Fig. 4b, the extra electron mainly resides on the M− moiety (−0.510, see Table S4†). Affected by the negative charge, the energy barrier height is reduced to 16.3 kcal mol−1, which is 1.4 kcal mol−1 less than that of MT-1w. Finally, as shown in Fig. 4b, the proton-transferred structure M−T′-1w is found when H10 departs from N1 at a distance of 1.772 Å, with the relative energy of 12.0 kcal mol−1. The electron is located on both of the M−, T′ parts and the charge distribution on T′ increases to −0.554.
As shown in Fig. 4c, distinct structural changes occur in M−T-2w compared to the geometric features of the neutral species. In MT-2w, optimization reveals that M, T and water are almost in a plane arrangement, whereas they have undergone a structural deformation in M−T-2w. Particularly, the dihedral angle of N1–C6–O7–O19 and O16–N1–C6–O7 are 44.2° and 26.4°, respectively, indicating that water molecules fold toward the center of the base. Data in Table S4† indicate that compared to M−T-1w, the negative charge distribution on T in M−T-2w is enhanced (Table S4†), causing the attraction to H21 in the water molecule. The energy barrier height of the tautomeric process is 14.4 kcal mol−1, which is lower than that of M−T-1w (16.3 kcal mol−1). Additionally, the energy barrier height is also lower than that of MT-2w (16.6 kcal mol−1). The final stable state, M−T′-2w, was found (Fig. S5†) and the relative energy is 10.5 kcal mol−1 (Table S3†).
According to the structure of M−T-3w (Fig. 4d) and the activation state (Fig. S4†), three water molecules are all involved in the bridge of the proton-transfer. As shown in Fig. 5, the energy barrier height of M−T-3w is 15.2 kcal mol−1, which is lower than that of the neutral counterpart MT-3w (18.9 kcal mol−1). This reveals that, with the attachment of M−, the tautomeric process faces less resistance when compared to the corresponding neutral complex. However, the assistance effect of the negative charge is not further enhanced in the trihydrated complex relative to M−T-2w. Because of the higher energy cost of proton-transfer in a longer hydrated chain, the energy barrier of M−T-3w did not decrease but increased by 0.8 kcal mol−1 when compared to that of M−T-2w. The proton-transferred structure is depicted in Fig. S5† and the relative energy is 9.6 kcal mol−1 (Table S3†), which is similar to that of T′-3w (8.8) and MT′-3w (9.1).
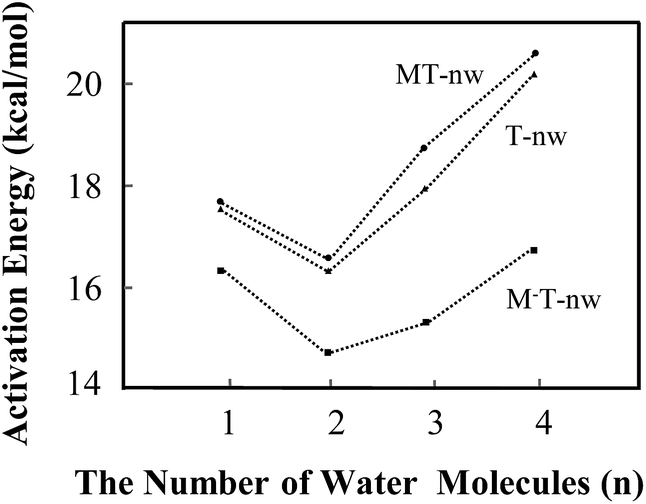 | ||
| Fig. 5 Energy barrier changes obtained from B3LYP in the different tautomeric processes including T-nw → T′-nw, MT-nw → MT′-nw and M−T-nw → M−T′-nw. | ||
The influence of more water in the water cluster was also investigated. As shown in Fig. 4e, the structure of M−T-4w has two hydrogen bonding water molecules in the internal shell and another two in the second shell bonded to the two internal water molecules. The angles N1–O19–O25 and O7–O16–O22 in M−T-4w amount to 104.0° and 115.8°, respectively. Importantly, the first water molecule serves as a bridge of H10 transfer to water clusters. One proton is pointed to O8 and another proton is pointed to the water in the second shell. Thus, the proton-transfer trajectory in the tetrahydrate depends on the four-water-ring, which involves the internal and external water molecules. The optimized transition state shown in Fig. S4† confirms that the tautomeric process is achieved by transferring protons through the water-ring. The energy barrier height is decreased by 4.0 kcal mol−1 compared to that of the corresponding neutral process (Fig. 5).
In the present study, water molecules were in the long-range hydrogen-bonding interaction network. Therefore, it would be helpful to see if CAM-B3LYP usually works better than B3LYP in such situations. As shown in Table S5,† the average barrier heights of neutral and negative species obtained by CAM-B3LYP are 3.7 ± 0.2 (22.3%) and −1.1 ± 0.1 (−6.5%) kcal mol−1 larger than those obtained by B3LYP, respectively. The differences in the energy barrier between neutral and negative species, such as MT-1w-ts and M−T-1w-ts, obtained by CAM-B3LYP and B3LYP are 6.5 and 1.4 kcal mol−1, which are 25% and 8% of the required energy barrier, respectively. The results obtained by MP2 are similar as those from B3LYP. The variation trend is basically consistent, indicating that the calculated results obtained by B3LYP, as shown in Fig. 5, are still useful. Therefore, in some situations, the attachment of the M− fragment slightly promotes the proton-transfer processes.
In addition, the effect of hydrated M− was also investigated. The results reveal that with the increase in number of water molecules surrounding M−, negative charge distributions on the water molecules also increased. Thus, the water molecules around the M− fragment significantly reduce the effect of M− on the proton-transfer processes. For example, the energy barrier of monohydrated M−T-2w is 15.8 kcal mol−1, which is 1.4 kcal mol−1 larger than that of M−T-2w and close to that of the corresponding neutral species MT-2w (16.6 kcal mol−1). More energy barrier heights are listed in Table S6.† It is believed that the attachment of hydrated M− does not significantly affect the proton-transfer processes.
III.e. T → T′ proton-transfer rates
Previous studies have shown that the quantum tunnelling effects cannot be ruled out in the base–water complex even at 300 K.38 The inclusion of quantum mechanical tunnelling can drastically increase the proton-transfer rate. Using the parabolic barrier approximation and one-dimensional model,38 the tunnelling rates were evaluated to be 1010 times larger than the classical tunnelling rate in the gas phase and 103 to 104 times larger than the classical proton-transfer rate in the water assisted process. For example, the proton-transfer rate of M−T is 7.7 × 10⁻¹² s−1, but this rate increases to 1.6 × 10⁻³ s−1 when the tunnelling effect is taken into consideration. This phenomenon also occurs in M−T-1w, and the rate increased from 2.9 × 10³ s−1 to 7.3 × 10⁶ s−1. Because the temperature dependence of the tunnelling rate is negligible for temperatures up to about 300 K,39 our results suggest the importance of the tunnelling effect.III.f. Proton-transfer process of T → T′′ affected by hydration, M and M−
The energy barriers change in the different tautomeric processes, namely, T-nw → T′′-nw, MT-nw → MT′′-nw and M−T-nw → M−T′′-nw, which are shown in Fig. S6.† For the neutral complexes, the variation in energy barriers are the same as that in T → T′ processes. The energy barrier is 1–2 kcal mol−1 larger than the corresponding energy barriers in the T → T′ processes. However, M− in the area of O7–C6–N1–H10 holds a hindrance effect on the T → T′′ process. In the presence of M−, the negative electric field causes the charge distribution on N3 to increase from −0.717 (in neutral complexes) to −0.825 and the bond strength of N3–H11 is enhanced. Therefore, energy barrier heights affected by M− are about 0.5 kcal mol−1 larger than that of the corresponding neutral species. The results reveal that the attachment of M− in the area of O7–C6–N1–H10 is not favourable towards the proton-transfer processes of T → T′′ assisted by hydration.We are aware of the fact that the molecular simulation study for some of the intramolecular proton-transfer processes of thymine under the influence of the ZIF-8 fragments in this study has limitations. The results can represent only part of the proton-transfer processes and they may not be transferred rigorously to solution.
IV. Conclusions
In this study, energy profiles together with the evolution of structural and electronic properties were employed to characterize the tautomeric processes of T base. With the number of assisting water molecules increasing from 1 to 4, the mechanism of tautomerization affected by the ZIF-8 fragments such as M and M− were investigated.In the tautomeric process of T → T′, the energy barrier height (in kcal mol−1) was found to be in the order of T-2w (16.3) < T-1w (17.6) < T-3w (17.8) < T-4w (20.5). In the presence of M, the order of energy barrier is MT-2w (16.6) < MT-1w (17.7) < MT-3w (18.9) < MT-4w (20.8). With a negative fragment M− attached to T hydrates, the energy barrier height can be decreased further. The order was determined to be M−T-2w (14.4) < M−T-3w (15.2) < M−T-1w (16.3) < M−T-4w (16.8). The quantum tunnelling effects cannot be ruled out in the base–water complex. In addition, M− in the area of O7–C6–N1–H10 has a hindrance effect on the T → T′′ process. The attachment of the M− fragment slightly promotes the proton-transfer processes of thymine in some situations.
Conflicts of interest
There are no conflicts to declare.Acknowledgements
The authors gratefully acknowledge financial support of the National Natural Science Foundation of China (No. 21575080, 21275091, 21175084).References
- Z. Tao, RSC Adv., 2014, 4, 18961–18980 RSC.
- N. Bertrand, J. Wu, X. Xu, N. Kamaly and O. C. Farokhzad, Adv. Drug Delivery Rev., 2014, 66, 2–25 CrossRef PubMed.
- C. S. Kim, B. Duncan, B. Creran and V. M. Rotello, Nano Today, 2013, 8, 439–447 CrossRef PubMed.
- M. L. Hu, V. Safarifard, E. Doustkhah, S. Rostamnia and A. Morsali, Microporous Mesoporous Mater., 2018, 256, 111–127 CrossRef.
- J. Yang, C. A. Trickett, S. B. Alahmadi, A. Alshammari and O. M. Yaghi, J. Am. Chem. Soc., 2017, 139, 8118–8121 CrossRef PubMed.
- R. C. Huxford, J. Della Rocca and W. Lin, Curr. Opin. Chem. Biol., 2010, 14, 262–268 CrossRef PubMed.
- A. C. McKinlay, R. E. Morris, P. Horcajada, G. Ferey and R. Gref, Angew. Chem., Int. Ed., 2010, 49, 6260–6266 CrossRef PubMed.
- J. Wang, J. Jin, F. Li, B. Li and J. Liu, RSC Adv., 2015, 5, 85606–85612 RSC.
- P. Horcajada, C. Serre, G. Maurin, N. A. Ramsahye and F. Balas, J. Am. Chem. Soc., 2008, 130, 6774–6780 CrossRef PubMed.
- P. Horcajada, C. Serre, M. Vallet-Regi, M. Sebban, F. Taulelle and G. Ferey, Angew. Chem., 2006, 118, 6120–6124 CrossRef.
- X. Fan, J. Zhou, T. Wang, J. Zheng and X. Li, RSC Adv., 2015, 5, 58595–58599 RSC.
- H. Bux, C. Chmelik, J. M. van Baten, R. Krishna and J. Caro, Adv. Mater., 2010, 22, 4741–4743 CrossRef PubMed.
- N. Liedana, A. Galve, C. Rubio, C. Tellez and J. Coronas, ACS Appl. Mater. Interfaces, 2012, 4, 5016–5021 CrossRef PubMed.
- P. Horcajada, T. Chalati, C. Serre, B. Gillet and C. Sebrie, Nat. Mater., 2010, 9, 172–178 CrossRef PubMed.
- C. Y. Sun, C. Qin, X. L. Wang, G. S. Yang and K. Z. Shao, Dalton Trans., 2012, 41, 6906–6909 RSC.
- W. J. Rieter, K. M. Pott, K. M. L. Taylor and W. Lin, J. Am. Chem. Soc., 2008, 130, 11584–11585 CrossRef PubMed.
- H. Jasuja, Y. Jiao, N. C. Burtch, Y. Huang and K. S. Walton, Langmuir, 2014, 30, 14300–14307 CrossRef PubMed.
- K. A. McDonald, N. Ko and K. Noh, Chem. Commun., 2017, 53, 7808–7811 RSC.
- H. Liu, P. Guo and T. Regueira, J. Phys. Chem. C, 2016, 120, 13287–13294 CrossRef.
- F. Hajareh, H. Hadadzadeh, H. Farrokhpour, F. Abyar and H. A. Rudbari, RSC Adv., 2016, 6, 23913–23929 RSC.
- E. Romero and F. E. Hernandez, Phys. Chem. Chem. Phys., 2018, 20, 1198–1209 RSC.
- I. D
![[a with combining cedilla]](https://www.rsc.org/images/entities/char_0061_0327.gif) bkowska, M. Gutowski and J. Rak, J. Am. Chem. Soc., 2005, 127, 2238–2248 CrossRef PubMed.
bkowska, M. Gutowski and J. Rak, J. Am. Chem. Soc., 2005, 127, 2238–2248 CrossRef PubMed. - J. Raaflaub, Applications of metal buffers and metal indicators in biochemistry, John Wiley & Sons, Inc., Hoboken, NJ, 1956 Search PubMed.
- D. Li, Y. Han, H. Li, P. Zhang, Q. Kang and D. Shen, RSC Adv., 2018, 8, 11021–11026 RSC.
- C. Tamames-Tabar, D. Cunha and E. Imbuluzqueta, J. Mater. Chem. B, 2014, 2, 262–271 RSC.
- D. Almeida, R. Antunes, G. Martins, S. Eden and F. Ferreira da Silva, Phys. Chem. Chem. Phys., 2011, 13, 15657–15665 RSC.
- X. Hu, H. Li, W. Liang and S. Han, J. Phys. Chem. B, 2004, 108, 12999–13007 CrossRef.
- C. Gutle, J. Y. Salpin, T. Cartailler, J. Tortajada and M. P. Gaigeot, J. Phys. Chem. A, 2006, 110, 11684–11694 CrossRef PubMed.
- J. Peiro-Garcia and I. Nebot-Gil, ChemPhysChem, 2003, 4, 843–847 CrossRef PubMed.
- J. C. Fan, Z. C. Shang, J. Liang, X. H. Liu and H. Jin, J. Mol. Struct., 2010, 939, 106–111 CrossRef.
- F. J. Weinhold and J. E. Carpenter, The structure of small molecules and ions, Plenum, New York, 1988 Search PubMed.
- M. J. Frisch, G. W. Trucks, H. B. Schlegel, G. E. Scuseria, M. A. Robb, J. R. Cheeseman, J. A. Montgomery Jr, T. Vreven, K. N. Kudin, J. C. Burant, J. M. Millam, S. S. Iyengar, J. Tomasi, V. Barone, B. Mennucci, M. Cossi, G. Scalmani, N. Rega, R. Petersson, H. Nakatsuji, M. Hada, M. Ehara, K. Toyota, R. Fukuda, J. Hasegawa, M. Ishida, T. Nakajima, Y. Honda, O. Kitao, H. Nakai, M. Klene, X. Li, J. E. Knox, H. P. Hratchian, J. B. Cross, V. Bakken, C. Adamo, R. Jaramillo, R. Gomperts, R. E. Stratmann, O. Yazyev, A. J. Austin, R. Cammi, C. Pomelli, J. W. Ochterski, P. Y. Ayala, K. Morokuma, G. A. Voth, P. Salvador, J. J. Dannenberg, V. G. Zakrzewski, S. Dapprich, A. D. Daniels, M. C. Strain, O. Farkas, D. K. Malick, A. D. Rabuck, K. Raghavachari, J. B. Foresman, J. V. Oritz, Q. Cui, A. G. Baboul, S. Clifford, J. Cioslowski, B. B. Stefanov, G. Liu, A. Liashenko, P. Piskorz, I. Komaromi, R. L. Martin, D. J. Fox, T. Keith, M. A. Al-Laham, C. Y. Peng, A. Nanayakkara, M. Challacombe, P. M. W. Gill, B. Johnson, W. Chen, M. W. Wong, C. Gonzalez and J. A. Pople, Gaussian 03, Revision C.02, Gaussian, Inc., Pittsburgh, PA, 2003 Search PubMed.
- D. Li and H. Ai, J. Phys. Chem. B, 2009, 113, 11732–11742 CrossRef PubMed.
- M. Kabelac and P. Hobza, J. Phys. Chem. B, 2006, 110, 14515–14523 CrossRef PubMed.
- D. M. Close, C. E. Crespo-Hernandez, L. Gorb and J. Leszczynski, J. Phys. Chem. A, 2008, 112, 4405–4409 CrossRef PubMed.
- S. Perun, A. L. Sobolewski and W. Domcke, J. Phys. Chem. A, 2006, 110, 13238–13244 CrossRef PubMed.
- S. Kim, S. E. Wheeler and H. F. Schaefer, J. Chem. Phys., 2006, 124, 204–310 Search PubMed.
- J. Gu and J. Leszczynski, J. Phys. Chem. A, 1999, 103, 2744–2750 CrossRef.
- L. A. Curtiss, D. L. Drapcho and J. A. Pople, Chem. Phys. Lett., 1984, 103, 437–442 CrossRef.
Footnote |
| † Electronic supplementary information (ESI) available. See DOI: 10.1039/c8ra03817a |
| This journal is © The Royal Society of Chemistry 2018 |